Power To Liquid Market: Global Industry Analysis and Forecast (2024-2030)

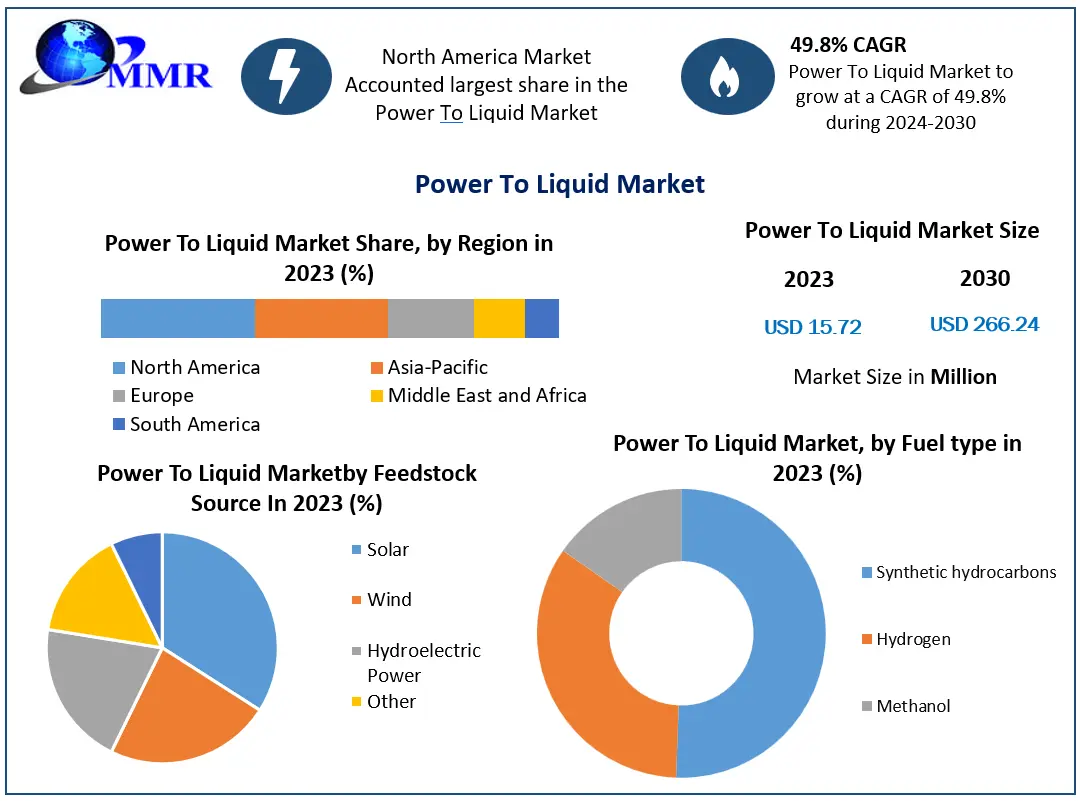
The Growth of the Power to Liquid Market is forecasted at a CAGR of 49.8% during 2024-2030. A detailed description of the factors and market trends pertaining to different regions is given in detail in the report. The Power-to-Liquid (PtL) market is poised for growth as the world seeks sustainable energy solutions. The Power to Liquid (PtL) technology represents an innovative approach to the production of carbon-neutral liquid fuels from renewable energy sources. PtL involves the conversion of electrical power, sourced from renewable energy generation, into chemical energy carriers such as hydrogen or synthetic hydrocarbons. These synthetic fuels are then utilized across various sectors, with a primary focus on addressing energy storage challenges and reducing carbon emissions in transportation. PtL fuels find applications in aviation, shipping, heavy-duty transportation, and other sectors where electrification is currently impractical. The Power to Liquid market has witnessed significant growth in recent years due to the rising demand for sustainable alternatives to traditional fossil fuels. As countries worldwide prioritize decarbonization and explore options to reduce greenhouse gas emissions, the PtL technology presents a promising solution. The PtL market is still in its early stages of development, with a relatively niche presence. However, several research and development efforts are focused on advancing PtL technologies, optimizing conversion processes, and reducing production costs. Thus, while the market is still emerging, ongoing advancements in Power to Liquid technologies hold promise for a more sustainable and greener energy future. The report provides a comprehensive overview of the Power-to-Liquid (PtL) market, analyzing its current landscape, drivers, applications, and competitive factors. By offering valuable insights and information, the report aims to assist stakeholders in making informed decisions, fostering innovation, and contributing to the development of a sustainable and decarbonized energy future. Power To Liquid MarketTo know about the Research Methodology :- Request Free Sample Report

Power to liquid Market Dynamics

Market Drivers The Power-to-Liquid (PtL) market is driven by several factors that contribute to its growth and development. Firstly, the increasing integration of renewable energy sources in the power sector is a key driver for PtL technology. With the rising deployment of wind and solar energy, there is a growing need for efficient energy storage solutions. PtL offers a viable option by converting surplus renewable electricity into storable liquid fuels, enabling better integration of renewables into the grid. For instance, in 2022, Germany's largest energy company, RWE, announced its plans to build a PtL plant that would produce synthetic aviation fuel from renewable electricity and CO2 from the atmosphere, thereby showcasing the potential of Power to Liquid technology in addressing energy storage challenges. Decarbonization of the transportation sector is another significant driver for the PtL market. The need to reduce carbon emissions in aviation, shipping, and heavy-duty transportation, where electrification is often challenging, creates a demand for PtL fuels. For example, in 2021, Lufthansa Group, a prominent airline, collaborated with a PtL technology company, NovaPura, to develop and promote the use of synthetic fuels for sustainable aviation. This partnership highlights the increasing interest in Power to Liquid as a means to decarbonize the aviation industry. Furthermore, government initiatives and supportive policies play a crucial role in driving the PtL market. Many countries have implemented regulations and incentives to promote renewable energy adoption and reduce carbon emissions. For instance, the European Union's Renewable Energy Directive II sets targets for the share of renewable energy in transport and encourages the use of advanced biofuels, including PtL fuels. Such initiatives create a favorable environment for PtL technology to thrive, attracting investments and fostering market growth.

Market Restraints:

The major restraint faced by the Power to Liquid Industry is the high production costs associated with PtL fuels compared to conventional alternatives. The technology involved in PtL conversions, such as electrolyzers and catalytic processes, is still in its early stages, resulting in higher operational expenses. This cost barrier makes PtL fuels less economically competitive, particularly in price-sensitive markets.

Market Opportunities:

The PtL market presents several opportunities for Power to Liquid key industry players and stakeholders The potential for PtL to provide energy storage, carbon-neutral transportation fuels, and energy security opens avenues for collaboration and partnerships between renewable energy providers, technology developers, and end-users in various sectors. Moreover, the PtL market offers opportunities for innovation and technological advancements. Continued research and development efforts aim to improve conversion efficiency, optimize production processes, and explore new catalysts and feedstocks. For example, in 2021, Siemens Energy and ExxonMobil announced a partnership to develop and commercialize advanced electrolysis technologies for the production of blue and green hydrogen, which can be further used in PtL processes. Such initiatives drive innovation and pave the way for future growth and market expansion.

Market Challenges:

The PtL market encounters various challenges that need to be addressed for its successful development. One of the key challenges is the limited scalability of PtL technology. Scaling up PtL facilities requires significant investments in infrastructure development, including renewable energy generation and distribution systems, electrolyzers, and synthetic fuel production facilities. Coordinating these complex systems and ensuring a consistent supply of renewable electricity for PtL fuel production poses logistical and financial challenges. Another challenge is the availability of a sustainable and abundant source of renewable electricity for PtL processes. PtL technology heavily relies on renewable electricity as the primary input for fuel production. However, challenges such as the intermittency of renewable energy sources, grid integration issues, and regional disparities in renewable energy availability impact the consistent and reliable supply of renewable electricity for PtL production. Furthermore, the Power to Liquid market faces regulatory and policy challenges. Existing policies in some regions are not fully incentivized or support PtL technology adoption and investment. The alignment of regulations and policies that promote renewable energy integration, and carbon reduction targets, and provide financial incentives for PtL projects is crucial for creating an enabling environment for market growth.

Power to Liquid Market Segmentation

The Power to Liquid (PtL) market is segmented based on various factors, including end-use applications, fuel types, technology types, feedstock source types, and geographical regions. Based on Technology types, The Power to Liquid (PtL) market is categorized into electrolysis-based PtL, Fischer-Tropsch synthesis, biological conversion, and methanol conversion. Electrolysis-based PtL technologies, which convert renewable electricity into hydrogen or other energy carriers, offer versatility and scalability. However, Fischer-Tropsch synthesis stands as a widely used process with the potential for future growth. It involves the catalytic conversion of syngas (a mixture of hydrogen and carbon monoxide) into synthetic hydrocarbon fuels. It enables the production of renewable fuels that closely resemble conventional fossil fuels, making it a promising technology for achieving carbon-neutral transportation and industrial applications. Based on fuel types, The Power to Liquid (PtL) market is categorized into synthetic hydrocarbons, hydrogen, and methanol. In the current Power to Liquid (PtL) market, synthetic hydrocarbons produced through Fischer-Tropsch synthesis are the dominant fuel type. These synthetic hydrocarbons closely resemble traditional gasoline, diesel, and jet fuel, making them compatible with existing combustion engines. However, the advancements in hydrogen technologies, positions hydrogen as a promising fuel type with substantial potential for future growth. Hydrogen, generated via electrolysis-based PtL, serves as a versatile energy carrier and has the potential to be used in fuel cells or further processed into other forms of PtL fuels. Based on the feedstock source, The Power to Liquid (PtL) market is categorized into solar, wind, and hydroelectric power. Amongst all the sources, solar energy accounts for the largest share of the current market. Solar energy has experienced significant growth and adoption in recent years due to advancements in solar photovoltaic (PV) technology, decreasing costs, and the abundant availability of sunlight in many regions making it a viable and attractive option. Looking towards the future, it is expected that solar energy will continue to play a prominent role because of its scalability, versatility, and decreasing costs positioning it as a leading renewable energy source that will drive the growth and adoption of PtL technologies in the coming years. Based on the end-use application, The Power to Liquid (PtL) market encompasses diverse end-use applications, including transportation, industrial, and off-grid power generation. PtL fuels provide a sustainable alternative to traditional fossil fuels, reducing carbon emissions and promoting greener transportation. The industrial sector also benefits from PtL fuels as feedstocks or energy sources, reducing reliance on fossil fuels and enabling carbon-neutral operations. Additionally, PtL technologies offer off-grid power generation solutions for remote areas. Among these applications, transportation is estimated to lead the PtL market due to the urgent need to curb emissions, stringent regulations, and the growing demand for sustainable transportation. Regional analysis: The Power to Liquid (PtL) market exhibits regional variations driven by factors such as renewable energy potential, government initiatives, and market dynamics. Several regions across the globe are actively promoting the development and adoption of PtL technologies through supportive policies and investments. In detail analysis of the same covering all the 5 regions is given in the report. However, currently, the region with the highest market share in the PtL market is Europe. Europe has been at the forefront of renewable energy deployment and has implemented favorable policies and regulations to support the growth of PtL technologies. Government initiatives like the European Green Deal and national strategies targeting carbon reduction have created a conducive environment for PtL market growth. Looking ahead, Asia Pacific is poised to lead the PtL market in the near future. The region boasts significant renewable energy potential, rapid economic growth, and a burgeoning demand for clean energy solutions. Countries like China, India, Japan, and South Korea have announced ambitious plans to achieve carbon neutrality, driving the adoption of PtL technologies. These countries have introduced supportive policies, research funding, and pilot projects to encourage PtL development and deployment. Furthermore, Asia Pacific's large transportation and industrial sectors present significant opportunities for PtL fuels to replace conventional fossil fuels, reducing emissions and enhancing sustainability. Government initiatives play a crucial role in driving the PtL market across regions. For instance, Germany's PtL roadmap aims to establish a comprehensive Power to Liquid industry, while the Netherlands has implemented financial incentives for sustainable aviation fuels produced through PtL processes. In the United States, various states have introduced renewable fuel standards and incentives to support PtL adoption.

Power to Liquid Industry, Competitive Landscape

The Power to Liquid (PtL) market showcases a competitive landscape with a mix of established players and new entrants actively pursuing advancements in technology and strategic collaborations. Several companies have made significant contributions to the PtL market through mergers, acquisitions, and ground-breaking innovations. For example, one notable established player in the PtL market, Audi AG, a prominent automotive manufacturer has been at the forefront of PtL technology development and has successfully produced synthetic e-diesel and e-gasoline using PtL processes. In a strategic move, Audi partnered with Ineratec GmbH to build compact PtL plants, strengthening its position in the market. Another key player in the PtL market is Climeworks AG, a Swiss-based company specializing in carbon dioxide capture from the atmosphere. Climeworks has joined forces with Synhelion SA, a solar fuels technology company, to develop solar-based PtL systems. This collaboration highlights the growing interest in utilizing renewable energy sources for PtL processes. The PtL market has also witnessed new entrants and startups, driving innovation and competition. These companies bring fresh perspectives and novel technologies to the market. Examples include Electrochaea, a Swiss company that has developed a biological methanation process for PtL applications, and Sunfire GmbH, a German company specializing in high-temperature electrolysis for PtL systems.

Research Methodology:

The research conducted for the Power to liquid Market utilized both primary and secondary data sources to ensure that all possible factors affecting the market were thoroughly examined and validated. The market size for top-level markets and sub-segments is normalized and the impact of inflation, economic downturns, regulatory & policy changes, and other variables is factored into the market forecast. The bottom-up approach and multiple data triangulation methodologies are used to estimate the market size and forecasts. The percentage splits, market shares, and breakdowns of the segments are derived based on weights assigned to each of the segments on their utilization rate and average sale price. The country-wise analysis of the overall market and its sub-segments are based on the percentage adoption or utilization of the given market Size in the respective region or country. Major players in the market are identified through secondary research based on indicators that include market revenue, price, services offered, advancements, mergers and acquisitions, and joint. Extensive primary research was conducted to acquire information and verify and confirm the crucial numbers arrived at after comprehensive market engineering and calculations for market statistics, market size estimations, market forecasts, market breakdown, and data triangulation.

Power to Liquid Market Scope: Inquire before buying

Power to Liquid Market
Report Coverage Details
Base Year: 2023 Forecast Period: 2024-2030
Historical Data: 2018 to 2023 Market Size in 2023: USD 15.72 Mn.
Forecast Period 2024 to 2030 CAGR: 49.8 % Market Size in 2030: USD 266.24 Mn.
Segments Covered: by Technology • Electrolysis-based PtL • Fischer-Tropsch synthesis • Biological conversion • Methanol conversion
by Fuel type • Synthetic hydrocarbons • Hydrogen • Methanol
by Feedstock Source • Solar • Wind • Hydroelectric Power • Other
by Application • Transportation • Industrial

Power to Liquid Market, by Region

North America (United States, Canada and Mexico) Europe (UK, France, Germany, Italy, Spain, Sweden, Austria and Rest of Europe) Asia Pacific (China, South Korea, Japan, India, Australia, Indonesia, Malaysia, Vietnam, Taiwan, Bangladesh, Pakistan and Rest of APAC) Middle East and Africa (South Africa, GCC, Egypt, Nigeria and Rest of ME&A) South America (Brazil, Argentina Rest of South America)

Power to Liquid Market Key Players

1.ExxonMobil 2.Shell 3.TotalEnergies 4.BP 5.Audi 6.Siemens Energy 7.thyssenkrupp 8.Sasol 9. Neste 10.Velocys 11.INERATEC 12. Sunfire 13.LanzaTech 14. Carbon Clean Solutions 15.Climeworks 16.Ørsted 17. Eni 18.CRI Catalyst Company 19.Fraunhofer UMSICHT 20. Enerkem 21. Avantium 22.Haldor Topsoe 23. General Electric 24.Mitsubishi Heavy Industries 25.Nordic Blue Crude FAQs 1. How big is the Power to liquid Market? Ans: Power to liquid Market was valued at USD 15.72 million in 2023. 2. What is the growth rate of the Power to liquid Market? Ans: The CAGR of the Power to liquid Market is 49.8 %. 3. What are the segments of the Power to liquid Market? Ans: There are primarily 5 segments – Technology, Fuel type, Feedstock source, Geography, and Application for the Power to liquid 4. Which region will experience major growth in the Power to liquid Market sector? Ans: Asia Pacific will experience major growth in the Power to liquid Market sector. 5. Is it profitable to invest in the Power to liquid Market? Ans: There is a fair growth rate in this market and there are various factors to be analyzed like the driving forces and opportunities of the market which have been discussed extensively in Maximize’s full report. That would help in understanding the profitability of the market
1. Power To Liquid Market Introduction 1.1. Study Assumption and Market Definition 1.2. Scope of the Study 1.3. Executive Summary 2. Power To Liquid Market: Dynamics 2.1. Power To Liquid Market Trends by Region 2.1.1. North America Power To Liquid Market Trends 2.1.2. Europe Power To Liquid Market Trends 2.1.3. Asia Pacific Power To Liquid Market Trends 2.1.4. Middle East and Africa Power To Liquid Market Trends 2.1.5. South America Power To Liquid Market Trends 2.2. Power To Liquid Market Dynamics by Region 2.2.1. North America 2.2.1.1. North America Power To Liquid Market Drivers 2.2.1.2. North America Power To Liquid Market Restraints 2.2.1.3. North America Power To Liquid Market Opportunities 2.2.1.4. North America Power To Liquid Market Challenges 2.2.2. Europe 2.2.2.1. Europe Power To Liquid Market Drivers 2.2.2.2. Europe Power To Liquid Market Restraints 2.2.2.3. Europe Power To Liquid Market Opportunities 2.2.2.4. Europe Power To Liquid Market Challenges 2.2.3. Asia Pacific 2.2.3.1. Asia Pacific Power To Liquid Market Drivers 2.2.3.2. Asia Pacific Power To Liquid Market Restraints 2.2.3.3. Asia Pacific Power To Liquid Market Opportunities 2.2.3.4. Asia Pacific Power To Liquid Market Challenges 2.2.4. Middle East and Africa 2.2.4.1. Middle East and Africa Power To Liquid Market Drivers 2.2.4.2. Middle East and Africa Power To Liquid Market Restraints 2.2.4.3. Middle East and Africa Power To Liquid Market Opportunities 2.2.4.4. Middle East and Africa Power To Liquid Market Challenges 2.2.5. South America 2.2.5.1. South America Power To Liquid Market Drivers 2.2.5.2. South America Power To Liquid Market Restraints 2.2.5.3. South America Power To Liquid Market Opportunities 2.2.5.4. South America Power To Liquid Market Challenges 2.3. PORTER’s Five Forces Analysis 2.4. PESTLE Analysis 2.5. Technology Roadmap 2.6. Regulatory Landscape by Region 2.6.1. North America 2.6.2. Europe 2.6.3. Asia Pacific 2.6.4. Middle East and Africa 2.6.5. South America 2.7. Key Opinion Leader Analysis For Power To Liquid Industry 2.8. Analysis of Government Schemes and Initiatives For Power To Liquid Industry 2.9. Power To Liquid Market Trade Analysis 2.10. The Global Pandemic Impact on Power To Liquid Market 3. Power To Liquid Market: Global Market Size and Forecast by Segmentation by Demand and Supply Side (by Value in USD Million) 2023-2030 3.1. Power To Liquid Market Size and Forecast, by Technology (2023-2030) 3.1.1. Electrolysis-based PtL 3.1.2. Fischer-Tropsch synthesis 3.1.3. Biological conversion 3.1.4. Methanol conversion 3.2. Power To Liquid Market Size and Forecast, by Fuel Type (2023-2030) 3.2.1. Synthetic hydrocarbons 3.2.2. Hydrogen 3.2.3. Methanol 3.3. Power To Liquid Market Size and Forecast, by Feedstock Source (2023-2030) 3.3.1. Solar 3.3.2. Wind 3.3.3. Hydroelectric Power 3.3.4. Other 3.4. Power To Liquid Market Size and Forecast, by Application (2023-2030) 3.4.1. Transportation 3.4.2. Industrial 3.5. Power To Liquid Market Size and Forecast, by Region (2023-2030) 3.5.1. North America 3.5.2. Europe 3.5.3. Asia Pacific 3.5.4. Middle East and Africa 3.5.5. South America 4. North America Power To Liquid Market Size and Forecast by Segmentation (by Value in USD Million) 2023-2030 4.1. North America Power To Liquid Market Size and Forecast, by Technology (2023-2030) 4.1.1. Electrolysis-based PtL 4.1.2. Fischer-Tropsch synthesis 4.1.3. Biological conversion 4.1.4. Methanol conversion 4.2. North America Power To Liquid Market Size and Forecast, by Fuel Type (2023-2030) 4.2.1. Synthetic hydrocarbons 4.2.2. Hydrogen 4.2.3. Methanol 4.3. North America Power To Liquid Market Size and Forecast, by Feedstock Source (2023-2030) 4.3.1. Solar 4.3.2. Wind 4.3.3. Hydroelectric Power 4.3.4. Other 4.4. North America Power To Liquid Market Size and Forecast, by Application (2023-2030) 4.4.1. Transportation 4.4.2. Industrial 4.5. North America Power To Liquid Market Size and Forecast, by Country (2023-2030) 4.5.1. United States 4.5.1.1. United States Power To Liquid Market Size and Forecast, by Technology (2023-2030) 4.5.1.1.1. Electrolysis-based PtL 4.5.1.1.2. Fischer-Tropsch synthesis 4.5.1.1.3. Biological conversion 4.5.1.1.4. Methanol conversion 4.5.1.2. United States Power To Liquid Market Size and Forecast, by Fuel Type (2023-2030) 4.5.1.2.1. Synthetic hydrocarbons 4.5.1.2.2. Hydrogen 4.5.1.2.3. Methanol 4.5.1.3. United States Power To Liquid Market Size and Forecast, by Feedstock Source (2023-2030) 4.5.1.3.1. Solar 4.5.1.3.2. Wind 4.5.1.3.3. Hydroelectric Power 4.5.1.3.4. Other 4.5.1.4. United States Power To Liquid Market Size and Forecast, by Application (2023-2030) 4.5.1.4.1. Transportation 4.5.1.4.2. Industrial 4.5.2. Canada 4.5.2.1. Canada Power To Liquid Market Size and Forecast, by Technology (2023-2030) 4.5.2.1.1. Electrolysis-based PtL 4.5.2.1.2. Fischer-Tropsch synthesis 4.5.2.1.3. Biological conversion 4.5.2.1.4. Methanol conversion 4.5.2.2. Canada Power To Liquid Market Size and Forecast, by Fuel Type (2023-2030) 4.5.2.2.1. Synthetic hydrocarbons 4.5.2.2.2. Hydrogen 4.5.2.2.3. Methanol 4.5.2.3. Canada Power To Liquid Market Size and Forecast, by Feedstock Source (2023-2030) 4.5.2.3.1. Solar 4.5.2.3.2. Wind 4.5.2.3.3. Hydroelectric Power 4.5.2.3.4. Other 4.5.2.4. Canada Power To Liquid Market Size and Forecast, by Application (2023-2030) 4.5.2.4.1. Transportation 4.5.2.4.2. Industrial 4.5.3. Mexico 4.5.3.1. Mexico Power To Liquid Market Size and Forecast, by Technology (2023-2030) 4.5.3.1.1. Electrolysis-based PtL 4.5.3.1.2. Fischer-Tropsch synthesis 4.5.3.1.3. Biological conversion 4.5.3.1.4. Methanol conversion 4.5.3.2. Mexico Power To Liquid Market Size and Forecast, by Fuel Type (2023-2030) 4.5.3.2.1. Synthetic hydrocarbons 4.5.3.2.2. Hydrogen 4.5.3.2.3. Methanol 4.5.3.3. Mexico Power To Liquid Market Size and Forecast, by Feedstock Source (2023-2030) 4.5.3.3.1. Solar 4.5.3.3.2. Wind 4.5.3.3.3. Hydroelectric Power 4.5.3.3.4. Other 4.5.3.4. Mexico Power To Liquid Market Size and Forecast, by Application (2023-2030) 4.5.3.4.1. Transportation 4.5.3.4.2. Industrial 5. Europe Power To Liquid Market Size and Forecast by Segmentation (by Value in USD Million) 2023-2030 5.1. Europe Power To Liquid Market Size and Forecast, by Technology (2023-2030) 5.1. Europe Power To Liquid Market Size and Forecast, by Fuel Type (2023-2030) 5.1. Europe Power To Liquid Market Size and Forecast, by Feedstock Source (2023-2030) 5.1. Europe Power To Liquid Market Size and Forecast, by Application (2023-2030) 5.5. Europe Power To Liquid Market Size and Forecast, by Country (2023-2030) 5.5.1. United Kingdom 5.5.1.1. United Kingdom Power To Liquid Market Size and Forecast, by Technology (2023-2030) 5.5.1.2. United Kingdom Power To Liquid Market Size and Forecast, by Fuel Type (2023-2030) 5.5.1.3. United Kingdom Power To Liquid Market Size and Forecast, by Feedstock Source (2023-2030) 5.5.1.4. United Kingdom Power To Liquid Market Size and Forecast, by Application (2023-2030) 5.5.2. France 5.5.2.1. France Power To Liquid Market Size and Forecast, by Technology (2023-2030) 5.5.2.2. France Power To Liquid Market Size and Forecast, by Fuel Type (2023-2030) 5.5.2.3. France Power To Liquid Market Size and Forecast, by Feedstock Source (2023-2030) 5.5.2.4. France Power To Liquid Market Size and Forecast, by Application (2023-2030) 5.5.3. Germany 5.5.3.1. Germany Power To Liquid Market Size and Forecast, by Technology (2023-2030) 5.5.3.2. Germany Power To Liquid Market Size and Forecast, by Fuel Type (2023-2030) 5.5.3.3. Germany Power To Liquid Market Size and Forecast, by Feedstock Source (2023-2030) 5.5.3.4. Germany Power To Liquid Market Size and Forecast, by Application (2023-2030) 5.5.4. Italy 5.5.4.1. Italy Power To Liquid Market Size and Forecast, by Technology (2023-2030) 5.5.4.2. Italy Power To Liquid Market Size and Forecast, by Fuel Type (2023-2030) 5.5.4.3. Italy Power To Liquid Market Size and Forecast, by Feedstock Source (2023-2030) 5.5.4.4. Italy Power To Liquid Market Size and Forecast, by Application (2023-2030) 5.5.5. Spain 5.5.5.1. Spain Power To Liquid Market Size and Forecast, by Technology (2023-2030) 5.5.5.2. Spain Power To Liquid Market Size and Forecast, by Fuel Type (2023-2030) 5.5.5.3. Spain Power To Liquid Market Size and Forecast, by Feedstock Source (2023-2030) 5.5.5.4. Spain Power To Liquid Market Size and Forecast, by Application (2023-2030) 5.5.6. Sweden 5.5.6.1. Sweden Power To Liquid Market Size and Forecast, by Technology (2023-2030) 5.5.6.2. Sweden Power To Liquid Market Size and Forecast, by Fuel Type (2023-2030) 5.5.6.3. Sweden Power To Liquid Market Size and Forecast, by Feedstock Source (2023-2030) 5.5.6.4. Sweden Power To Liquid Market Size and Forecast, by Application (2023-2030) 5.5.7. Austria 5.5.7.1. Austria Power To Liquid Market Size and Forecast, by Technology (2023-2030) 5.5.7.2. Austria Power To Liquid Market Size and Forecast, by Fuel Type (2023-2030) 5.5.7.3. Austria Power To Liquid Market Size and Forecast, by Feedstock Source (2023-2030) 5.5.7.4. Austria Power To Liquid Market Size and Forecast, by Application (2023-2030) 5.5.8. Rest of Europe 5.5.8.1. Rest of Europe Power To Liquid Market Size and Forecast, by Technology (2023-2030) 5.5.8.2. Rest of Europe Power To Liquid Market Size and Forecast, by Fuel Type (2023-2030) 5.5.8.3. Rest of Europe Power To Liquid Market Size and Forecast, by Feedstock Source (2023-2030) 5.5.8.4. Rest of Europe Power To Liquid Market Size and Forecast, by Application (2023-2030) 6. Asia Pacific Power To Liquid Market Size and Forecast by Segmentation (by Value in USD Million) 2023-2030 6.1. Asia Pacific Power To Liquid Market Size and Forecast, by Technology (2023-2030) 6.2. Asia Pacific Power To Liquid Market Size and Forecast, by Fuel Type (2023-2030) 6.3. Asia Pacific Power To Liquid Market Size and Forecast, by Feedstock Source (2023-2030) 6.4. Asia Pacific Power To Liquid Market Size and Forecast, by Application (2023-2030) 6.5. Asia Pacific Power To Liquid Market Size and Forecast, by Country (2023-2030) 6.5.1. China 6.5.1.1. China Power To Liquid Market Size and Forecast, by Technology (2023-2030) 6.5.1.2. China Power To Liquid Market Size and Forecast, by Fuel Type (2023-2030) 6.5.1.3. China Power To Liquid Market Size and Forecast, by Feedstock Source (2023-2030) 6.5.1.4. China Power To Liquid Market Size and Forecast, by Application (2023-2030) 6.5.2. S Korea 6.5.2.1. S Korea Power To Liquid Market Size and Forecast, by Technology (2023-2030) 6.5.2.2. S Korea Power To Liquid Market Size and Forecast, by Fuel Type (2023-2030) 6.5.2.3. S Korea Power To Liquid Market Size and Forecast, by Feedstock Source (2023-2030) 6.5.2.4. S Korea Power To Liquid Market Size and Forecast, by Application (2023-2030) 6.5.3. Japan 6.5.3.1. Japan Power To Liquid Market Size and Forecast, by Technology (2023-2030) 6.5.3.2. Japan Power To Liquid Market Size and Forecast, by Fuel Type (2023-2030) 6.5.3.3. Japan Power To Liquid Market Size and Forecast, by Feedstock Source (2023-2030) 6.5.3.4. Japan Power To Liquid Market Size and Forecast, by Application (2023-2030) 6.5.4. India 6.5.4.1. India Power To Liquid Market Size and Forecast, by Technology (2023-2030) 6.5.4.2. India Power To Liquid Market Size and Forecast, by Fuel Type (2023-2030) 6.5.4.3. India Power To Liquid Market Size and Forecast, by Feedstock Source (2023-2030) 6.5.4.4. India Power To Liquid Market Size and Forecast, by Application (2023-2030) 6.5.5. Australia 6.5.5.1. Australia Power To Liquid Market Size and Forecast, by Technology (2023-2030) 6.5.5.2. Australia Power To Liquid Market Size and Forecast, by Fuel Type (2023-2030) 6.5.5.3. Australia Power To Liquid Market Size and Forecast, by Feedstock Source (2023-2030) 6.5.5.4. Australia Power To Liquid Market Size and Forecast, by Application (2023-2030) 6.5.6. Indonesia 6.5.6.1. Indonesia Power To Liquid Market Size and Forecast, by Technology (2023-2030) 6.5.6.2. Indonesia Power To Liquid Market Size and Forecast, by Fuel Type (2023-2030) 6.5.6.3. Indonesia Power To Liquid Market Size and Forecast, by Feedstock Source (2023-2030) 6.5.6.4. Indonesia Power To Liquid Market Size and Forecast, by Application (2023-2030) 6.5.7. Malaysia 6.5.7.1. Malaysia Power To Liquid Market Size and Forecast, by Technology (2023-2030) 6.5.7.2. Malaysia Power To Liquid Market Size and Forecast, by Fuel Type (2023-2030) 6.5.7.3. Malaysia Power To Liquid Market Size and Forecast, by Feedstock Source (2023-2030) 6.5.7.4. Malaysia Power To Liquid Market Size and Forecast, by Application (2023-2030) 6.5.8. Vietnam 6.5.8.1. Vietnam Power To Liquid Market Size and Forecast, by Technology (2023-2030) 6.5.8.2. Vietnam Power To Liquid Market Size and Forecast, by Fuel Type (2023-2030) 6.5.8.3. Vietnam Power To Liquid Market Size and Forecast, by Feedstock Source (2023-2030) 6.5.8.4. Vietnam Power To Liquid Market Size and Forecast, by Application (2023-2030) 6.5.9. Taiwan 6.5.9.1. Taiwan Power To Liquid Market Size and Forecast, by Technology (2023-2030) 6.5.9.2. Taiwan Power To Liquid Market Size and Forecast, by Fuel Type (2023-2030) 6.5.9.3. Taiwan Power To Liquid Market Size and Forecast, by Feedstock Source (2023-2030) 6.5.9.4. Taiwan Power To Liquid Market Size and Forecast, by Application (2023-2030) 6.5.10. Rest of Asia Pacific 6.5.10.1. Rest of Asia Pacific Power To Liquid Market Size and Forecast, by Technology (2023-2030) 6.5.10.2. Rest of Asia Pacific Power To Liquid Market Size and Forecast, by Fuel Type (2023-2030) 6.5.10.3. Rest of Asia Pacific Power To Liquid Market Size and Forecast, by Feedstock Source (2023-2030) 6.5.10.4. Rest of Asia Pacific Power To Liquid Market Size and Forecast, by Application (2023-2030) 7. Middle East and Africa Power To Liquid Market Size and Forecast by Segmentation (by Value in USD Million) 2023-2030 7.1. Middle East and Africa Power To Liquid Market Size and Forecast, by Technology (2023-2030) 7.2. Middle East and Africa Power To Liquid Market Size and Forecast, by Fuel Type (2023-2030) 7.3. Middle East and Africa Power To Liquid Market Size and Forecast, by Feedstock Source (2023-2030) 7.4. Middle East and Africa Power To Liquid Market Size and Forecast, by Application (2023-2030) 7.5. Middle East and Africa Power To Liquid Market Size and Forecast, by Country (2023-2030) 7.5.1. South Africa 7.5.1.1. South Africa Power To Liquid Market Size and Forecast, by Technology (2023-2030) 7.5.1.2. South Africa Power To Liquid Market Size and Forecast, by Fuel Type (2023-2030) 7.5.1.3. South Africa Power To Liquid Market Size and Forecast, by Feedstock Source (2023-2030) 7.5.1.4. South Africa Power To Liquid Market Size and Forecast, by Application (2023-2030) 7.5.2. GCC 7.5.2.1. GCC Power To Liquid Market Size and Forecast, by Technology (2023-2030) 7.5.2.2. GCC Power To Liquid Market Size and Forecast, by Fuel Type (2023-2030) 7.5.2.3. GCC Power To Liquid Market Size and Forecast, by Feedstock Source (2023-2030) 7.5.2.4. GCC Power To Liquid Market Size and Forecast, by Application (2023-2030) 7.5.3. Nigeria 7.5.3.1. Nigeria Power To Liquid Market Size and Forecast, by Technology (2023-2030) 7.5.3.2. Nigeria Power To Liquid Market Size and Forecast, by Fuel Type (2023-2030) 7.5.3.3. Nigeria Power To Liquid Market Size and Forecast, by Feedstock Source (2023-2030) 7.5.3.4. Nigeria Power To Liquid Market Size and Forecast, by Application (2023-2030) 7.5.4. Rest of ME&A 7.5.4.1. Rest of ME&A Power To Liquid Market Size and Forecast, by Technology (2023-2030) 7.5.4.2. Rest of ME&A Power To Liquid Market Size and Forecast, by Fuel Type (2023-2030) 7.5.4.3. Rest of ME&A Power To Liquid Market Size and Forecast, by Feedstock Source (2023-2030) 7.5.4.4. Rest of ME&A Power To Liquid Market Size and Forecast, by Application (2023-2030) 8. South America Power To Liquid Market Size and Forecast by Segmentation (by Value in USD Million) 2023-2030 8.1. South America Power To Liquid Market Size and Forecast, by Technology (2023-2030) 8.2. South America Power To Liquid Market Size and Forecast, by Fuel Type (2023-2030) 8.3. South America Power To Liquid Market Size and Forecast, by Feedstock Source(2023-2030) 8.4. South America Power To Liquid Market Size and Forecast, by Application (2023-2030) 8.5. South America Power To Liquid Market Size and Forecast, by Country (2023-2030) 8.5.1. Brazil 8.5.1.1. Brazil Power To Liquid Market Size and Forecast, by Technology (2023-2030) 8.5.1.2. Brazil Power To Liquid Market Size and Forecast, by Fuel Type (2023-2030) 8.5.1.3. Brazil Power To Liquid Market Size and Forecast, by Feedstock Source (2023-2030) 8.5.1.4. Brazil Power To Liquid Market Size and Forecast, by Application (2023-2030) 8.5.2. Argentina 8.5.2.1. Argentina Power To Liquid Market Size and Forecast, by Technology (2023-2030) 8.5.2.2. Argentina Power To Liquid Market Size and Forecast, by Fuel Type (2023-2030) 8.5.2.3. Argentina Power To Liquid Market Size and Forecast, by Feedstock Source (2023-2030) 8.5.2.4. Argentina Power To Liquid Market Size and Forecast, by Application (2023-2030) 8.5.3. Rest Of South America 8.5.3.1. Rest Of South America Power To Liquid Market Size and Forecast, by Technology (2023-2030) 8.5.3.2. Rest Of South America Power To Liquid Market Size and Forecast, by Fuel Type (2023-2030) 8.5.3.3. Rest Of South America Power To Liquid Market Size and Forecast, by Feedstock Source (2023-2030) 8.5.3.4. Rest Of South America Power To Liquid Market Size and Forecast, by Application (2023-2030) 9. Global Power To Liquid Market: Competitive Landscape 9.1. MMR Competition Matrix 9.2. Competitive Landscape 9.3. Key Players Benchmarking 9.3.1. Company Name 9.3.2. Business Segment 9.3.3. End-user Segment 9.3.4. Revenue (2022) 9.3.5. Company Locations 9.4. Leading Power To Liquid Market Companies, by market capitalization 9.5. Market Structure 9.5.1. Market Leaders 9.5.2. Market Followers 9.5.3. Emerging Players 9.6. Mergers and Acquisitions Details 10. Company Profile: Key Players 10.1. ExxonMobil 10.1.1. Company Overview 10.1.2. Business Portfolio 10.1.3. Financial Overview 10.1.4. SWOT Analysis 10.1.5. Strategic Analysis 10.1.6. Scale of Operation (small, medium, and large) 10.1.7. Details on Partnership 10.1.8. Regulatory Accreditations and Certifications Received by Them 10.1.9. Awards Received by the Firm 10.1.10. Recent Developments 10.2. Shell 10.3. TotalEnergies 10.4. BP 10.5. Audi 10.6. Siemens Energy 10.7. thyssenkrupp 10.8. Sasol 10.9. Neste 10.10. Velocys 10.11. INERATEC 10.12. Sunfire 10.13. LanzaTech 10.14. Carbon Clean Solutions 10.15. Climeworks 10.16. Ørsted 10.17. Eni 10.18. CRI Catalyst Company 10.19. Fraunhofer UMSICHT 10.20. Enerkem 10.21. Avantium 10.22. Haldor Topsoe 10.23. General Electric 10.24. Mitsubishi Heavy Industries 10.25. Nordic Blue Crude 11. Key Findings 12. Industry Recommendations 13. Power To Liquid Market: Research Methodology 14. Terms and Glossary
  • INQUIRE BEFORE BUYING