
Nonprofit Organizations Market - Industry Structure Evaluation, Demand Drivers Analysis, Regional Growth Analysis and Identification, Competitive Positioning Review & Global Market Size Forecast to 2032
Overview
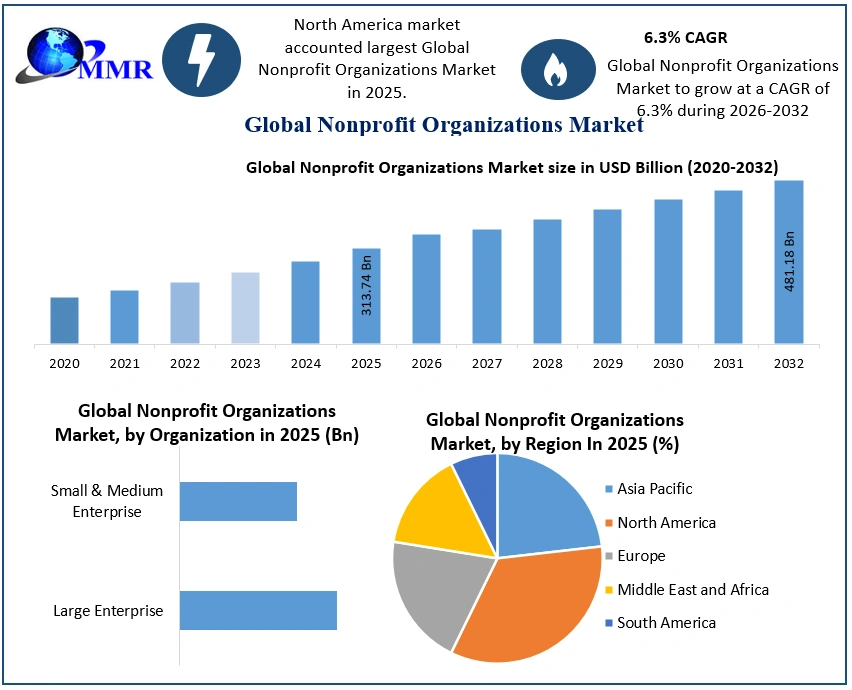
The Nonprofit Organizations Market size was valued at USD 313.74 Billion in 2025 and the total Nonprofit Organizations revenue is expected to grow at a CAGR of 6.3% from 2025 to 2032, reaching nearly USD 481.18 Billion by 2032.
Nonprofit Organizations Market Overview:
Since 2015, the global market for Nonprofits Organizations has grown at a CAGR of 3.6 % to over USD 289.25 Billion in 2023. The market was dropped by -0.9 % in 2022, from $ 250.96 Billion in 2022. The reduction is mainly due to many countries' enacting lockdown & social distance norms, as well as a global economic slowdown caused by the COVID-19 outburst & the actions taken to combat it. After that, from 2021 to 2023, the market is expected to recover & increase at a CAGR of 5.3 %. The market is expected to reach $345.32 Billion by the end of 2029 at a CAGR of 4.53 %. Due to their unique conditions, nonprofit organizations often have a more tough time developing & implementing efficient marketing strategies. This, combined with an overabundance of social agencies, might make it tough to stand out and develop a successful strategy.
Strong economic expansion in developing countries & an increase in customer disposable income drove growth during the historic period. Government limitations on some sorts of financing sources, as well as money misuse, had a negative impact on growth during the historic period. Increased corporate social responsibility, more environmentally friendly awareness, & increased internet usage will all contribute to future growth. Geopolitical tensions, tight regulations, & COVID-19 are all factors that could slow the growth of the Nonprofit Organizations Market in the future.
 To know about the Research Methodology :- Request Free Sample Report
Nonprofit Organizations Market Dynamics:
The market for nonprofit organizations will rise as corporate social responsibility improves. Corporate Social Responsibility is a concept in which businesses incorporate social & environmental issues into their operations & interactions with stakeholders. Companies are increasingly emphasizing corporate social responsibility as an important component of their overall strategy to promote social concerns. Furthermore, millennials like to associate with firms which support social concerns. Companies' CSR spending is growing as a result of this. For instance, as part of its 2025 responsibility targets, Sysco, an American multinational food products firm, will distribute 200 Mn meals & contribute $50 Mn to local communities. Growing CSR will positively impact the market for nonprofit organizations going forward.
Some kind of funding sources are banned by the government:
During the historic period, government restrictions on nonprofit organizations hampered the market's growth. During 2015-21, governments of some countries-imposed bans on charitable organizations and nonprofit organizations which worked against the government interests. For example, in the year 2015, the government of India canceled a license allowing Greenpeace’s Indian arm to receive overseas grants & donations.
The Indian government declared that the license had been revoked as the nonprofit organization had harmed the nation's economic interests by fighting against mining & nuclear projects. During the historic time, government bans restricted the source of funds, limiting the market for nonprofit organizations & charity groups.
Nonprofit Organizations Market Segment Analysis
Based On Application, the Human Services segment dominated the Nonprofit Organizations Market in 2025 and is expected to maintain its lead during the forecast period. This dominance is driven by the rising demand for essential community support services, increasing global focus on poverty alleviation, disaster relief, and social welfare, along with growing public and private funding toward humanitarian causes. Human Services nonprofits provide immediate solutions to critical issues such as food security, shelter, healthcare access, youth development, and elderly care, making them the most impactful and widely supported category.
Based on Organization Size, the Large Enterprise segment dominated the Nonprofit Organizations Market in 2025 and is expected to maintain its lead during the forecast period. This dominance is driven by their extensive operational capacity, wider global presence, and stronger funding capabilities compared to small and medium organizations. Large nonprofit enterprises typically manage multiple programs across regions, have established governance structures, and attract substantial financial support from governments, international agencies, and corporate donors.
Nonprofit Organizations Market Trends:
Increasing mobile usage:
Donors are increasingly using mobile technologies to donate to charities as it is convenient. Nonprofit organizations can use mobile technology to better communicate with their supporters & generate money more swiftly & conveniently. Donations via mobile applications are frequently encouraged by nonprofit organizations. For example, Micro-donation apps such as Instead & One Today, allow users to make daily donations of up to USD 1 to charity organizations of their choice. According to the MMR report study, internet donations accounted for 7.6 percent of total fundraising revenue in the year 2017, & 21 percent of these online gifts were made using a mobile device.
Descriptive & Predictive Analytics:
Predictive & descriptive analytics are increasingly used by nonprofit organizations to generate relevant data insights. These businesses use descriptive analytics to make simple reports or detect non-compliance after transactions have been completed. Predictive analytics can help organizations gain a better knowledge of the relative effectiveness of numerous programmes, allowing resources to be better targeted for better results.
2023 Nonprofit organizations: Main Facts & Figures:
Worldwide, there are about ten million nonprofit organizations.
In the U.S, there are over 1.3 Mn 501(c) organizations.
Nonprofit organizations make about 5-10% of the United States economy & employ around 10% of the country's workforce.
The nonprofit sector in the U.S employs about 11.9 Mn people, making it the country's 3rd largest employer after retail & manufacturing.
Most nonprofit organizations do not rely solely on donations, contrary to popular opinion.
Fees for programmes, commodities, & services account for 48% of revenue for public charities.
The government contributes 33%.
Charitable donations account for 13% of the total.
Investments & other sources account for 6% of the total.
Recommendations:
To take advantage of the opportunities, the MMR report study suggests that non-profits organizations market companies to include mobile technologies for donations, spend in CRM software to track donations, focus on NGO-corporate companies, leverage predictive & descriptive analytics, create operations in emerging markets, organize events & campaigns, rise visibility through a high-performance website, increase adoption of the internet & social media & focus on partnership with corporates.
The objective of the report is to present a comprehensive analysis of the Global Non-profit Organizations Market to the stakeholders in the industry. The past and current status of the industry with the forecasted Market size and trends are presented in the report with the analysis of complicated data in simple language. The report covers all the aspects of the industry with a dedicated study of key players that include Market leaders, followers, and new entrants.
PORTER, PESTEL analysis with the potential impact of micro-economic factors of the Market have been presented in the report. External as well as internal factors that are supposed to affect the business positively or negatively have been analyzed, which will give a clear futuristic view of the industry to the decision-makers.
The report also helps in understanding the Global Market dynamics, structure by analyzing the Market segments and project the Global Nonprofit organizations Market size. Clear representation of competitive analysis of key players by Product, price, financial position, Product portfolio, growth strategies, and regional presence in the Global Nonprofit organizations Market make the report investor’s guide.
Nonprofit organizations Market Scope: Inquiry Before Buying
| Global Nonprofit organizations Market | |||
|---|---|---|---|
| Report Coverage | Details | ||
| Base Year: | 2025 | Forecast Period: | 2026-2032 |
| Historical Data: | 2020 to 2025 | Market Size in 2025: | USD 313.74 Bn. |
| Forecast Period 2026 to 2032 CAGR: | 6.3% | Market Size in 2032: | USD 481.18 Bn. |
| Segments Covered: | by Type | Human Services Groups Education Organizations Health Care Organizations Environment and animals Religion related Others |
|
| by Organization | Large Enterprise Small & Medium Enterprise |
||
| by Mode of Operation | International NGOs (INGOs) National Organizations Local/Community-Based Organizations (CBOs) |
||
| by Revenue Source | Donations & Philanthropy (individuals, foundations, corporate) Government Grants & Funding Membership Fees & Subscriptions Others |
||
| by Installation Method | Dry Adhesive Films Pressure-Sensitive Adhesive Films Self-Adhesive / Peel-and-Stick Professional Installation vs. DIY Kits |
||
Nonprofit Organizations Market, by Region
North America (United States, Canada and Mexico)
Europe (UK, France, Germany, Italy, Spain, Sweden, Austria and Rest of Europe)
Asia Pacific (China, South Korea, Japan, India, Australia, Indonesia, Malaysia, Vietnam, Taiwan, Bangladesh, Pakistan and Rest of APAC)
Middle East and Africa (South Africa, GCC, Egypt, Nigeria and Rest of ME&A)
South America (Brazil, Argentina Rest of South America)
Nonprofit Organizations Market, Key Players are:
1. Bill & Melinda Gates Foundation
2. Direct Relief
3. Médecins sans Frontières
4. AmeriCares
5. The American Red Cross
6. The Nature Conservancy
7. UNICEF USA
12. The Rotary Foundation
13. Feed the Children
14. Natural Resources Defense Council
11. Smile Foundation
12. Nanhi Kali
13. GiveIndia Foundation
14. Goonj
15. HelpAge India
16. Sightsavers
17. Child Rights and You (CRY)
112. Pratham Education Foundation
113. Sammaans Foundation
20. Care India
21. Amity Foundation.
FAQ’S:
1) What is the Global Nonprofit organizations Market size in 2025?
Answer: The Global Nonprofit Organizations Market size was USD 313.74 Billion in 2025.
2) Which Type of segment is dominating the Global Nonprofit organizations Market?
Answer: Health Care Organizations sector is the dominating segment in the market.
3) What are the key players in the Global Nonprofit organizations Market?
Answer: Bill & Melinda Gates Foundation,Direct Relief, Médecins Sans Frontières, AmeriCares, The American Red Cross, The Nature Conservancy, UNICEF USA, The Rotary Foundation, Feed the Children, Natural Resources Defense Council, Smile Foundation, Nanhi Kali.
4) Which factor acts as the driving factor for the growth of the Nonprofit organizations Market?
Answer: The major factors for the growth of the Global Nonprofit organizations market includes Increasing Corporate Social Responsibility.