
Global Mobility as a Service Market by Service Type, Solution Type, Transportation Type, Business Model, Operating System, Region – Global Market Size Estimation, Industry-Wide Analysis, Competitive Landscape Assessment & Long-Term Forecast to 2030
Overview
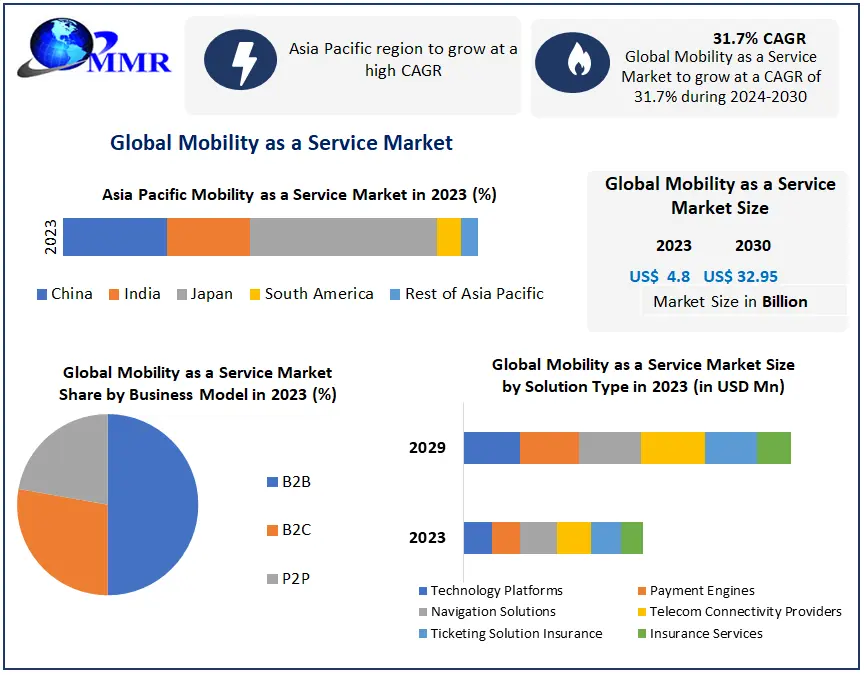
Global Mobility as a Service Market size was valued at USD 4.8 Bn in 2023 and is expected to reach USD 32.95 Bn by 2030, at a CAGR of 31.7 %
Mobility as a Service Market Overview
Mobility as a Service refers to a comprehensive approach that integrates various transportation services into a single, user-friendly platform. It allows users to plan, book, and pay for multi-modal journeys seamlessly, promoting efficient and sustainable urban mobility. The Mobility as a Service (MaaS) market is witnessing rapid growth as cities embrace smart and sustainable transportation solutions. MaaS platforms consolidate diverse transportation modes like ride-sharing, public transit, and micro-mobility, providing users with streamlined access. Factors such as urbanization, environmental concerns, and the desire for convenient, cost-effective commuting are driving the market. Key players in this evolving landscape include tech firms, traditional transport providers, and startups. As MaaS gains momentum, collaborations and advancements in digital technologies are shaping the future of urban mobility, offering a flexible and interconnected transport ecosystem that enhances accessibility and reduces reliance on private car ownership, thereby contributing to a more sustainable and interconnected urban transportation network.
 To know about the Research Methodology :- Request Free Sample Report
There are several advantages to adopting the MaaS model. It promotes higher vehicle utilization, meaning fewer cars are needed overall, saving valuable parking space. People rent out their vehicles when they're not using them, recovering some costs. With fewer cars on the road, the government focuses on investing in better public transport infrastructure, leading to more frequent and reliable services. Organizations also gain from MaaS, especially those with vehicle fleets. Shifting to a MaaS transport model reduces fleet maintenance risks and costs and Mobility as a Service Market Growth. Fleet assets are better utilized by offering them for public use on weekends and holidays. Organizations provide alternative transportation options for their staff, potentially saving on overall transport costs per individual. Mobility as a Service is a game-changing approach to urban transportation. By providing a comprehensive range of transport choices through a single platform. MaaS benefits individuals by reducing car ownership and cities by easing congestion and promoting efficient public transport infrastructure. Organizations with fleets also use MaaS to optimize asset utilization and offer alternative transportation solutions to their staff.
Mobility as a Service Market Dynamics: Drivers, Restraints, Opportunities and Trends
Advancements in Technology Propelled the Rise of Mobility as a Service Platforms
Urban population growth leads to higher demand for efficient transportation solutions in cities. MaaS offers a convenient and integrated platform that addresses urban dwellers' mobility needs, making it an attractive option for both residents and visitors. A rapidly expanding metropolis experiences a surge in commuter traffic. This prompts city authorities to collaborate with MaaS providers to offer a comprehensive range of transportation options. This reduces reliance on private cars and promotes sustainable travel choices. Advancements in mobile technology, GPS, and data analytics have paved the way for MaaS platforms. These technological innovations enable real-time trip planning, seamless booking, and integration of various transportation modes within a single app. A tech-savvy MaaS startup harnesses advanced mapping and routing algorithms to optimize multi-modal transportation routes, providing users with efficient and time-saving travel options. A city with ambitious sustainability goals partners with MaaS operators to incentivize eco-friendly transportation options by offering discounts or subsidies to users who choose public transit or bike-sharing. Consumer preferences are evolving, with rising interest in on-demand and personalized services. As a result, such factors are expected to drive the Mobility as a Service Market growth.
Mobility as a Service Market trend by providing convenient, user-friendly, and tailored transportation choices. A generation of tech-savvy millennials embraces MaaS platforms as their go-to solution for daily commuting, citing ease of use, cost-effectiveness, and environmental benefits as key factors influencing their choice. Collaboration between public transit agencies, private companies, and MaaS providers creates opportunities for creating comprehensive and integrated transportation networks. A city's public transit authority partners with ride-hailing and bike-sharing companies to integrate their services into the MaaS platform, providing commuters with a seamless and interconnected travel experience. Governments around the world encourage MaaS adoption to address transportation challenges and reduce congestion. Incentives, policy support, and funding initiatives further drive MaaS market growth. The national government introduces tax incentives for MaaS companies. It allocates funding for smart infrastructure development to support transportation mode integration.
Investing in Infrastructure Enhancing MaaS Efficiency and Accessibility and Boost the Market
MaaS presents an opportunity to leverage vast amounts of data to gain valuable insights into transportation patterns and user preferences. This data-driven approach leads to better service optimization and personalized travel recommendations for users. Regulatory challenges require collaboration between governments, transportation providers, and MaaS operators. By working together, stakeholders create a conducive environment for MaaS growth and ensure fair competition in different transportation modes. As MaaS gains traction, there is an opportunity for increased investment in infrastructure development. This includes expanding public transit networks, creating dedicated bike lanes, and implementing charging stations for electric vehicles. Improved infrastructure will enhance the overall MaaS experience.
Consumer behavior challenges addressed through targeted education and awareness campaigns. By highlighting the benefits of MaaS, such as convenience, affordability, and sustainability, more individuals are encouraged to adopt these innovative transportation options. Although integrating diverse transportation modes is complex, successful integration presents an opportunity for a more seamless and efficient travel experience. Collaborative efforts lead to smoother interchanges between different modes, making MaaS an attractive choice for users.
Changing Consumer Behavior to Restrain the Adoption of Mobility as a Service and Hinder the Market Growth
Mobility as a Service (MaaS) faces significant challenges that hinder its widespread adoption and implementation. One of the primary challenges lies in data management. These systems rely heavily on collecting and processing vast amounts of data from various sources, including transportation providers, users, and third-party platforms. Effectively managing and protecting this data is crucial for user privacy and maintaining system integrity. Regulation poses another complex challenge for Mobility as a Service Market. The transportation industry operates under a myriad of laws and standards, varying across different regions and modes of transport. Navigating this complex regulatory environment is demanding. Ensuring a level playing field for all participants is essential for fair competition and sustainable MaaS growth. MaaS's success depends on physical and digital infrastructure availability and adequacy. This includes reliable public transit networks, well-maintained bike lanes, charging stations for electric vehicles, and robust mobile networks to support seamless connectivity.
The absence or inadequacy of such infrastructure in certain areas hinders MaaS systems' efficiency. Changing consumer behavior poses a significant challenge to MaaS adoption. Many users are accustomed to traditional transportation modes and resist shifting to more innovative and unfamiliar services. Consumer preferences and behaviors change over time, making it challenging for MaaS providers to anticipate and cater to evolving needs effectively achieving seamless integration of diverse transportation modes is vital to MaaS's success. Coordinating and collaborating with different transportation providers and stakeholders is complex, given their competing interests and priorities. Effective integration is necessary to create a cohesive and interconnected transportation network. Affordability remains a barrier to MaaS adoption for certain demographics, those with lower incomes or residing in rural areas with limited transportation options. Mobility as a Service must be accessible and cost-effective for all users is essential for equitable and inclusive mobility solutions.
Mobility as a Service Market Segmental Analysis
By Service Type:
Based on the Service Type, the Ride-hailing services held the largest Mobility as a Service Market share in 2023. Ride-hailing platforms, such as Uber, Rapido, Ola, and Lyft, have gained widespread popularity in urban areas, offering users the convenience of booking a ride with just a tap on their smartphones. These services provide on-demand transportation options, eliminating private car ownership and promoting more efficient vehicle use. Ride-hailing has been preferred by many commuters due to its ease of use, real-time tracking, and often competitive pricing compared to traditional taxis. Car-sharing is another significant segment of the MaaS market, contributing to improved resource efficiency and reduced congestion. Car-sharing platforms allow users to access shared vehicles for short-term use, promoting a shift from private car ownership to shared mobility. It is possible to book a car when needed, and the vehicle is returned to a designated parking spot once used.

Car-sharing services have seen steady growth, especially in urban areas, where individuals find it more economical to use rented cars occasionally rather than owning a private vehicle. Micromobility, including services like bike-sharing and electric scooter-sharing, has seen a surge in popularity and has become an integral part of the MaaS ecosystem. Such factors are influencing the Mobility as a Service market growth. These services provide convenient options for short-distance travel, complementing other modes of transportation. Micromobility solutions are particularly attractive for last-mile connectivity, allowing users to cover the distance between public transit stations and their final destinations. The segment's growth is supported by the increasing availability of electric bikes and scooters, making them more accessible and eco-friendly.
Mobility as a Service Market Regional Analysis
In 2023, Asia Pacific dominated the largest Mobility as a Service Market share in 2023. There is significant traffic congestion and air pollution in the region due to densely populated urban centers. These issues have spurred governments and private entities to explore innovative mobility solutions like MaaS to address the growing demand for efficient transportation. Smartphone adoption and increasing internet penetration in the Asia Pacific have facilitated the rapid uptake of MaaS platforms. The Asia Pacific region has witnessed significant investments in micro-mobility services, particularly bike-sharing and electric scooter-sharing. Companies such as Ola and Mobike in China and Bounce in India have played a pivotal role in popularizing shared micro-mobility options. Asia Pacific has become a hub for multimodal transportation integration through MaaS platforms.
North America is also a leading player in the Mobility as a Service Market market, with the United States and Canada driving growth. In North America, Uber and Lyft dominate the ride-hailing segment. These platforms have reshaped urban transportation by providing convenient on-demand ride services to millions of users. North America has seen significant advancements in the car-sharing industry. Car-sharing services like Zipcar and Turo have gained popularity in urban areas where individuals seek alternatives to car ownership. These services contribute to reducing privately-owned vehicles on the road, aligning with MaaS sustainability goals.
The diverse and well-connected transportation systems in Europe have embraced MaaS concepts to address urban mobility challenges effectively. Europe's ride-hailing segment is growing steadily, with Uber and Bolt expanding to multiple cities. Car-sharing has gained traction in Europe, with companies like Share Now (formerly Car2Go and DriveNow) and Getaround offering flexible car-sharing options to users in various European cities. These services align with the region's emphasis on sustainable urban mobility solutions. The success of bike-sharing in Europe has inspired the integration of these services into MaaS platforms, enabling users to access shared bicycles boost the Mobility as a Service industry growth in Europe.
Mobility as a Service (SaaS) Industry Ecosystem
Mobility as a Service Market Scope: Inquire Before Buying
| Global Mobility as a Service Market | |||
|---|---|---|---|
| Report Coverage | Details | ||
| Base Year: | 2023 | Forecast Period: | 2024-2030 |
| Historical Data: | 2018 to 2023 | Market Size in 2023: | US $ 4.8 Bn. |
| Forecast Period 2024 to 2030 CAGR: | 31.7% | Market Size in 2030: | US $ 32.95 Bn. |
| Segments Covered: | by Service Type | Ride Hailing Car Sharing Micro mobility Bus Sharing Train Services |
|
| by Solution Type | Technology Platforms Payment Engines Navigation Solutions Telecom Connectivity Providers Ticketing Solution Insurance Insurance Services |
||
| by Transportation Type | Public Private |
||
| by Business Model | B2B B2C P2P |
||
| by Operating System | Android iOS Others |
||
Mobility as a Service Market, by Region
North America (United States, Canada, and Mexico)
Europe (UK, France, Germany, Italy, Spain, Sweden, Austria, and the Rest of Europe)
Asia Pacific (China, South Korea, Japan, India, Australia, Indonesia, Malaysia, Vietnam, Taiwan, Bangladesh, Pakistan, and the Rest of APAC)
Middle East and Africa (South Africa, GCC, Egypt, Nigeria, and the Rest of ME&A)
South America (Brazil, Argentina, and the Rest of South America)
Mobility as a Service Key Players
North America
1. Addison Lee
2. Lyft Inc.
3. Uber Technologies Inc.
Europe:
1. BlaBla Car
2. Cabify
3. Careem
4. Citymapper, Ltd.
5. Communauto Inc.,
6. Daimler AG.
7. Easy Taxi
8. Gett
9. Ingogo
10. Meituan (Mobike)
11. Meru Cabs
12. Mobilleo
13. Moovit Inc.
14. Ola Cabs
15. SkedGo Pty Ltd
Mobility as a Service Companies in Asia Pacific:
1. ANI Technologies Pvt. Ltd. (Ola Cabs)
2. Beijing Xiaoju Technology Co., Ltd (Didi Chuxing)
3. Gocatch
4. Grab Taxi
5. HINOMARU KOTSU
6. Tranzer
7. Wiwigo
Frequently Asked Questions:
1] What is the growth rate of the Global Mobility as a Service Market?
Ans. The Global Mobility as a Service Market is growing at a significant rate of 31.7 % during the forecast period.
2] Which region is expected to dominate the Global Mobility as a Service Market?
Ans. Asia Pacific region is expected to dominate the Mobility as a Service Market growth potential during the forecast period.
3] What is the expected Global Mobility as a Service Market size by 2030?
Ans. The Mobility as a Service Market size is expected to reach USD 32.95 Bn by 2030.
4] Which are the top players in the Global Mobility as a Service Market?
Ans. The top players in the market include Addison Lee, Lyft Inc., Uber Technologies Inc. and others.
5] What are the factors driving the Global Mobility as a Service Market growth?
Ans. Advancements in technology propelled the rise of mobility as a service platform and are expected to drive market growth.
6] Which country held largest the Mobility as a Service market share in 2023?
Ans. China dominated the largest Mobility as a Service market share in 2023 and India, Japan and South Korea are expected to drive the market growth.