
Immersive Analytics Market Size by Offering, Application, End User, Region – Segment-Level Market Assessment, Growth Opportunity Analysis, Competitive Mapping & Forecast to 2030
Overview
The Immersive Analytics Market size was valued at USD 1199.22 Million in 2023 and the total Immersive Analytics revenue is expected to grow at a CAGR of 51.8% from 2024 to 2030, reaching nearly USD 22274.16 Million.
Immersive Analytics Market Overview
Immersive Analytics, a revolutionary fusion of immersive experiences and data exploration, reshapes decision-making and data comprehension paradigms. This cutting-edge domain surpasses traditional data analysis, injecting a tangible sense of presence into virtual spaces. Its evolution is a testament to the Immersive Analytics Market's unique position in revolutionizing how individuals interact with and extract insights from data. Initially overshadowed by the magnetism of Virtual Reality (VR), Immersive Analytics stands apart by bridging experiential gaps between individuals and their data. This innovative realm redefines the immersive analytics landscape by transcending the mere visualization of data, fostering an immersive environment where users step beyond the confines of traditional analysis. At its core, Immersive Analytics empowers users to traverse data landscapes in ways previously unattainable. By integrating interactive technologies such as VR glasses, expansive displays, and seamless IoT integration, facilitates an experiential journey into data realms. This transcendent experience propels consciousness from mundane reality to an alternate dimension, where data becomes palpable, navigable and comprehensible.
 To know about the Research Methodology :- Request Free Sample Report
The Immersive Analytics Market has witnessed a burgeoning interest, driven by its unique capacity to merge technological innovations with data exploration. It catalyzes unlocking the potential within voluminous datasets, offering a panoramic view that goes beyond conventional analytics. This comprehensive perspective enables stakeholders to glean nuanced insights and make informed decisions that transcend the limitations of traditional approaches. As organizations increasingly prioritize data-driven strategies, Immersive Analytics emerges as a transformative force. It empowers users to interact with data in a visceral, experiential manner, unveiling patterns, correlations, and insights that were previously concealed within complex datasets. This transformative potential not only enriches decision-making processes but also redefines the relationship between individuals and the data they leverage for innovation and growth. Though, the essence of Immersive Analytics lies in its ability to foster a sensory-rich environment, wherein individuals navigate complex data landscapes. Despite its nascent stage, the domain exhibits promising prospects for businesses, hinting at potential revenue amplification through adept problem-solving, facilitating growth by enhancing work performance, and strategic foresight. Yet, its implementation remains confined to sporadic workshops and limited-use cases, accentuating the need for a deeper exploration of its capabilities. The nuanced complexity of the Immersive Analytics Market delineates a promising trajectory, signifying a transformative shift in data perception and interaction. It nurtures a landscape where data becomes an experience, facilitating informed decision-making on unprecedented levels.
Trend
Integration of Artificial Intelligence (AI) and Machine Learning (ML) Algorithms
The trend shaping the landscape of immersive analytics revolves around the dynamic fusion of Artificial Intelligence (AI) and Machine Learning (ML) algorithms. This essential integration serves as the bedrock for transformative shifts in data analysis, predictive insights and digital transformation initiatives across diverse business sectors. As organizations harness the seamless amalgamation of AI and ML technologies, they leverage their capabilities to process extensive data volumes, thereby revolutionizing decision-making processes with real-time recommendations, insightful insights, and precise forecasts. While closely related, the distinctions between AI and ML are critical; AI encapsulates a suite of technologies aiming to replicate human cognitive functions, while ML, a subset of AI, facilitates autonomous learning and improvement from experience. This synergy marks a significant paradigm shift in immersive analytics, unlocking unprecedented levels of data understanding and utilization, which boosts Immersive Analytics Market growth.
Departments at the forefront of AI and ML research, such as Computer and Information Sciences, delve into foundational elements including multi-agent systems, reinforcement learning, and deep learning. These research endeavors extend into practical End Users across health, biomedical, educational, and geographical domains, showcasing the far-reaching impact and relevance of AI/ML technologies. The fusion of AI and ML is not confined to theoretical realms; it permeates real-world End Users. Natural Language Processing (NLP) plays a pivotal role in the Immersive Analytics Market, aiding organizations in automating tasks through bots by deciphering user intent and sentiment. Sentiment analysis, semantic analysis, and speech-to-text conversion revolutionize customer experiences. AI-driven analytics, empowered by ML algorithms, underpin advanced Business Intelligence (BI) tools, augmenting organizational visibility in the Immersive Analytics Market. This enhances decision-making accuracy and uncovers areas for operational refinement through data reservoirs and custom dashboards, driving impactful business outcomes.
Table No. 1: Integration of AI and ML Algorithms for Immersive Analytics
| Feature | AI Component | ML Algorithm | Description |
| Data Preprocessing | Data Wrangling | Feature Engineering, Data Cleaning | Preparation of raw data for AI/ML algorithms, including cleaning, filtering, normalization, and feature extraction. |
| Data Visualization | 3D Rendering, VR/AR Integration | Autoencoders, Dimensionality Reduction | Creation of immersive visualizations for data exploration and analysis, including 3D models, virtual environments, and augmented reality overlays. |
| Natural Language Processing (NLP) | Voice Recognition, Text Summarization | Sentiment Analysis, Topic Modeling | Understanding and extracting insights from text-based data within immersive experiences, such as user feedback and voice commands. |
| Computer Vision (CV) | Object Detection, Image Recognition | Pose Estimation, Activity Recognition | Analyzing and interpreting visual data in immersive environments, including recognizing objects, tracking user movements, and interpreting facial expressions. |
| User Interaction & Feedback | Intelligent Agents, Collaborative Interfaces | Reinforcement Learning, Bayesian Networks | Enabling natural interaction and feedback within immersive analytics, including gesture recognition, voice commands, and personalized recommendations. |
Immersive Analytics Market Dynamics
Drivers
Technological Advancements and Innovation to Boost Market Growth
Technological Advancements and Innovation serve as pivotal drivers propelling the evolution of Immersive Analytics. The amalgamation of breakthroughs in immersive technologies with data visualization has birthed Immersive Analytics, transcending the confines of traditional 2D displays. This convergence lays the groundwork for a transformative phenomenon known as Immersive Data Storytelling. This innovative fusion merges the narrative prowess of data storytelling with the immersive capabilities of virtual reality (VR), augmented reality (AR), mixed reality (MR), and 360-degree videos. Immersive Data Storytelling seeks to forge effective techniques and guidelines for crafting visually compelling data narratives within immersive environments which fuel Immersive Analytics Market growth.
The advent of this paradigm represents an intersection of various computing realms big data, machine learning, visualization, and augmented/mixed/virtual reality underpinning the emergent field of Immersive Analytics. The current landscape of immersive analytics research appears sporadic, lacking a cohesive framework. Augmented reality (AR) and virtual reality (VR) encompass the immersive spectrum, with AR offering a partly immersive experience integrating 3-D overlays onto real-world contexts in real-time, whereas VR presents fully immersive digital environments. AR devices, such as phone projections and AR glasses, require advancements in resolution displays and precise eye-tracking technologies for reduced lags and enhanced overlay accuracy. VR devices, including immersive headsets, demand lower-latency hardware and advanced sensors for full-body virtual tracking, showcasing potential technological advancements that could drive the evolution of the Immersive Analytics Market landscape.
Increasing Demand for Enhanced Data Visualization and User Experience to Boost Market Growth
Advanced data visualization offers an intuitive grasp of intricate datasets. Immersive analytics allows users to engage naturally with data, enhancing decision-making. Visual immersion enables swift recognition of hidden patterns, correlations, and outliers not easily discernible in conventional 2D displays. Immersive analytics platforms provide a more engaging and interactive experience for users. By leveraging technologies including AR, VR, and mixed reality, these platforms create an environment where users explore data in a three-dimensional space. This heightened level of interactivity and engagement makes the analytics process more interesting and accessible, encouraging users to spend more time exploring insights. Traditional analytics tools often confine data exploration within 2D representations, limiting depth. In contrast, Immersive Analytics Market solutions, offering 3D visualizations and interactive capabilities, empower users to explore data comprehensively from diverse angles and perspectives, fostering a deeper understanding of information. Immersive analytics tools often facilitate better communication and collaboration among teams. By visualizing data in an immersive environment, teams discuss insights more effectively, fostering a collaborative approach to problem-solving and decision-making. The demand for improved data visualization and user experience is prevalent across diverse industries including healthcare, manufacturing, gaming, education and others. Each sector seeks innovative ways to extract insights and make informed decisions from their data, making immersive analytics a versatile and sought-after solution.
Restraints
High Implementation Costs to Hamper Market Growth
Immersive analytics often requires specialized hardware and software components. Investing in high-end computing systems, virtual reality (VR) or augmented reality (AR) devices, high-resolution displays, and powerful processing units escalate the initial implementation costs significantly. Developing or customizing immersive analytics software tailored to specific business needs involves substantial expenses. Designing intuitive user interfaces, advanced data visualization tools, and integrating diverse data sources contribute to the high cost of software development. Developing and sustaining Immersive Analytics Market solutions requires a skilled workforce adept in data visualization, machine learning, AI, and user experience design. Recruiting, retaining these professionals, and training existing staff on novel tools and methodologies add to the implementation costs of immersive analytics solutions. Integrating immersive analytics tools with existing IT infrastructure, databases, and diverse data sources requires meticulous planning and investment in infrastructure. Ensuring compatibility and seamless integration across various systems amplify the implementation costs. Engaging external consultants or support services to guide the implementation process, address complexities, and provide ongoing support contributes to the overall implementation costs.
Immersive Analytics Market Segment Analysis
Based on the Offering, the Hardware offering is expected to dominate the Immersive Analytics Market over the forecast period. Hardware, including VR headsets, AR glasses, and specialized sensors, serves as the foundational infrastructure that enables immersive experiences. These devices provide users with the sensory inputs necessary to immerse themselves in augmented or virtual environments, significantly impacting the quality and depth of interaction with data. Ongoing advancements in hardware technology, such as improved display resolutions, increased processing power, enhanced spatial tracking, and more ergonomic designs, continually elevate the immersive experience. These advancements not only enhance the quality of immersion but also expand the range of End Users and industries where immersive analytics effectively deployed which fuel Immersive Analytics Market growth. Hardware advancements are crucial in driving user acceptance and adoption of immersive analytics. User-friendly, comfortable, and technologically advanced devices contribute to a positive user experience, encouraging wider adoption across various industries. As hardware becomes more accessible, cost-effective, and capable, it attracts a broader user base interested in leveraging immersive technologies for data visualization and analytics.
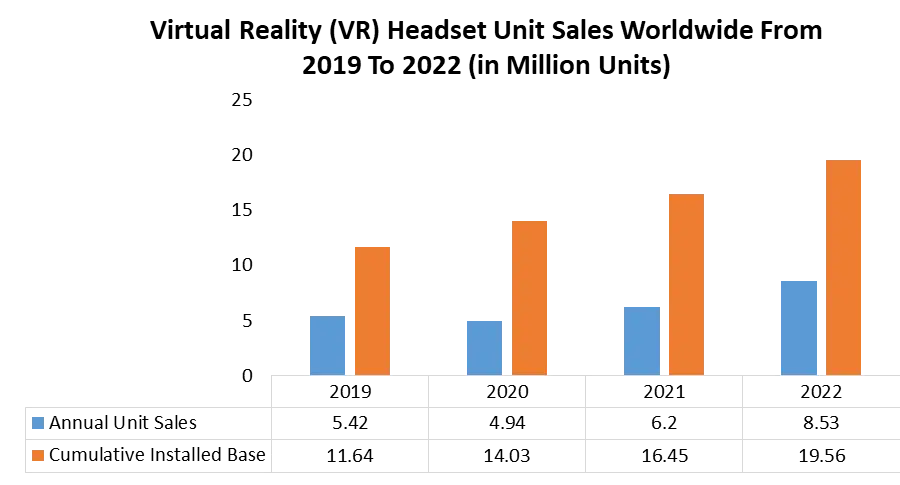
Worldwide VR headset unit sales have surged notably, driven by escalating demand for immersive experiences. The immersive analytics market, including hardware, has witnessed substantial growth due to the increased adoption of VR for data visualization and analysis across diverse industries.
Certain industries, such as healthcare, manufacturing, and education, rely heavily on specialized hardware for immersive analytics End Users. For instance, in healthcare, high-resolution VR imaging devices and AR-assisted surgery tools are indispensable for accurate diagnostics and surgical planning, emphasizing the dominance of hardware in this sector. Hardware innovation often drives substantial investments and research efforts within the Immersive Analytics Market. Companies continually invest in developing cutting-edge hardware solutions that enhance immersive experiences, thereby stimulating further innovation, competition, and market growth. The hardware forms the backbone of immersive analytics ecosystems, supporting the integration of software, analytics platforms, and services. The quality, capabilities, and interoperability of hardware solutions significantly influence the effectiveness and efficiency of immersive analytics implementations.
In Canada, the healthcare sector stands as a prime example where specialized hardware plays a pivotal role in Immersive Analytics End Users. Medical institutions leverage cutting-edge VR imaging devices and AR-assisted surgery tools to revolutionize diagnostics and surgical procedures.
For instance, high-resolution VR imaging systems such as 3D virtual colonoscopies or MRI/CT scans offer physicians and surgeons detailed and interactive views of patient anatomy, aiding in accurate diagnostics and treatment planning. These immersive technologies enable healthcare professionals to navigate through complex anatomical structures in a virtual environment, enhancing their understanding and decision-making capabilities. In surgical settings, AR-assisted tools overlay vital patient information, such as internal structures or tumor locations, onto the surgeon's field of view during procedures. This technology guides surgeons in real time, allowing for precise and minimally invasive interventions. For instance, AR-based systems assist in neurosurgery by providing navigational guidance based on preoperative imaging, ensuring precise incisions and reducing surgical risks.
Immersive Analytics Market Regional Insights
North America dominated the Immersive Analytics Market in 2023 with the largest share. North America, particularly the United States, serves as a hub for cutting-edge technological innovation, boasting renowned centers such as Silicon Valley, Seattle, and Boston. These dynamic ecosystems nurture a diverse landscape of tech firms, startups, research entities, and venture capitalists devoted to advancing immersive technologies including virtual reality (VR), augmented reality (AR) and mixed reality (MR). Substantial investments in research and development across leading universities, research centers, and tech giants within the region propel continuous innovation in immersive analytics. These initiatives drive pioneering advancements in data visualization, human-computer interaction, and AI-powered analytics which drive the Immersive Analytics Market growth. Key industries in North America, spanning healthcare, gaming, entertainment, aerospace, and automotive sectors, enthusiastically adopt immersive analytics solutions to enhance operations, training, consumer experiences, and data-driven insights. These sectors leverage immersive technologies to enhance customer experiences, streamline processes, improve training, and gain deeper insights from data. North America experienced early adoption of immersive technologies compared to other regions. This early start has led to a more mature market with a rapid infrastructure, a variety of immersive analytics solutions, and a greater understanding of the technology's potential End Users.
The regulatory environment in North America is relatively conducive to technological innovation. This allows for more flexibility in testing and implementing immersive analytics solutions, enabling faster iterations and advancements in the field. The region fosters collaborations between academia, industry, and government bodies. These partnerships facilitate knowledge exchange, access to funding, and collective efforts to advance immersive analytics technologies. North American consumers and businesses exhibit a high level of awareness and demand for immersive experiences. This consumer demand, coupled with the willingness of enterprises to invest in innovative technologies, has propelled the growth of the Immersive Analytics Market in the region.
Asia Pacific is expected to have the highest growth rate for the Immersive Analytics Market during the forecast period. Ongoing advancements in VR/AR technologies and hardware have made immersive analytics more accessible and cost-effective, encouraging businesses to explore these solutions for data analysis. Various industries, including healthcare, education, gaming, and manufacturing, are leveraging immersive analytics to enhance data visualization, training, simulations, and decision-making processes. Some governments in the region have been promoting the adoption of immersive technologies through funding, incentives, and supportive policies, fostering growth in this market. Companies are increasingly focusing on improving user experiences, and immersive analytics offers a visually engaging and interactive way to interact with data.
Immersive Analytics Market Scope : Inquire Before Buying
| Global Immersive Analytics Market | |||
|---|---|---|---|
| Report Coverage | Details | ||
| Base Year: | 2023 | Forecast Period: | 2024-2030 |
| Historical Data: | 2018 to 2023 | Market Size in 2023: | USD 1199.22 Mn. |
| Forecast Period 2024 to 2030 CAGR: | 51.8% | Market Size in 2030: | USD 22274.16 Mn. |
| Segments Covered: | by Offering | Hardware Solution Services |
|
| by Application | Education and Training Sales and Marketing Design and Visualization Strategy Planning Others |
||
| by End User | Healthcare Media and Entertainment Automotive and Transportation Government and Defense Others |
||
Immersive Analytics Market,Key Players
North America (United States, Canada, and Mexico)
Europe (UK, France, Germany, Italy, Spain, Sweden, Austria and the Rest of Europe)
Asia Pacific (China, South Korea, Japan, India, Australia, Indonesia, Malaysia, Vietnam, Taiwan, Bangladesh, Pakistan and the Rest of APAC)
South America (Brazil, Argentina Rest of South America)
Middle East & Africa (South Africa, GCC, Egypt, Nigeria and the Rest of ME&A)
Immersive Analytics Market, Key Players
1. Microsoft
2. Salesforce
3. SAP
4. IBM
5. Qlik
6. Siemens AG
7. NVIDIA
8. Unity Technologies
9. Google
10. TIBCO Software
11. Accenture
12. Dassault Systèmes
13. Zebra BI
14. HTC Vive
15. PTC
16. Sisense
17. Autodesk
18. Hexagon AB
19. Palantir Technologies
20. Cognite AS
21. Amazon Web Services (AWS)
22. Alteryx
23. Talend
24. MicroStrategy
25. Domo
Frequently Asked Questions:
1] What is the growth rate of the Global Immersive Analytics Market?
Ans. The Global Immersive Analytics Market is growing at a significant rate of 51.8 % during the forecast period.
2] Which region is expected to dominate the Global Immersive Analytics Market?
Ans. North America is expected to dominate the Immersive Analytics Market during the forecast period.
3] What was the Global Immersive Analytics Market size in 2023?
Ans: The Global Immersive Analytics Market size was USD 1199.22 Million in 2023.
4] Which are the top players in the Global Immersive Analytics Market?
Ans. The major top players in the Global Immersive Analytics Market are Microsoft, Salesforce, SAP, IBM, Qlik, Siemens AG, NVIDIA, Unity Technologies, Google, TIBCO Software, Accenture, Dassault Systèmes, Zebra BI, HTC Vive, PTC, Sisense, Autodesk, Hexagon AB, Palantir Technologies and Others.
5] What are the factors driving the Global Immersive Analytics Market growth?
Ans. The technological advancements and increasing demand for enhanced data visualization and user experience are expected to drive market growth during the forecast period.