Global Web Performance Market: Global Industry Analysis and Forecast (2023-2030)

Global Web Performance Market size was valued at USD 5.83 Bn. in 2023 and the total Web Performance Market revenue is expected to grow at 8.69% from 2024 to 2030, reaching nearly USD 10.45 Bn. Web performance is a critical aspect of digital presence, directly impacting user satisfaction, engagement, and business outcomes. Factors influencing web performance include the optimization of code, efficient use of resources, effective content delivery strategies, and the utilization of technologies such as content delivery networks (CDNs) and caching mechanisms. In 2023, the web performance market presents a dynamic landscape driven by the increasing emphasis on delivering seamless digital experiences. The web performance market is driven by the growing significance of optimal website performance for user satisfaction and business success. Key players such as Akamai Technologies, Cloudflare, and Dynatrace are at the forefront, offering solutions that enhance website speed, reliability, and overall performance. The dominance of specific regions is marked, with North America and Europe emerging as key markets for web performance solutions, collectively accounting for over 60% of the market share. The Asia-Pacific region follows closely, experiencing substantial growth due to the production of online activities and e-commerce. For global businesses, the critical role of web performance in user engagement and retention, investments in content delivery networks (CDNs), application performance monitoring (APM), and edge computing solutions continue to surge. The growing adoption of cloud-based services and the persistent search for superior user experiences contribute to the rapid growth of the web performance market. As organizations prioritize digital transformation initiatives, the competitive landscape is marked by innovation and strategic collaborations among key players like IBM CorporationArmonk, F5, Inc., Adobe Systems, etc.., shaping the trajectory of the web performance market in 2023 and beyond.Web Performance Market
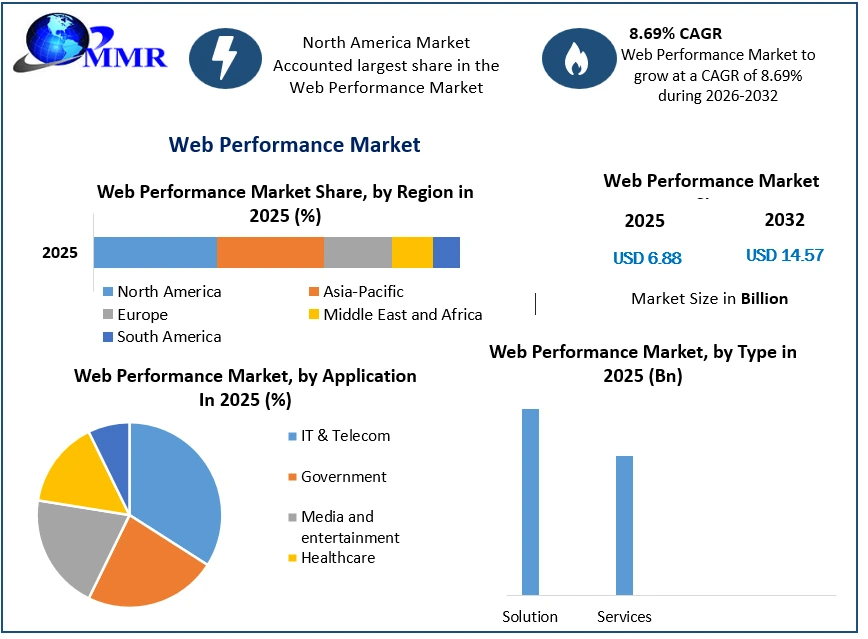
To know about the Research Methodology :- Request Free Sample Report

Web Performance Market Dynamics:

The Growth of the E-Commerce Industry, the Spread of Images, Videos, and Rich Media on the Web The surge in e-commerce growth and the widespread integration of images, videos, and rich media online are key drivers propelling the web performance market. The rapid growth of the e-commerce sector underscores the critical importance of site performance, prompting increased attention from retailers. Web performance solutions, through efficient deployment, not only enhance site speed but also reduce costs significantly by optimizing the delivery of static resources, minimizing bandwidth, and lowering computation costs. Additionally, the escalating volume of images, videos, and rich media on the web amplifies the necessity for web performance solutions to streamline the delivery of these resources. The global web performance market anticipates substantial growth, with North America leading in market share. Furthermore, the escalating threat of security breaches and cyber-attacks targeting enterprise websites intensifies the demand for robust web performance solutions. Web Performance Market1The Deployment of Web Performance Solutions Reduce Costs and Serve the Most Web performance solutions play a pivotal role in cost reduction and optimization of static resource delivery, Images and videos leading to decreased bandwidth and computation expenses. These solutions are adept at efficiently serving a majority, if not all, of static resources, effectively curbing bandwidth and compute resource consumption. With the internet witnessing a continuous entry of rich media and dynamic content, the efficient delivery of these resources is authoritative. Key players like GoogleMountain View, Adobe Systems, and F5, Inc., particularly in the thriving e-commerce sector, benefit significantly from streamlined content delivery, reduced bandwidth usage, and an enhanced user experience. The adoption of web performance solutions emerges as a critical driver for the web performance market growth, offering a dual advantage of improved user experience and substantial cost savings. The Complexity of Deploying and Managing Web Performance Solutions Be a Challenge for Some Key Players The deployment and management complexities associated with web performance solutions pose restraints for certain key players. These solutions often demand specialized expertise for seamless integration and ongoing maintenance, creating challenges for objects with limited technical resources. Optimizing web performance involves intricate tasks, including the implementation of caching strategies, reduction of render-blocking resources, and the management of content delivery networks, necessitating specialized knowledge and continuous monitoring. The diversity of available web performance solutions, ranging from on-premises to cloud-based options, contributes to the complexity of decision-making and implementation. Some organizations may encounter obstacles in effectively adopting and managing these solutions, potentially hindering their ability to fully capitalize on the advantages of enhanced web performance. Despite these challenges, the growing demand for efficiency in web performance is catalyzing innovation in the web performance market, with providers striving to address complexities and offer more accessible solutions.      

Web Performance Market Segment Analysis:

By Components, the solution segment held the largest market share of 62% in 2023. Web connectivity demand has increased in recent years due to the increased use of linked IT devices. Web Performance solutions provide customers with fast, tailored online experiences, allowing businesses to boost revenue, improve IT agility, and scale globally. The web performance market solutions are likely to grow as a result of increasing Web Performance market growth. Key players in this segment include renowned cybersecurity companies such as Akamai Technologies, Inc., IBM CorporationArmonk, F5, Inc., and SolarWinds Worldwide, LLC these companies contribute to the Web Performance market dynamic growth by constantly innovating and enhancing their software offerings. Web Performance Market2By Organization size, Within the Web Performance market, small and medium enterprises (SMEs) emerge as a driving force, significantly influencing market dynamics and fostering innovation. In 2023, SMEs hold a significant market share of 61%, with their growing awareness of the pivotal role played by web performance in elevating user experiences. 90% of global businesses fall under the SME category, and their adoption of web performance solutions, such as content delivery networks (CDNs) and optimization tools, is pivotal. These enterprises prioritize cost-effective solutions to streamline their online presence, enhance website speed, and ensure smooth user interactions. The demand from SMEs propels ongoing advancements in accessible and budget-friendly web performance technologies, contributing to a dynamic and competitive market landscape. Web Performance Market3By End-users, the IT and Telecom segment held the largest market share of 36% in 2023. This industry business activities are heavily reliant on the internet, necessitating the adoption of web performance solutions to ensure high-quality, improved, and tailored web experiences. Web performance solutions give IT and telecom businesses rapid, accurate, and advanced technical support, resulting in the best output with the least amount of time and money spent.

Web Performance Market Regional Insights:

North America holds a significant share of the global Web Performance market. North America dominated the global market with a share of 36% in 2023. The growing key player investment and mergers and acquisitions. For Instance, SolarWinds, a US-based IT management solution provider, announced updates to their web performance monitoring (WPM) solutions, Web Performance Monitor 3.0, and Pingdom. Web Performance Monitor, which is part of SolarWinds' Orion Platform, tracks the performance of internally developed websites and web-based applications. The updates are made to make it easier for users with complex IT infrastructures, including hybrid cloud and multi-cloud deployments, to observe website and web application performance. The Asia-Pacific region showcases significant growth potential, fueled by the growing digital economy in countries like China and India. South America and the Middle East & Africa regions are witnessing increased adoption as businesses recognize the importance of optimal web performance. The European Web Performance market covers countries such as Germany, the United Kingdom, France, Spain, the Netherlands, Italy, and the rest of Europe. Recent Developments in the Web Performance Market 1. F5 announced Silverline Shape Defense, a solution to protect websites from the escalating tsunami of fraudulent internet traffic, in July 2021. F5's Silverline managed security services increase online security and performance while also filling the skills gap in cyber security specialists needed to respond to the most recent cyber-attacks in real-time. 2. Cisco announced its intention to buy ThousandEyes, Inc. in May 2021, and would integrate its capabilities into the App Dynamics application intelligence section to improve visibility across the enterprise, web, and cloud. By giving end-to-end insight when accessing cloud apps, the acquisition will provide a more in-depth and broader profile to spot faults and improve web and application performance across all networks the organization relies on.

Web Performance Competitive Landscapes:

Akamai (US): The latest acquisition made by Akamai Technologies was the acquisition of select enterprise customer contracts from StackPath, a content delivery network provider, in August 2023. The acquisition aimed to extend Akamai's standard offerings and support to customers looking for an enterprise-grade content delivery network. CA Technologies (US): The latest acquisition made by CA Technologies was the acquisition of SourceClear in May 2022. SourceClear is a provider of software composition analysis tools that help developers identify and manage open-source components and associated security and licensing risks. The acquisition was aimed at enhancing CA's DevSecOps portfolio by integrating SourceClear SCA capabilities into CA's Veracode application security business. CDNetworks: CDNetworks with its parent company, Wangsu, invested approximately USD 68 million in 2023 toward developing cloud security, edge computing businesses, and other key innovation areas. This substantial investment was aimed at enhancing CDNetworks' capabilities in providing premium solutions and support for media streaming, e-commerce, gaming acceleration, e-learning, and other online platforms with low latency, high reliability, and scalability. CDNetworks raised USD 96.5 million in private investment, with funding from Oak Investment Partners, Shinhan Private Equity, and Goldman Sachs International, to accelerate its growth. These investments and funding activities demonstrate CDNetworks' dedication to driving innovation, enhancing its service offerings, and fueling its growth in key markets.

Web Performance Market Scope: Inquire before buying

Global Web Performance Market
Report Coverage Details
Base Year: 2023 Forecast Period: 2024-2030
Historical Data: 2018 to 2023 Market Size in 2023: US $ 5.83 Bn.
Forecast Period 2024 to 2030 CAGR: 8.69% Market Size in 2030: US $ 10.45 Bn.
Segments Covered: By Component Solution Services
By Deployment On-premise Cloud
By Organization Size Large Enterprise Small and Medium Enterprise
By End-User IT & Telecom Government Media and entertainment Healthcare Logistics and transportation Manufacturing

Web Performance Market by Region:

North America (United States, Canada, and Mexico) Europe (UK, France, Germany, Italy, Spain, Sweden, Austria, and the Rest of Europe) Asia Pacific (China, South Korea, Japan, India, Australia, Indonesia, Malaysia, Vietnam, Taiwan, Bangladesh, Pakistan, and the Rest of APAC) Middle East and Africa (South Africa, GCC, Egypt, Nigeria, and the Rest of ME&A) South America (Brazil, Argentina Rest of South America)

Web Performance Market Key Players:

1. Akamai Technologies, Inc. (Cambridge, Massachusetts) 2. IBM Corporation Armonk (United States) 3. F5, Inc. (Washington, United States) 4. SolarWinds Worldwide, LLC (Texas, United States) 5. CA Technologies (New York, United States) 6. Cavisson Systems Inc. (California, United States) 7. Cloudflare, Inc. (California, United States) 8. Splunk Inc. (California, United States) 9. SAS Institute Inc. (North Carolina, United States) 10. Teradata Corporation (California, United States) 11. WebTrends(United States) 12. Neustar (United States) 13. GoogleMountain View (California, United States) 14. Adobe Systems(California, United States) 15. MicroStrategy Incorporated Tysons Corner (Virginia, United States) 16. Micro Focus International (United Kingdom) 17. At InternetMérignac (France) 18. CDNetworksSeoul (South Korea)

FAQs:

1. What are the growth drivers for the Web Performance market? Ans. The growing e-commerce industry and Demand for Instant, Secure, and Reliable Access are expected to be the major drivers for the Web Performance market. 2. Which region is expected to lead the global Web Performance Market during the forecast period? Ans. North America is expected to lead the global Web Performance Market during the forecast period. 3. What is the projected market size and growth rate of the Web Performance Market? Ans. The Web Performance Market size was valued at USD 5.83 Billion in 2023 and the total Web Performance revenue is expected to grow at a CAGR of 8.69% from 2024 to 2030, reaching nearly USD 10.45 Billion by 2030. 4. What segments are covered in the Web Performance Market report? Ans. The segments covered in the Web Performance Market report are By Component, By Deployment, By Organization Size, By End-use, and Region. 5. What is the study period of the Web Performance Market? Ans: The Global Web Performance Market is studied from 2023 to 2030.
1. Web Performance Market: Research Methodology 2. Web Performance Market Introduction 2.1 Study Assumption and Market Definition 2.2 Scope of the Study 2.3 Executive Summary 3. Web Performance Market: Dynamics 3.1 Web Performance Market Trends by Region 3.1.1 North America Web Performance Market Trends 3.1.2 Europe Web Performance Market Trends 3.1.3 Asia Pacific Web Performance Market Trends 3.1.4 Middle East and Africa Web Performance Market Trends 3.1.5 South America Web Performance Market Trends 3.2 Web Performance Market Dynamics by Region 3.2.1 North America 3.2.1.1 North America Web Performance Market Drivers 3.2.1.2 North America Web Performance Market Restraints 3.2.1.3 North America Web Performance Market Opportunities 3.2.1.4 North America Web Performance Market Challenges 3.2.2 Europe 3.2.2.1 Europe Web Performance Market Drivers 3.2.2.2 Europe Web Performance Market Restraints 3.2.2.3 Europe Web Performance Market Opportunities 3.2.2.4 Europe Web Performance Market Challenges 3.2.3 Asia Pacific 3.2.3.1 Asia Pacific Web Performance Market Drivers 3.2.3.2 Asia Pacific Web Performance Market Restraints 3.2.3.3 Asia Pacific Web Performance Market Opportunities 3.2.3.4 Asia Pacific Web Performance Market Challenges 3.2.4 Middle East and Africa 3.2.4.1 Middle East and Africa Web Performance Market Drivers 3.2.4.2 Middle East and Africa Web Performance Market Restraints 3.2.4.3 Middle East and Africa Web Performance Market Opportunities 3.2.4.4 Middle East and Africa Web Performance Market Challenges 3.2.5 South America 3.2.5.1 South America Web Performance Market Drivers 3.2.5.2 South America Web Performance Market Restraints 3.2.5.3 South America Web Performance Market Opportunities 3.2.5.4 South America Web Performance Market Challenges 3.3 PORTER’s Five Forces Analysis 3.4 PESTLE Analysis 3.5 Regulatory Landscape by Region 3.5.1 North America 3.5.2 Europe 3.5.3 Asia Pacific 3.5.4 Middle East and Africa 3.5.5 South America 3.6 Analysis of Government Schemes and Initiatives for the Web Performance Industry 3.7 Technological Road Map 4. Global Web Performance Market: Global Market Size and Forecast by Segmentation (Value) (2023-2030) 4.1 Global Web Performance Market Size and Forecast, By Component(2023-2030) 4.1.1 Solution 4.1.2 Services 4.2 Global Web Performance Market Size and Forecast, By Deployment (2023-2030) 4.2.1 On-premise 4.2.2 Cloud 4.3 Global Web Performance Market Size and Forecast, By Organization Size(2023-2030) 4.3.1 Large Enterprise 4.3.2 Small and Medium Enterprise 4.4 Global Web Performance Market Size and Forecast, By End-User(2023-2030) 4.4.1 IT & Telecom 4.4.2 Government 4.4.3 Media and entertainment 4.4.4 Healthcare 4.4.5 Logistics and transportation 4.4.6 Manufacturing 4.5 Global Web Performance Market Size and Forecast, by Region (2023-2030) 4.5.1 North America 4.5.2 Europe 4.5.3 Asia Pacific 4.5.4 Middle East and Africa 4.5.5 South America 5. North America Web Performance Market Size and Forecast by Segmentation (Value) (2023-2030) 5.1 North America Web Performance Market Size and Forecast, By Component(2023-2030) 5.1.1 Solution 5.1.2 Services 5.2 North America Web Performance Market Size and Forecast, By Deployment (2023-2030) 5.2.1 On-premise 5.2.2 Cloud 5.3 North America Web Performance Market Size and Forecast, By Organization Size(2023-2030) 5.3.1 Large Enterprise 5.3.2 Small and Medium Enterprise 5.4 North America Web Performance Market Size and Forecast, By End-User(2023-2030) 5.4.1 IT & Telecom 5.4.2 Government 5.4.3 Media and entertainment 5.4.4 Healthcare 5.4.5 Logistics and transportation 5.4.6 Manufacturing 5.5 North America Web Performance Market Size and Forecast, by Country (2023-2030) 5.5.1 United States 5.5.1.1 United States Web Performance Market Size and Forecast, By Component(2023-2030) 5.5.1.1.1 Solution 5.5.1.1.2 Services 5.5.1.2 United States Web Performance Market Size and Forecast, By Deployment (2023-2030) 5.5.1.2.1 On-premise 5.5.1.2.2 Cloud 5.5.1.3 United States Web Performance Market Size and Forecast, By Organization Size(2023-2030) 5.5.1.3.1 Large Enterprise 5.5.1.3.2 Small and Medium Enterprise 5.5.1.4 United States Web Performance Market Size and Forecast, By End-User(2023-2030) 5.5.1.4.1 IT & Telecom 5.5.1.4.2 Government 5.5.1.4.3 Media and entertainment 5.5.1.4.4 Healthcare 5.5.1.4.5 Logistics and transportation 5.5.1.4.6 Manufacturing 5.5.2 Canada 5.5.2.1 Canada Web Performance Market Size and Forecast, By Component (2023-2030) 5.5.2.1.1 Solution 5.5.2.1.2 Services 5.5.2.2 Canada Web Performance Market Size and Forecast, By Deployment (2023-2030) 5.5.2.2.1 On-premise 5.5.2.2.2 Cloud 5.5.2.3 Canada Web Performance Market Size and Forecast, By Organization Size(2023-2030) 5.5.2.3.1 Large Enterprise 5.5.2.3.2 Small and Medium Enterprise 5.5.2.4 Canada Web Performance Market Size and Forecast, By End-User(2023-2030) 5.5.2.4.1 IT & Telecom 5.5.2.4.2 Government 5.5.2.4.3 Media and entertainment 5.5.2.4.4 Healthcare 5.5.2.4.5 Logistics and transportation 5.5.2.4.6 Manufacturing 5.5.3 Mexico 5.5.3.1 Mexico Web Performance Market Size and Forecast, By Component (2023-2030) 5.5.3.1.1 Solution 5.5.3.1.2 Services 5.5.3.2 Mexico Web Performance Market Size and Forecast, By Deployment (2023-2030) 5.5.3.2.1 On-premise 5.5.3.2.2 Cloud 5.5.3.3 Mexico Web Performance Market Size and Forecast, By Organization Size(2023-2030) 5.5.3.3.1 Large Enterprise 5.5.3.3.2 Small and Medium Enterprise 5.5.3.4 Mexico Web Performance Market Size and Forecast, By End-User(2023-2030) 5.5.3.4.1 IT & Telecom 5.5.3.4.2 Government 5.5.3.4.3 Media and entertainment 5.5.3.4.4 Healthcare 5.5.3.4.5 Logistics and transportation 5.5.3.4.6 Manufacturing 6. Europe Web Performance Market Size and Forecast by Segmentation (Value) (2023-2030) 6.1 Europe Web Performance Market Size and Forecast, By Component (2023-2030) 6.2 Europe Web Performance Market Size and Forecast, By Deployment (2023-2030) 6.3 Europe Web Performance Market Size and Forecast, By Organization Size(2023-2030) 6.4 Europe Web Performance Market Size and Forecast, By End-User(2023-2030) 6.5 Europe Web Performance Market Size and Forecast, by Country (2023-2030) 6.5.1 United Kingdom 6.5.1.1 United Kingdom Web Performance Market Size and Forecast, By Component (2023-2030) 6.5.1.2 United Kingdom Web Performance Market Size and Forecast, By Deployment (2023-2030) 6.5.1.3 United Kingdom Web Performance Market Size and Forecast, By Organization Size(2023-2030) 6.5.1.4 United Kingdom Web Performance Market Size and Forecast, By End-User(2023-2030) 6.5.2 France 6.5.2.1 France Web Performance Market Size and Forecast, By Component(2023-2030) 6.5.2.2 France Web Performance Market Size and Forecast, By Deployment (2023-2030) 6.5.2.3 France Web Performance Market Size and Forecast, By Organization Size(2023-2030) 6.5.2.4 France Web Performance Market Size and Forecast, By End-User(2023-2030) 6.5.3 Germany 6.5.3.1 Germany Web Performance Market Size and Forecast, By Component(2023-2030) 6.5.3.2 Germany Web Performance Market Size and Forecast, By Deployment (2023-2030) 6.5.3.3 Germany Web Performance Market Size and Forecast, By Organization Size(2023-2030) 6.5.3.4 Germany Web Performance Market Size and Forecast, By End-User(2023-2030) 6.5.4 Italy 6.5.4.1 Italy Web Performance Market Size and Forecast, By Component(2023-2030) 6.5.4.2 Italy Web Performance Market Size and Forecast, By Deployment (2023-2030) 6.5.4.3 Italy Web Performance Market Size and Forecast, By Organization Size(2023-2030) 6.5.4.4 Italy Web Performance Market Size and Forecast, By End-User(2023-2030) 6.5.5 Spain 6.5.5.1 Spain Web Performance Market Size and Forecast, By Component(2023-2030) 6.5.5.2 Spain Web Performance Market Size and Forecast, By Deployment (2023-2030) 6.5.5.3 Spain Web Performance Market Size and Forecast, By Organization Size(2023-2030) 6.5.5.4 Spain Web Performance Market Size and Forecast, By End-User(2023-2030) 6.5.6 Sweden 6.5.6.1 Sweden Web Performance Market Size and Forecast, By Component(2023-2030) 6.5.6.2 Sweden Web Performance Market Size and Forecast, By Deployment (2023-2030) 6.5.6.3 Sweden Web Performance Market Size and Forecast, By Organization Size(2023-2030) 6.5.6.4 Sweden Web Performance Market Size and Forecast, By End-User(2023-2030) 6.5.7 Austria 6.5.7.1 Austria Web Performance Market Size and Forecast, By Component(2023-2030) 6.5.7.2 Austria Web Performance Market Size and Forecast, By Deployment (2023-2030) 6.5.7.3 Austria Web Performance Market Size and Forecast, By Organization Size(2023-2030) 6.5.7.4 Austria Web Performance Market Size and Forecast, By End-User(2023-2030) 6.5.8 Rest of Europe 6.5.8.1 Rest of Europe Web Performance Market Size and Forecast, By Component(2023-2030) 6.5.8.2 Rest of Europe Web Performance Market Size and Forecast, By Deployment (2023-2030). 6.5.8.3 Rest of Europe Web Performance Market Size and Forecast, By Organization Size(2023-2030) 6.5.8.4 Rest of Europe Web Performance Market Size and Forecast, By End-User(2023-2030) 7. Asia Pacific Web Performance Market Size and Forecast by Segmentation (Value) (2023-2030) 7.1 Asia Pacific Web Performance Market Size and Forecast, By Component(2023-2030) 7.2 Asia Pacific Web Performance Market Size and Forecast, By Deployment (2023-2030) 7.3 Asia Pacific Web Performance Market Size and Forecast, By Organization Size(2023-2030) 7.4 Asia Pacific Web Performance Market Size and Forecast, By End-User(2023-2030) 7.5 Asia Pacific Web Performance Market Size and Forecast, by Country (2023-2030) 7.5.1 China 7.5.1.1 China Web Performance Market Size and Forecast, By Component(2023-2030) 7.5.1.2 China Web Performance Market Size and Forecast, By Deployment (2023-2030) 7.5.1.3 China Web Performance Market Size and Forecast, By Organization Size(2023-2030) 7.5.1.4 China Web Performance Market Size and Forecast, By End-User(2023-2030) 7.5.2 South Korea 7.5.2.1 S Korea Web Performance Market Size and Forecast, By Component(2023-2030) 7.5.2.2 S Korea Web Performance Market Size and Forecast, By Deployment (2023-2030) 7.5.2.3 S Korea Web Performance Market Size and Forecast, By Organization Size(2023-2030) 7.5.2.4 S Korea Web Performance Market Size and Forecast, By End-User(2023-2030) 7.5.3 Japan 7.5.3.1 Japan Web Performance Market Size and Forecast, By Component(2023-2030) 7.5.3.2 Japan Web Performance Market Size and Forecast, By Deployment (2023-2030) 7.5.3.3 Japan Web Performance Market Size and Forecast, By Organization Size(2023-2030) 7.5.3.4 Japan Web Performance Market Size and Forecast, By End-User(2023-2030) 7.5.4 India 7.5.4.1 India Web Performance Market Size and Forecast, By Component(2023-2030) 7.5.4.2 India Web Performance Market Size and Forecast, By Deployment (2023-2030) 7.5.4.3 India Web Performance Market Size and Forecast, By Organization Size(2023-2030) 7.5.4.4 India Web Performance Market Size and Forecast, By End-User(2023-2030) 7.5.5 Australia 7.5.5.1 Australia Web Performance Market Size and Forecast, By Component(2023-2030) 7.5.5.2 Australia Web Performance Market Size and Forecast, By Deployment (2023-2030) 7.5.5.3 Australia Web Performance Market Size and Forecast, By Organization Size(2023-2030) 7.5.5.4 Australia Web Performance Market Size and Forecast, By End-User(2023-2030) 7.5.6 Indonesia 7.5.6.1 Indonesia Web Performance Market Size and Forecast, By Component(2023-2030) 7.5.6.2 Indonesia Web Performance Market Size and Forecast, By Deployment (2023-2030) 7.5.6.3 Indonesia Web Performance Market Size and Forecast, By Organization Size(2023-2030) 7.5.6.4 Indonesia Web Performance Market Size and Forecast, By End-User(2023-2030) 7.5.7 Malaysia 7.5.7.1 Malaysia Web Performance Market Size and Forecast, By Component(2023-2030) 7.5.7.2 Malaysia Web Performance Market Size and Forecast, By Deployment (2023-2030) 7.5.7.3 Malaysia Web Performance Market Size and Forecast, By Organization Size(2023-2030) 7.5.7.4 Malaysia Web Performance Market Size and Forecast, By End-User(2023-2030) 7.5.8 Vietnam 7.5.8.1 Vietnam Web Performance Market Size and Forecast, By Component(2023-2030) 7.5.8.2 Vietnam Web Performance Market Size and Forecast, By Deployment (2023-2030) 7.5.8.3 Vietnam Web Performance Market Size and Forecast, By Organization Size(2023-2030) 7.5.8.4 Vietnam Web Performance Market Size and Forecast, By End-User(2023-2030) 7.5.9 Taiwan 7.5.9.1 Taiwan Web Performance Market Size and Forecast, By Component(2023-2030) 7.5.9.2 Taiwan Web Performance Market Size and Forecast, By Deployment (2023-2030) 7.5.9.3 Taiwan Web Performance Market Size and Forecast, By Organization Size(2023-2030) 7.5.9.4 Taiwan Web Performance Market Size and Forecast, By End-User(2023-2030) 7.5.10 Bangladesh 7.5.10.1 Bangladesh Web Performance Market Size and Forecast, By Component(2023-2030) 7.5.10.2 Bangladesh Web Performance Market Size and Forecast, By Deployment (2023-2030) 7.5.10.3 Bangladesh Web Performance Market Size and Forecast, By Organization Size(2023-2030) 7.5.10.4 Bangladesh Web Performance Market Size and Forecast, By End-User(2023-2030) 7.5.11 Pakistan 7.5.11.1 Pakistan Web Performance Market Size and Forecast, By Component(2023-2030) 7.5.11.2 Pakistan Web Performance Market Size and Forecast, By Deployment (2023-2030) 7.5.11.3 Pakistan Web Performance Market Size and Forecast, By Organization Size(2023-2030) 7.5.11.4 Pakistan Web Performance Market Size and Forecast, By End-User(2023-2030) 7.5.12 Rest of Asia Pacific 7.5.12.1 Rest of Asia Pacific Web Performance Market Size and Forecast, By Component(2023-2030) 7.5.12.2 Rest of Asia Pacific Web Performance Market Size and Forecast, By Deployment (2023-2030) 7.5.12.3 Rest of Asia Pacific Web Performance Market Size and Forecast, By Organization Size(2023-2030) 7.5.12.4 Rest of Asia Pacific Web Performance Market Size and Forecast, By End-User(2023-2030) 8. Middle East and Africa Web Performance Market Size and Forecast by Segmentation (Value) (2023-2030) 8.1 Middle East and Africa Web Performance Market Size and Forecast, By Component(2023-2030) 8.2 Middle East and Africa Web Performance Market Size and Forecast, By Deployment (2023-2030) 8.3 Middle East and Africa Web Performance Market Size and Forecast, By Organization Size(2023-2030) 8.4 Middle East and Africa Web Performance Market Size and Forecast, By End-User(2023-2030) 8.5 Middle East and Africa Web Performance Market Size and Forecast, by Country (2023-2030) 8.5.1 South Africa 8.5.1.1 South Africa Web Performance Market Size and Forecast, By Component(2023-2030) 8.5.1.2 South Africa Web Performance Market Size and Forecast, By Deployment (2023-2030) 8.5.1.3 South Africa Web Performance Market Size and Forecast, By Organization Size(2023-2030) 8.5.1.4 South Africa Web Performance Market Size and Forecast, By End-User(2023-2030) 8.5.2 GCC 8.5.2.1 GCC Web Performance Market Size and Forecast, By Component(2023-2030) 8.5.2.2 GCC Web Performance Market Size and Forecast, By Deployment (2023-2030) 8.5.2.3 GCC Web Performance Market Size and Forecast, By Organization Size(2023-2030) 8.5.2.4 GCC Web Performance Market Size and Forecast, By End-User(2023-2030) 8.5.3 Egypt 8.5.3.1 Egypt Web Performance Market Size and Forecast, By Component(2023-2030) 8.5.3.2 Egypt Web Performance Market Size and Forecast, By Deployment (2023-2030) 8.5.3.3 Egypt Web Performance Market Size and Forecast, By Organization Size(2023-2030) 8.5.3.4 Egypt Web Performance Market Size and Forecast, By End-User(2023-2030) 8.5.4 Nigeria 8.5.4.1 Nigeria Web Performance Market Size and Forecast, By Component(2023-2030) 8.5.4.2 Nigeria Web Performance Market Size and Forecast, By Deployment (2023-2030) 8.5.4.3 Nigeria Web Performance Market Size and Forecast, By Organization Size(2023-2030) 8.5.4.4 Nigeria Web Performance Market Size and Forecast, By End-User(2023-2030) 8.5.5 Rest of ME&A 8.5.5.1 Rest of ME&A Web Performance Market Size and Forecast, By Component(2023-2030) 8.5.5.2 Rest of ME&A Web Performance Market Size and Forecast, By Deployment (2023-2030) 8.5.5.3 Rest of ME&A Web Performance Market Size and Forecast, By Organization Size(2023-2030) 8.5.5.4 Rest of ME&A Web Performance Market Size and Forecast, By End-User(2023-2030) 9. South America Web Performance Market Size and Forecast by Segmentation (Value) (2023-2030) 9.1 South America Web Performance Market Size and Forecast, By Component(2023-2030) 9.2 South America Web Performance Market Size and Forecast, By Deployment (2023-2030) 9.3 South America Web Performance Market Size and Forecast, By Organization Size(2023-2030) 9.4 South America Web Performance Market Size and Forecast, By End-User(2023-2030) 9.5 South America Web Performance Market Size and Forecast, by Country (2023-2030) 9.5.1 Brazil 9.5.1.1 Brazil Web Performance Market Size and Forecast, By Component(2023-2030) 9.5.1.2 Brazil Web Performance Market Size and Forecast, By Deployment (2023-2030) 9.5.1.3 Brazil Web Performance Market Size and Forecast, By Organization Size(2023-2030) 9.5.1.4 Brazil Web Performance Market Size and Forecast, By End-User(2023-2030) 9.5.2 Argentina 9.5.2.1 Argentina Web Performance Market Size and Forecast, By Component(2023-2030) 9.5.2.2 Argentina Web Performance Market Size and Forecast, By Deployment (2023-2030) 9.5.2.3 Argentina Web Performance Market Size and Forecast, By Organization Size(2023-2030) 9.5.2.4 Argentina Web Performance Market Size and Forecast, By End-User(2023-2030) 9.5.3 Rest Of South America 9.5.3.1 Rest Of South America Web Performance Market Size and Forecast, By Component(2023-2030) 9.5.3.2 Rest Of South America Web Performance Market Size and Forecast, By Deployment (2023-2030) 9.5.3.3 Rest Of South America Web Performance Market Size and Forecast, By Organization Size(2023-2030) 9.5.3.4 Rest Of South America Web Performance Market Size and Forecast, By End-User(2023-2030) 10. Global Web Performance Market: Competitive Landscape 10.1 MMR Competition Matrix 10.2 Competitive Landscape 10.3 Key Players Benchmarking 10.3.1 Company Name 10.3.2 Product Segment 10.3.3 Industry Technology 10.3.4 Revenue (2023) 10.3.5 Manufacturing Locations 10.4 Market Analysis by Organized Players vs. Unorganized Players 10.4.1 Organized Players 10.4.2 Unorganized Players 10.5 Leading Web Performance Global Companies, by market capitalization 10.6 Market Structure 10.6.1 Market Leaders 10.6.2 Market Followers 10.6.3 Emerging Players 10.7 Mergers and Acquisitions Details 11. Company Profile: Key Players 11.1 IBM Corporation Armonk 11.1.1 Company Overview 11.1.2 Business Portfolio 11.1.3 Financial Overview 11.1.4 SWOT Analysis 11.1.5 Strategic Analysis 11.1.6 Scale of Operation (small, medium, and large) 11.1.7 Details on Partnership 11.1.8 Regulatory Accreditations and Certifications Received by Them 11.1.9 Awards Received by the Firm 11.1.10 Recent Developments 11.2 Akamai Technologies, Inc. 11.3 F5, Inc. 11.4 SolarWinds Worldwide, LLC 11.5 CA Technologies 11.6 Cavisson Systems Inc. 11.7 Cloudflare, Inc. 11.8 Splunk Inc. 11.9 SAS Institute Inc. 11.10 Teradata Corporation 11.11 WebTrends 11.12 Neustar 11.13 Google Mountain View 11.14 Adobe Systems 11.15 MicroStrategy Incorporated Tysons Corner 11.16 Micro Focus International 11.17 At InternetMérignac 11.18 CDNetworksSeoul 12. Key Findings 13. Industry Recommendations
  • INQUIRE BEFORE BUYING