
Third-party Logistics Market Size by End Use, Service, Transport, Region – Segment-Level Market Assessment, Growth Opportunity Analysis, Competitive Mapping & Forecast to 2035
Overview
What This Report Is — And Why It Exists
“Every competitor tells you the 3PL market is worth $1.6 trillion. This report tells you which $220 billion of it has no dominant player, runs 18–28% operating margins, and has a first-mover window that closes in 2028. That is the difference between a market report and an intelligence report.”
— Rucha Deshpande - MMR Lead Analyst — Global Supply Chain Intelligence Practice
| USD 1.6T Global 3PL Market 2025 |
USD 4.3T Projected 2035 | 10.1% CAGR |
55% Asset-Light Market Share (2025) |
17% Top-5 Players Combined Share |
| $342B+ Supply Chain Waste Destroyed/Year |
74% Shippers Would Switch 3PL for AI |
46% 3PLs Deployed AI Tools in 2025 |
2028 First-Mover Window Closes |
Third-party Logistics Market Key Highlights:
| Highlight 01 3PL Margin Intelligence Matrix Where margin actually lives |
Highlight 02 The Margin Migration Map Who wins, who gets squeezed |
Highlight 03 The 6 Dark Segments First-mover opportunity map |
Highlight 04 3PLI Conviction Scorecard Enter / Watch / Avoid |
| What This MMR 3PL Market Report Delivers |
| "$220B of that has zero dominant player, 18–28% margins, open contracts. This report maps exactly which 6 segments and when the window closes." |
| "Vietnam–China border: 19% CAGR, zero Tier-1 presence. India Tier-2: logistics cost gap worth $XX billion. Enter before 2027." |
| "DSV acquired DB Schenker for $15.8 billion (April 2025). They look inward until 2028. That is your strategic entry window." |
| "74% of shippers would switch 3PL for AI (NTT DATA, 2025). Platform owning shipper behavioral data owns the contract renewal." |
| "$342B destroyed annually. A 500-truck fleet cutting dead miles from 31% to 18% via AI dispatch gains $8.4M/year. Zero new trucks." |
01 | THE GLOBAL 3PL MARKET INFLECTION POINT
01 | The Global 3PL Market Inflection Point
The Global Third-Party Logistics Market is not an outsourced transport category — it is the operational intelligence infrastructure of the global economy. Every product sold online, every pharmaceutical delivered cold, every EV battery shipped across continents — has a 3PL network, a data layer, and a cost architecture behind it. When that infrastructure is intelligent, companies win market share. When it is not, they bleed margin invisibly.
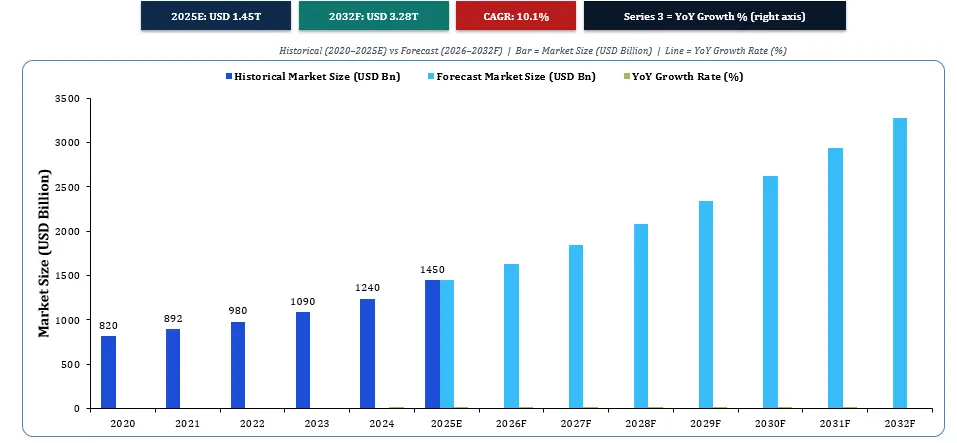
According to Maximize Market Research (MMR), the global 3PL market was valued at USD 1.6 Trillion in 2025 and is projected to reach USD 4.3 Trillion by 2035, growing at a CAGR of 10.1% (2025–2035). This growth is not volume-led. It is driven by a structural realignment of who controls supply chain data, who owns the last-mile relationship, and where the margin pools are permanently migrating.
Three Forces Permanently Redrawing the 3PL Landscape
1. Manufacturing geography is being redrawn by nearshoring, China+1, and PLI schemes — creating freight corridors that barely existed five years ago.
2. Digital freight platforms are crossing from experimental to structural — AI matching and real-time visibility are now contract requirements, not differentiators.
3. Supply chain sovereignty has become a board-level priority — driving outsourcing decisions previously managed in-house, at scale, across every industry.
This report is designed for: logistics investors seeking asymmetric 3PL opportunities; Fortune 500 supply chain executives benchmarking outsourcing strategy; 3PL operators identifying where to deploy technology capital; PE firms evaluating logistics platform investments; and e-commerce, pharma, and EV manufacturers requiring specialized 3PL intelligence.
Global 3PL Market Size & Forecast | 2020–2032
To know about the Research Methodology:- Request Free Sample Report
02 | THE $342 BILLION SUPPLY CHAIN WASTE PROBLEM IN 3PL INDUSTRY
02 | The $342 Billion Supply Chain Waste Problem In 3PL Industry
One in every four logistics decisions globally is suboptimal. Supply chain inefficiency — empty truck miles, unmanaged tail spend, out-of-policy procurement, poor inventory positioning, and manual freight reconciliation — destroys over $342 billion in value annually. It has a map, a source, and a solution. The 3PL that solves it first owns the enterprise relationship for the next decade.
The Arithmetic That Changes Every Board Conversation
A Fortune 500 company. $80M annual logistics spend. 38% running unmanaged. Switch to AI-managed 3PL: 20–30% cost reduction = $6.1–9.1M saved annually. A 500-truck 3PL fleet on India’s Golden Quadrilateral — 31% empty-mile rate. Reduce to 18% using AI dispatch (payback: 8 months): Annual operating gain = $8.4M. Zero new trucks. Zero new drivers. Zero new infrastructure. Just the elimination of waste that was always there — now made visible.
| Waste Category | Annual Destruction | Primary Cause | Technology Fix | ROI Timeline |
| Empty / Dead Miles | ~$120B | No backhaul visibility, fragmented load matching | AI freight matching (Uber Freight: 22.6% reduction) | 6–8 months |
| Unmanaged Tail Spend | ~$85B | No policy enforcement on SME + spot procurement | SaaS-priced managed 3PL platforms | 3–6 months |
| Inventory Misalignment | ~$75B | Poor demand forecasting | AI predictive inventory (15–20% improvement) | 12–18 months |
| Manual Freight Reconciliation | ~$40B | Paper-based, ERP-disconnected billing | Automated reconciliation + ERP sync | Immediate |
| Reverse Logistics Leakage | ~$22B | No structured returns infrastructure | Dedicated reverse 3PL platform | 6–12 months |
03 | FRAMEWORK I — THE 3PL Market MARGIN INTELLIGENCE MATRIX
03 | Framework I — The 3PL Market Margin Intelligence Matrix
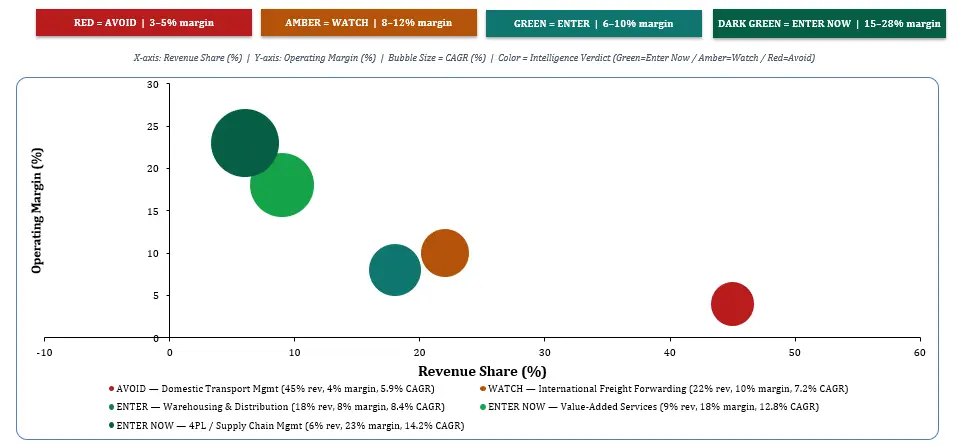
The Margin Intelligence Matrix synthesizes five dimensions for each 3PL segment: revenue volume, operating margin, growth trajectory, competitive density, and technology penetration. The result: not where the market is largest — but where the smartest capital goes.
| Segment | Revenue Share | Op. Margin | CAGR | Comp. Density | Intelligence Verdict |
| Domestic Transport Mgmt | ~45% | 3–5% | 5.9% | Very High | AVOID — Margin crushed by digital brokers |
| International Forwarding | ~22% | 8–12% | 7.2% | High | WATCH — DSV integration gap = tactical window |
| Warehousing & Distribution | ~18% | 6–10% | 8.4% | Medium | ENTER — Automation upside, 17.7% robotics CAGR |
| Value-Added Services (VAS) | ~9% | 15–22% | 12.8% | Low | ENTER NOW — Fastest margin growth |
| 4PL / Supply Chain Mgmt | ~6% | 18–28% | 14.2% | Very Low | ENTER NOW — Highest margin, first-mover open |
3PL Segment Intelligence Matrix | Revenue Share vs Operating Margin
04 | FRAMEWORK II — THE MARGIN MIGRATION MAP OF 3PL MARKET
04 | Framework II — The Margin Migration Map Of 3PL Market
Value in the 3PL market is not static. It migrates — and 2025–2032 will be the most consequential migration in logistics history. The 3PL that cannot demonstrate AI capability, real-time visibility, and predictive analytics loses the RFP before the pricing conversation begins.
| FROM (2019–2023) | SHIFT | TO (2024–2032) | Margin Impact |
| Trip volume / tonnage moved | ➡ | Intelligence per shipment | 3–5% → 18–28% |
| Asset ownership (trucks, warehouses) | ➡ | Data ownership (visibility, prediction) | Capex → recurring margin |
| Transactional 3PL relationships | ➡ | Strategic supply chain partnerships | Renewal risk eliminated |
| Manual dispatching and routing | ➡ | AI-native freight matching | +15–20% cost reduction |
| Cost-center logistics management | ➡ | Revenue-linked supply chain strategy | New pricing models unlock |
| Commodity margins (3–5%) | ➡ | Platform and VAS margins (15–28%) | 5× margin expansion possible |
“Kuehne+Nagel does not compete with Flexport. Flexport competes with data. The carrier that owns the behavioral data of a shipper — booking patterns, demand cycles, supply chain vulnerabilities — owns the contract renewal. Platform-first 3PLs grow at 3× the rate of asset-heavy incumbents.”
— MMR Intelligence Analysis, 2025
05 | DROCT FRAMEWORK OF 3PL MARKET — STRATEGIC MARKET FORCES
05 | DROCT Framework of 3PL Market — Strategic Market Forces
| Dimension | Key Forces | Market Impact |
| DRIVERS | E-commerce explosion; nearshoring & China+1 manufacturing migration; pharmaceutical cold chain demand; EV & semiconductor supply chain complexity; SME logistics outsourcing acceleration; PLI scheme manufacturing growth across India, Vietnam, Mexico | Very High |
| RESTRAINTS | Freight rate volatility cycles; fuel cost inflation; Red Sea / Taiwan Strait geopolitical disruption; specialized talent shortage; last-mile regulatory fragmentation across jurisdictions | High |
| OPPORTUNITIES | AI-driven cost optimization (15–20% savings achievable); $220B+ SME managed logistics untapped; APAC volume growth; ESG-compliant cold chain premium pricing; 4PL model adoption acceleration; India DFC corridors opening | Very High |
| CHALLENGES | Fragmented technology stacks across 3PL networks; Tier-2/3 market last-mile complexity; reverse logistics infrastructure gaps; cross-border regulatory compliance burden; talent gap in specialized verticals | Medium-High |
| TRENDS | AI-native platforms; autonomous warehouse robotics ($9.33B → $21.08B by 2030 at 17.7% CAGR); Robots-as-a-Service (RaaS); ESG Scope 3 reporting mandates; control tower logistics; nearshoring corridor creation | Transformative |
06 | 3PL MARKET TECHNOLOGY DISRUPTION — THREE WAVES, ONE STRATEGIC SEQUENCE
06 |3PL Market Technology Disruption — Three Waves, One Strategic Sequence
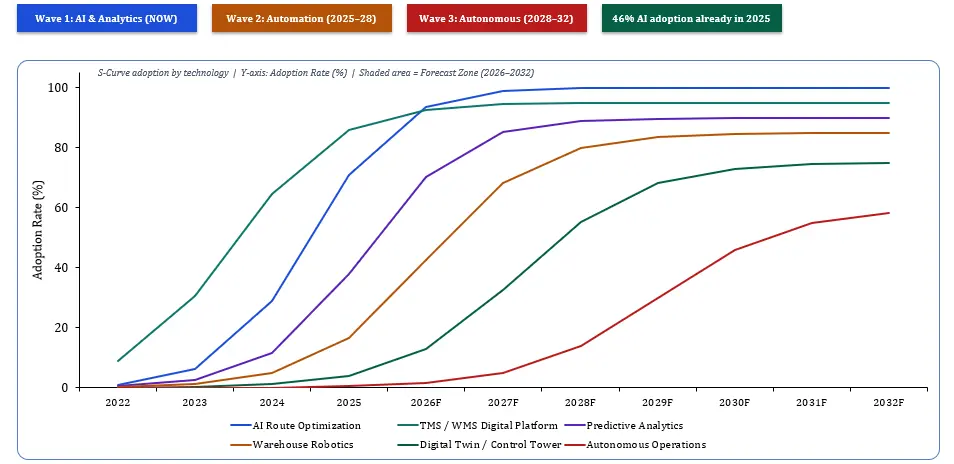
74% of shippers say they would switch their 3PL provider based on AI capabilities (NTT DATA + Penn State University, 2025). 46% of 3PLs deployed AI tools in 2025 — a rate that accelerated faster than any analyst predicted. Technology is no longer a 3PL feature. It is the primary determinant of contract outcomes.
| Wave | Timeline | Core Capability | Company Examples | ROI |
| Wave 1: AI Freight Matching | NOW (2024–2026) | Route optimization, demand forecasting, 46% of 3PLs deployed in 2025 | Uber Freight (22.6% deadhead cut), C.H. Robinson NAVISPHERE, GoComet, Loadsmart | Payback: 6–8 months | +15–20% cost reduction |
| Wave 2: Warehouse Automation | 2025–2028 | AMRs, AS/RS, collaborative robots. Market: $9.33B → $21.08B by 2030 (17.7% CAGR). RaaS eliminates capex barrier | Geek+, AutoStore, GreyOrange, Locus Robotics, Mujin | Payback: 12–24 months | +20–30% labor cost reduction |
| Wave 3: Autonomous Networks | 2028–2032 | Digital twins, self-optimizing distribution, autonomous cross-dock. The AI data layer built today is the infrastructure autonomous networks run on tomorrow | DHL SmartWarehouse, Maersk TradeLens 2.0, JD Logistics | Payback: 3–5 years | +8–15% net margin improvement |
3PL Technology Adoption Maturity Curve | 2022–2032
07 | 3PL MARKET REGIONAL POWER DYNAMICS — SIX REGIONS, ONE INTELLIGENCE FRAMEWORK
07 | 3PL Market Regional Power Dynamics — Six Regions, One Intelligence Framework
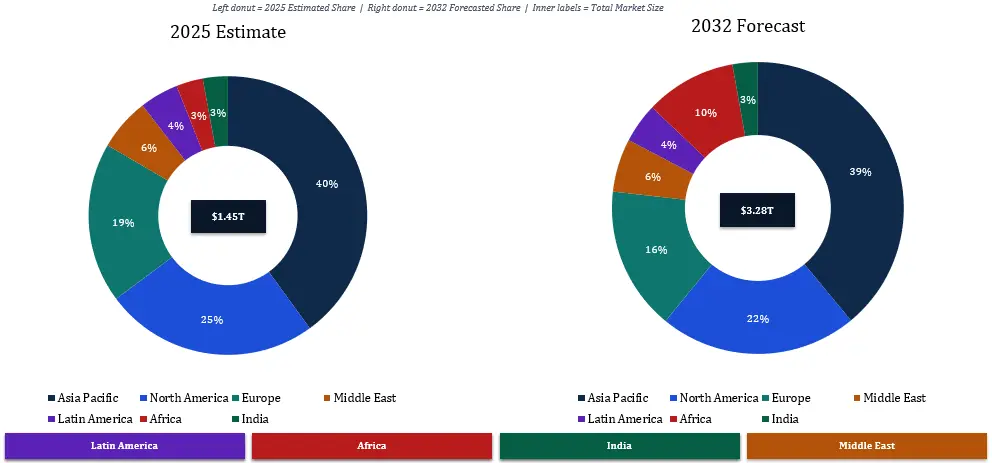
| Region | 2025E | CAGR | Strategic Role | The One Insight |
| Asia Pacific | $580B | 12.0% | Volume Engine | Manufacturing is moving. Freight capacity is not following. Vietnam–China border: 19% CAGR, zero Tier-1 player present today. |
| North America | $360B | 10.4% | Platform War Theater | US platform war (C.H. Robinson vs Flexport vs Uber Freight) sets global tech standards. Mexico nearshoring adds $XX Bn by 2032. |
| Europe | $270B | 9.8% | Regulation Market | CSRD forces Scope 3. DSV+Schenker integration = 2–3 year window for mid-market 3PLs to win enterprise accounts. |
| India | $42B | 11.4% | Highest-Beta Play | Logistics cost 13–14% of GDP vs 8–10% in developed markets. DFC operational. Structural opportunity: $XX Bn. |
| Middle East | $88B | 12.0% | Transit Hub | UAE + Saudi Vision 2030 + IMEC corridor activating. Phase 1 commercial traffic: 2025–2026. Zero Tier-1 positioned. |
| Africa | $45B | 15.1% | First-Mover Frontier | 38% empty-mile rate. Agricultural backhaul unmanaged. DRC mineral corridor = $24T resource base. First organized 3PL wins. |
Regional 3PL Market Size & CAGR | 2025E vs 2032F (USD Billion)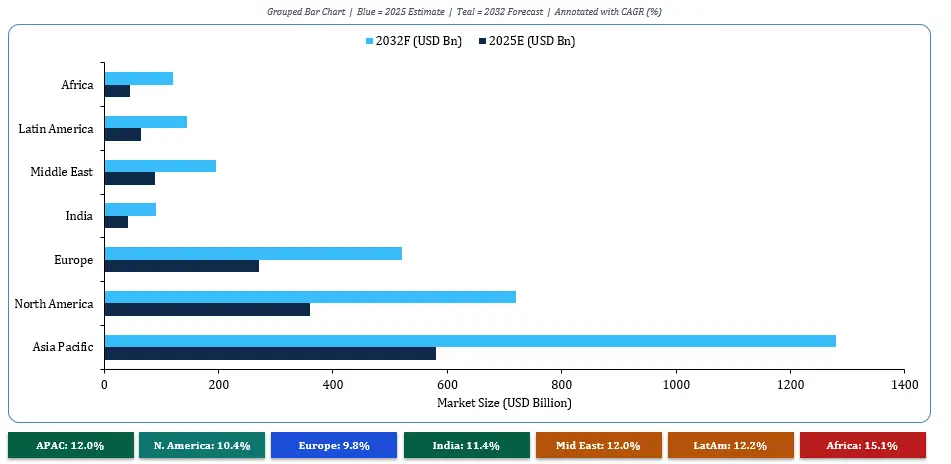
Regional 3PL Market Size & CAGR | 2025E vs 2032F (USD Billion) | Annotated with YoY CAGR %
08 | THE GEOPOLITICAL SUPPLY CHAIN
08 | The Geopolitical Supply Chain
The Red Sea disruption rerouted $400 billion of ocean freight in 90 days and drove a 350% surge in Asia–Europe container rates. The next disruption arrives by land. The 3PLs that benefit are already identifiable. Russia sanctions created the Central Asia BRI Middle Corridor virtually overnight: 200% YoY truck growth. 450% cargo value growth. One geopolitical event. One entirely new freight corridor. The 3PL positioned in advance captured the rate. Late arrivals competed on price.
| Geopolitical Trigger | 3PL Impact | Corridor Created | First-Mover Advantage |
| Red Sea Houthi Crisis (2024–ongoing) | $400B rerouted. Air freight +350%. Overland MENA demand surge. | Cape of Good Hope; overland MENA corridors | 3PLs with MENA land networks captured 40–60% rate premiums |
| US–China Trade War & China+1 | $170B US manufacturing committed to Mexico. Vietnam electronics +19% YoY. | Mexico Bajío–Laredo (31% CAGR); Vietnam–China (16.8% margin) | Early-entry 3PLs locked 5-year shipper contracts before capacity hit |
| Taiwan Strait Contingency | Strait disruption overflows ASEAN road capacity overnight. | ASEAN North–South corridor; Vietnam overland nodes | 3PLs pre-positioned capture peak rates on Day 1 of disruption |
| India IMEC Corridor (G20) | Phase 1 commercial traffic 2025–2026. Zero Tier-1 3PL present. | India–UAE IMEC: $28B opportunity, 45% CAGR, 17.6% margin | Window: NOW. Contracts at Mundra and Dubai LC available. |
09 | FRAMEWORK III — THE 6 DARK SEGMENTS
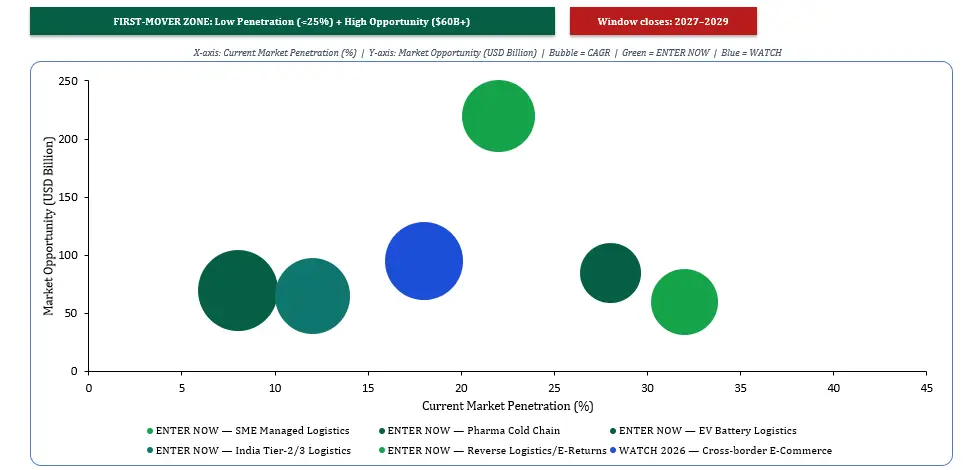
09 | Framework III — The 6 Dark Segments: First-Mover Intelligence
Six 3PL segments will rank among the highest-growth, highest-margin opportunities by 2030. Combined: USD $220+ billion growing at 15–45% per year. Institutional 3PL capital positioned today: essentially zero.
Each segment shares four signals: demand growing faster than 15% annually, zero dominant player above 10% market share, technology infrastructure running ahead of service supply, digital penetration below 20%.
| Segment | CAGR | Margin | Opportunity | Why Act Now — The One Reason |
| SME Managed Logistics | XX% | 18–25% | $220B+ | XX% of global 3PL spend is SME, <25% managed. Zero product-market-fit solution at scale exists. First SaaS-priced 3PL wins the category. |
| Pharma Cold Chain | XX% | 20–28% | $XX Bn | Biosimilars + mRNA + WHO mandates = structurally locked demand to 2035. GDP/GMP capability = pricing moat. |
| EV Battery Logistics | XX% | 15–22% | $XX Bn | Class 9 hazmat + temperature control. No scale 3PL player exists globally. EV production commitment: $500B+. |
| India Tier-2/3 Logistics | XX% | XX% | $XX Bn | Largest unmanaged freight volume in any single country. DFC operational. GST normalized. Organized players: near zero. |
| Reverse Logistics / E-Returns | XX% | 14–20% | $XX Bn | E-commerce return rates 25–40%. Returns cost = 7% of gross enterprise sales. Zero mature reverse 3PL at scale. |
| Cross-border E-Commerce | 30% YoY | XX% | $XX Bn | APAC cross-border growing 30% YoY. No integrated customs + fulfillment + last-mile platform exists globally. |
The First-Mover Window: 2025 to 2028
DSV completed the $15.8B acquisition of DB Schenker in April 2025. DHL, Maersk, and Kuehne+Nagel are all integrating major deals — looking inward until 2028. Every dark segment above is structurally open. After 2028, first-mover positions will be filled. The contracts signed in the next 36 months will determine competitive advantage for the following decade.
The 6 Dark Segments | Opportunity vs Penetration Map (Framework III)
10 | COMPETITIVE LANDSCAPE & M&A INTELLIGENCE
10 | Competitive Landscape — Market Structure & M&A Intelligence
Top 5 players hold only 17% combined market share — making 3PL the most fragmented major B2B service market globally. This fragmentation is not a weakness. It is the structural source of the first-mover opportunity.
| Player | HQ | Rev 2025E | Strength | Vulnerability | 2028 Verdict |
| DHL Supply Chain & Forwarding | Germany | USD XX Bn | Global network, brand, full-service depth | Legacy tech, integration complexity | Must tech-transform or lose margin |
| Kuehne+Nagel International AG | Switzerland | USD XX Bn | Asset-light, digital investments, ocean scale | DSV scale pressure post-2025 | Defend + specialize (pharma/chemical) |
| DSV A/S (incl. DB Schenker) | Denmark | EUR 45B+ est. | Consolidated scale post-$15.8B acquisition | Integration risk 2025–2028 | ENTRY WINDOW OPEN for competitors |
| C.H. Robinson Worldwide | USA | USD XX Bn | AI invest, carrier data, NAVISPHERE platform | Digital broker margin pressure | Tech-first or market-share loss 2027 |
| XPO / GXO / RXO | USA | USD XX Bn | Asset+network, LTL North America dominance | Geographic concentration | Strong regionally, limited global scope |
| CEVA Logistics (CMA CGM) | France | USD XX Bn | End-to-end vision, ocean parent synergy | Ocean dependency, margin dilution | Vertical integration bet: high risk/reward |
| Maersk Logistics | Denmark | USD XX Bn | Supply chain management, end-to-end bold vision | Margin dilution from logistics vs shipping | Boldest strategic bet in 3PL today |
| Geodis (SNCF Group) | France | EUR XX Bn | European multimodal depth, APAC expansion | Limited digital freight capabilities | Strong Europe + India; tech gap exploitable |
| Flexport | USA | USD XX Bn | Tech-native, UX-first, shipper behavioral data | Profitability pressure, enterprise gaps | Platform architecture of the future |
| Nippon Express Holdings | Japan | JPY XX Bn | APAC depth, automotive + pharma strength | Digital transformation pace | Dominant Japan; SE Asia expansion |
M&A Intelligence: Deals That Reshape the Market
| Deal | Date | Value | Strategic Signal |
| DSV acquires DB Schenker | April 2025 | $15.8B | Creates top-3 global player. Integration focus = 2–3 year competitor window. |
| CMA CGM acquires CEVA + Bolloré | Ongoing | $XX Bn | Shipping giant vertically integrating. Traditional forwarders at structural risk. |
| Maersk acquires Grindrod Logistics | 2024 | Undisclosed | End-to-end Africa play. East Africa 3PL land-grab begins. |
| Amazon Logistics in-house expansion | 2024–2025 | $XX Bn capex | In-house 3PL for sellers. SME market structural threat to traditional 3PLs. |
| PE: Sennder, GoComet, Lori Systems | 2024–2025 | $XX Bn total | Land-grab in underpenetrated corridors. Digital 3PL is the new real estate. |
11 | INDIA — THE ASYMMETRIC 3PL INVESTMENT THESIS
11 | India: The Asymmetric 3PL Investment Thesis
India warrants its own strategic thesis. Logistics cost as % of GDP: 13–14% (developed world: 8–10%). This gap is not a problem — it is a $XX billion structural opportunity that will be monetized over the next decade by the 3PLs who enter before the infrastructure is complete. India 3PL market: USD 38–40B in 2025 → USD 78B by 2035 (7.3% CAGR), with XX% still unorganized.
| Catalyst | Status | 3PL Opportunity | Entry Window |
| Dedicated Freight Corridors (DFC) | EDFC + WDFC operational. Connecting manufacturing to ports at 1/3 road cost. | Corridor warehousing, multi-modal 3PL, ICD/CFS plays | NOW — land parcels available |
| PM Gati Shakti Master Plan | $26B infrastructure committed. 400+ projects mapped and funded. | Greenfield warehouse development, Tier-2 distribution centers | NOW — maximum policy tailwind |
| Pharma Cold Chain Gap | India: 25% of required capacity. Growing 25% YoY demand. | Temperature-controlled 3PL: pharma + FMCG + agri | ENTER NOW — $XX Bn TAM by 2030 |
| E-Commerce Tier-2/3 Surge | India e-commerce → $300 Bn by 2030 (5× growth). Tier-2 city orders: 58% of total. | Last-mile 3PL, returns infrastructure, Tier-2 dark stores | 2025–2027 critical window |
| EV Manufacturing PLI Scheme | $XX Bn committed. Tata, Maruti, Hyundai, Ola building EV plants across India. | Battery logistics, component inbound 3PL, EV spare-parts distribution | Nascent — first-mover advantage significant |
12 | FRAMEWORK IV — THE 3PLI CONVICTION SCORECARD
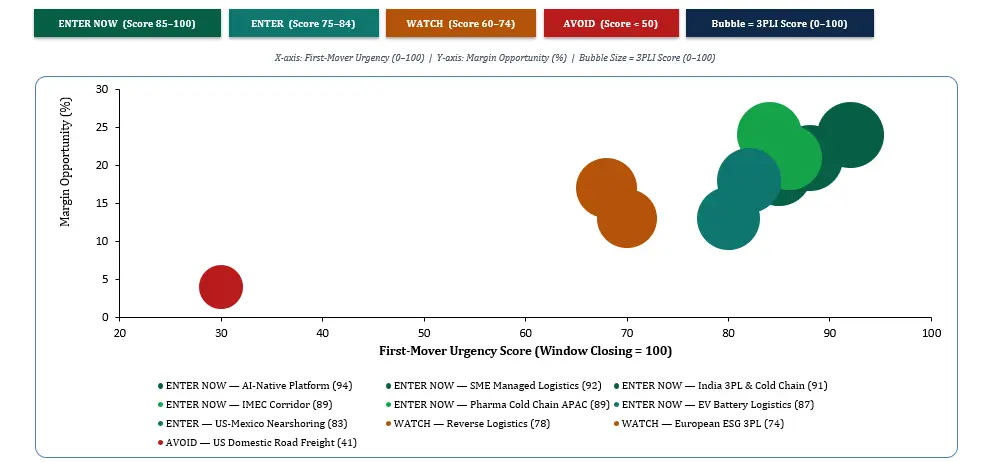
12 | Framework IV — The 3PLI Conviction Scorecard
Every segment and geography receives a 3PLI Conviction Score — synthesizing margin opportunity, first-mover window, competitive density, technology readiness, and geopolitical stability — mapped to: Enter Now, Watch for Trigger, or Avoid.
| Opportunity | 3PLI Score | Margin | Window | Capital | Verdict |
| AI-Native 3PL Platform Build | 94/100 | 20%+ | Closes 2026 | High | ENTER NOW — CRITICAL |
| SME Managed Logistics Platform | 92/100 | 18–25% | Closes 2027 | Medium | ENTER NOW |
| India 3PL & Cold Chain | 91/100 | 15–20% | Closes 2028 | High | ENTER NOW |
| India IMEC Corridor | 89/100 | 17–25% | Closes 2027 | High | ENTER NOW |
| Pharma Cold Chain APAC | 89/100 | 20–28% | Closes 2027 | Med-High | ENTER NOW |
| EV Battery Logistics | 87/100 | 15–22% | Closes 2028 | Medium | ENTER NOW |
| US–Mexico Nearshoring 3PL | 83/100 | 11–16% | Closes 2027 | Med-High | ENTER NOW |
| Reverse Logistics Technology | 78/100 | 14–20% | Closes 2029 | Medium | WATCH |
| European ESG-Led 3PL | 74/100 | 10–15% | Closing 2027 | Low-Med | WATCH |
| US/EU Domestic Road Freight | 41/100 | 3–5% | Saturated | Any | AVOID |
3PLI Conviction Scorecard | Enter / Watch / Avoid Quadrant (Framework IV)
13 | KEY MARKET PLAYERS — GLOBAL 3PL ECOSYSTEM (70 PLAYERS, 5 TIERS)
13 | Key Market Players — 70 Players Across 5 Tiers
The global 3PL market comprises five player tiers: Global Giants commanding end-to-end supply chain management; Regional Champions with network depth in specific geographies; Digital Disruptors building platform-first freight intelligence; India-Specific Players capitalizing on the fastest-growing organized logistics market; and Niche Specialists capturing high-margin vertical opportunities.
Third-Party Logistics Market Scope: Inquire before buying
TIER I — Global Giants (10 Players)
| Sr. No. | Company | HQ | Core Strength | 2025 Market Position |
| 1 | DHL Supply Chain & Global Forwarding | Germany | Full-service, pharma, automotive, e-commerce depth | Market leader by revenue; aggressive tech investment |
| 2 | Kuehne+Nagel International AG | Switzerland | Ocean forwarding, contract logistics, asset-light model | Asset-light pioneer; strongest digital 3PL transformation |
| 3 | DSV A/S (incl. DB Schenker post-April 2025) | Denmark | Post-merger scale; €45B+ combined revenues | Now #2 globally; integration focus 2025–2028 |
| 4 | C.H. Robinson Worldwide | USA | AI freight brokerage, NAVISPHERE platform, carrier data | Platform war frontline; aggressive AI investments |
| 5 | XPO Logistics | USA | LTL freight, last-mile, North America trucking dominance | Spun off GXO + RXO; focused North America strategy |
| 6 | GXO Logistics (XPO spinoff) | USA | Pure-play tech-led warehouse outsourcing globally | Largest pure-play contract warehousing company globally |
| 7 | CEVA Logistics (CMA CGM Group) | France | Contract logistics, freight management, ocean integration | Vertically integrating with CMA CGM ocean network |
| 8 | Maersk Logistics | Denmark | End-to-end supply chain, ocean-to-land integration vision | Boldest vertical integration bet in 3PL today |
| 9 | Geodis (SNCF Group) | France | European multimodal, APAC, contract logistics network | Strong Europe + India; DSV integration creates opportunity |
| 10 | Nippon Express Holdings | Japan | APAC depth, automotive precision, pharma cold chain | Dominant Japan; aggressive SE Asia + India expansion |
TIER II — Regional Champions (20 Players)
| Sr. No. | Company | HQ | Core Geography | Strategic Strength |
| 11 | Kerry Logistics Network | Hong Kong | APAC, SE Asia, cross-border | ASEAN + India last-mile; IMEC corridor play |
| 12 | Agility Logistics (GLP) | Kuwait | MENA, Africa, South Asia | Best MENA first-mover; Government logistics contracts |
| 13 | Yusen Logistics (NYK Group) | Japan | APAC, Americas, Europe | Automotive + healthcare expertise; Japan precision |
| 14 | Kintetsu World Express | Japan | APAC air freight + forwarding | Hi-tech + pharma cold chain specialist |
| 15 | Rhenus Logistics | Germany | Europe, Americas, APAC | Port logistics + contract logistics; SME 3PL strength |
| 16 | Hellmann Worldwide Logistics | Germany | Europe, Africa, Americas | Family-owned sustainability leader; niche specialist |
| 17 | Dachser | Germany | European road + air + sea | Technology platform investment; premium service quality |
| 18 | Bolloré Logistics (CMA CGM) | France | Africa, MENA, APAC | Dominant Africa logistics; absorbed into CMA CGM |
| 19 | Pantos Logistics (LG Group) | South Korea | Korea, SE Asia, Americas | Electronics supply chain; LG Group captive 3PL |
| 20 | Ryder System | USA | North America contract logistics | Asset management + fleet solutions + last mile |
| 21 | Echo Global Logistics | USA | USA freight brokerage | Mid-market shipper focus; TMS-led brokerage |
| 22 | Total Quality Logistics (TQL) | USA | USA + Mexico brokerage | Volume play; rapid technology investment |
| 23 | ID Logistics | France | Europe contract logistics + pharma | Fast-growing EU pure-play 3PL; omnichannel expert |
| 24 | Wincanton | UK | UK logistics, e-commerce, defense | Specialized UK + Ireland coverage; government contracts |
| 25 | Fiege Group | Germany | Europe, APAC, fashion logistics | Omnichannel + fashion + pharma; family-owned agility |
| 26 | Logwin AG | Luxembourg | Europe, APAC, Americas | Air + sea + solutions 3PL; mid-market strength |
| 27 | AIT Worldwide Logistics | USA | Global specialty freight | Life sciences + high-value freight; regulated industries |
| 28 | Sinotrans | China | China + global forwarding | State-owned; dominant China domestic 3PL player |
| 29 | SF Holdings (SF Express) | China | China + APAC, cross-border B2C | Tech-native China logistics giant; fastest-growing APAC |
| 30 | Kerry TJ Logistics | China | China domestic + Hong Kong | JV: Kerry Logistics + Tianjin International; B2B depth |
TIER III — Digital Disruptors & Platform-First 3PLs (15 Players)
| Sr. No. | Company | HQ | Core Disruption | Threat Level |
| 31 | Flexport | USA | Digital freight forwarding + full supply chain platform | AI-native visibility; shipper behavioral data moat |
| 32 | Uber Freight | USA | AI freight matching + massive carrier network | 22.6% deadhead reduction; margin pressure on incumbents |
| 33 | Convoy (acq. Flexport) | USA | Automated full truckload brokerage platform | Fleet-scale AI dispatch; asset-light FTL disruption |
| 34 | Transfix | USA | AI-powered freight matching platform | Real-time pricing + predictive matching for shippers |
| 35 | Loadsmart | USA | Digital freight brokerage + API-first model | Enterprise API integrations; instant quoting platform |
| 36 | Sennder | Germany | Digital European road freight platform | EU platform; DHL co-development partnership in place |
| 37 | GoComet | India | AI-powered freight management SaaS platform | India + global mid-market disruption; 2,500+ shippers |
| 38 | Lori Systems | Kenya | Digital trucking + freight marketplace Africa | Largest digital freight platform in Sub-Saharan Africa |
| 39 | CargoX | Brazil | Digital freight marketplace Brazil | Dominant Brazil digital freight; fastest-growing LatAm |
| 40 | Freightos | Israel / USA | Digital freight rate marketplace | B2B freight procurement platform; rate transparency |
| 41 | project44 | USA | Real-time supply chain visibility platform | Visibility SaaS displacing 3PL data layer entirely |
| 42 | FourKites | USA | AI-powered supply chain visibility + ETA prediction | Predictive ETA; Fortune 500 shipper lock-in at scale |
| 43 | Next Trucking | USA | Digital drayage + intermodal optimization | Port drayage AI dispatch; container visibility |
| 44 | RXO (XPO spinoff) | USA | Tech-enabled freight brokerage marketplace | Platform model: AI + carrier marketplace combined |
| 45 | Stord | USA | Cloud supply chain + fulfillment network | DTC brand fulfillment + SaaS pricing model disruption |
TIER IV — India-Specific 3PL Players (10 Players)
| Sr. No. | Company | HQ | Specialty | Market Position |
| 46 | Mahindra Logistics | Mumbai | Contract logistics, mobility, supply chain management | Listed; fastest-growing India 3PL by revenue |
| 47 | Delhivery | Gurugram | E-commerce express, B2B freight, cross-border logistics | India’s largest listed logistics platform; AI-native |
| 48 | TVS Supply Chain Solutions | Chennai | Auto, industrial, consumer logistics, warehousing | Listed; strong automotive + manufacturing 3PL depth |
| 49 | Blue Dart Express (DHL) | Mumbai | Express freight + cold chain + B2B freight delivery | Premium express leader; DHL network integration |
| 50 | Gati Limited (Allcargo) | Hyderabad | Surface express + e-fulfillment + B2B freight | B2B express pioneer; Allcargo Group ownership |
| 51 | Xpressbees | Pune | E-commerce last-mile + reverse logistics platform | Fast-growing D2C + marketplace logistics specialist |
| 52 | Ecom Express | Gurugram | E-commerce delivery + Tier-2/3 city last-mile | Tier-2/3 city depth; returns infrastructure strength |
| 53 | DTDC Express | Bengaluru | Express freight + franchise network + e-commerce | Pan-India franchise network; 10,500+ PIN codes |
| 54 | Allcargo Logistics | Mumbai | Multimodal logistics, LCL freight, contract logistics | LCL market leader India; global forwarding capabilities |
| 55 | Future Supply Chain Solutions | Mumbai | Warehouse management + cold chain + fulfillment | Organized cold chain + fashion + FMCG logistics |
TIER V — Niche Specialists & High-Margin Verticals (15 Players)
| Sr. No. | Company | HQ | Vertical Niche | Margin Moat |
| 56 | Lineage Logistics | USA | Cold chain warehousing + temperature-controlled REIT | Largest temp-controlled REIT-backed 3PL globally |
| 57 | Americold Realty Trust | USA | Cold chain warehousing; pharma + food cold chain | Listed cold chain REIT; structurally locked demand |
| 58 | BDP International | USA | Chemical + energy logistics; hazmat specialist | Hazmat + regulatory compliance = pricing moat |
| 59 | VersaCold Logistics | Canada | Cold chain logistics Canada-wide network | Canadian cold chain market leader; pharma strength |
| 60 | Reverse Logistics Group (RLG) | Netherlands | Reverse logistics + WEEE compliance EU | EU e-waste + returns specialist; regulatory tailwind |
| 61 | DHL Life Sciences & Healthcare | Germany | Pharma cold chain + clinical trials logistics | GDP-compliant global pharma 3PL; pricing premium 20%+ |
| 62 | JD Logistics | China | Tech-native 3PL + B2C e-commerce fulfillment | China B2C + Southeast Asia expansion; robotics leader |
| 63 | Cainiao (Alibaba Logistics) | China | Cross-border e-commerce fulfillment + GFCs | Alibaba logistics arm; Global Fulfillment Centers |
| 64 | Meyer & Meyer Logistics | Germany | Fashion + retail + luxury logistics Europe | White-glove + omnichannel fashion 3PL; premium niche |
| 65 | Ryder Last Mile | USA | Last-mile + big & bulky home delivery | Home delivery specialist: furniture + appliances + EV |
| 66 | ModusLink Global Solutions | USA | Supply chain services + electronics assembly | High-mix low-volume electronics 3PL; Asia network |
| 67 | Transplace (Uber Freight acq.) | USA | Managed transportation + TMS platform | TMS-led managed 3PL; acquired by Uber Freight 2021 |
| 68 | Imperial Logistics (DP World) | South Africa | Sub-Saharan Africa logistics + ports | Africa specialist; DP World integration adds scale |
| 69 | Radiant Logistics | Canada | Non-asset international freight + TMS | Mid-market forwarding + TMS; Canada + US coverage |
| 70 | ID Fresh (Specialized India) | India | FMCG fresh food logistics + cold chain India | Fastest-growing fresh food cold chain specialist India |
14 | THE STRATEGIC NARRATIVE
14 | The Strategic Narrative
The global 3PL industry is undergoing four simultaneous structural shifts. The companies that understand all four — together — will own the next decade of logistics economics.
Manufacturing geography is being permanently redrawn. $170 billion of US-linked production has committed to Mexico. Vietnam’s electronics output grows at 19% annually. India has committed $26 billion in PLI schemes. Morocco is the EU’s emerging manufacturing base. Every relocation creates a 3PL corridor that barely existed five years ago. The logistics companies who mapped this geography in advance own the lane. Those who wait arrive after first-mover contracts have been signed for five years.
The digital freight layer is crossing the threshold from experimental to structural. AI matching penetration is above 60% in developed market corridors and below 15% in every dark segment identified in this report. This gap is simultaneously the largest inefficiency pool ($342 billion in annual waste) and the largest investment opportunity in global logistics. The freight tech companies building platforms on underserved segments are not software businesses. They are land-grabs in the geography of global commerce.
Supply chain sovereignty has become a board-level imperative. COVID, the Red Sea crisis, and Russia sanctions taught every Fortune 500 CEO that single-source supply chains are existential risks. The 3PL offering resilience, visibility, and compliance across multiple geographies is no longer competing for a logistics contract. It is competing for a risk management mandate. Those are different conversations, with different budget owners, and different price points.
The data moat is replacing the asset moat. In every previous logistics cycle, scale was the competitive barrier. In this cycle, data is the barrier. The 3PL that owns the behavioral data of a shipper — booking patterns, demand cycles, supply chain vulnerabilities — owns the contract renewal. Asset-heavy incumbents cannot replicate this. Platform-first disruptors are building it at freight broker margins, then locking in enterprise relationships at managed logistics pricing.
Seven Strategic Takeaways
• 3PL demand is structurally guaranteed — but margin migrates toward intelligence, data, and technology capability. Volume is not the prize. Intelligence is.
• The 17% combined market share of the top 5 players means 83% of the market is contestable. No single player has locked the 3PL industry.
• AI-native platforms will capture value from traditional asset-heavy 3PLs over the next three years — the consolidation is structural and irreversible.
• APAC adds more absolute opportunity by 2032 than any other region. India is where the highest-beta entry points exist — logistics cost gap = structural investment thesis.
• ESG compliance creates premium pricing power for certified operators — eliminating non-compliant competitors from enterprise RFPs entirely.
• The first-mover window across 6 dark segments closes 2027–2029. Capital deployed now captures structural advantage. Capital deployed after 2028 competes on price.
• The 3PL market is not becoming more competitive. It is becoming more intelligent. Scale was the moat. Data is the moat now.
| MMR ANALYST WORD “The 3PL intelligence code is not complicated once you know how to read it. High-margin segment. Low competitive density. Technology infrastructure ahead of service supply. First-mover contracts available. That code is active on six segments right now. This report named them, scored them, and mapped the window. The question is not whether these opportunities exist. The question is whether you will be positioned when the window closes in 2028.” |
Frequently Asked Questions — Global 3PL Market
Q: What is the global 3PL market size in 2025?
The global 3PL market was valued at USD 1.6 Trillion in 2025 and is projected to reach USD 4.3 Trillion by 2035, growing at a CAGR of 10.1%. Growth is driven by e-commerce expansion, supply chain outsourcing, AI-powered logistics platforms, pharmaceutical cold chain demand, and nearshoring corridor creation globally.
Q: Which 3PL segment delivers the highest operating margin?
4PL and Supply Chain Management services deliver 18–28% operating margins — the highest in the sector. Value-Added Services (VAS) follow at 15–22%. Both are growing at double-digit CAGRs while domestic transportation management compresses at 3–5% margins driven by digital freight broker disruption.
Q: How is AI disrupting the 3PL industry?
74% of shippers would switch their 3PL provider based on AI capabilities (NTT DATA + Penn State, 2025). 46% of 3PLs deployed AI tools in 2025. AI freight matching reduces empty miles by 20–22%, predictive analytics improves inventory turns 15–20%, and automated policy enforcement reduces out-of-policy spend 8–14%.
Q: What is the largest untapped 3PL opportunity?
SME managed logistics: companies with fewer than 500 employees represent over $220 billion in annual logistics spend with less than 25% managed. No product-market-fit solution exists at SME scale. The first AI-native, SaaS-priced 3PL platform that solves this wins a category-defining market.
Q: Which region offers maximum 3PL investment returns?
India offers the highest risk-adjusted asymmetric returns — logistics cost at 13–14% of GDP vs 8–10% in developed markets creates a structural efficiency gap worth $XX billion. India 3PL: $38–40B in 2025 → $78B by 2035 (7.3% CAGR), with XX% still unorganized.
Q: What is the difference between 3PL and 4PL?
3PL providers manage discrete logistics functions (transport, warehousing, customs). 4PL providers manage the entire supply chain — including oversight of multiple 3PL relationships — delivering 18–28% margins with deepest client lock-in. 4PL growing at XX% CAGR globally.
Q: How does ESG affect 3PL market dynamics?
ESG is redistributing 3PL demand, not suppressing it. EU CSRD mandates Scope 3 emissions disclosure, directly implicating logistics spend. Green-certified 3PLs win enterprise RFPs that non-compliant competitors cannot access. Premium for ESG-compliant 3PL: 8–15% above market rate.
| LEAD ANALYST — Global 3PL & Supply Chain Intelligence Markets This research is authored by analysts with deep expertise in third-party logistics economics, freight corridor intelligence, supply chain technology platform strategy, cold chain infrastructure, and logistics investment thesis development — advising Fortune 500 supply chain teams, private equity logistics investors, 3PL leadership teams, and emerging market logistics operators across Asia Pacific, North America, and Europe.Core competencies: 3PL spend econometrics | Margin migration modeling | Platform competitive analysis | ESG logistics compliance design | Supply chain sovereignty strategy | Regional demand modeling |