
Tablet Market - Industry Structure Evaluation, Demand Drivers Analysis, Regional Growth Analysis and Identification, Competitive Positioning / Landscape Review & Global Market Size Forecast to 2032
Overview
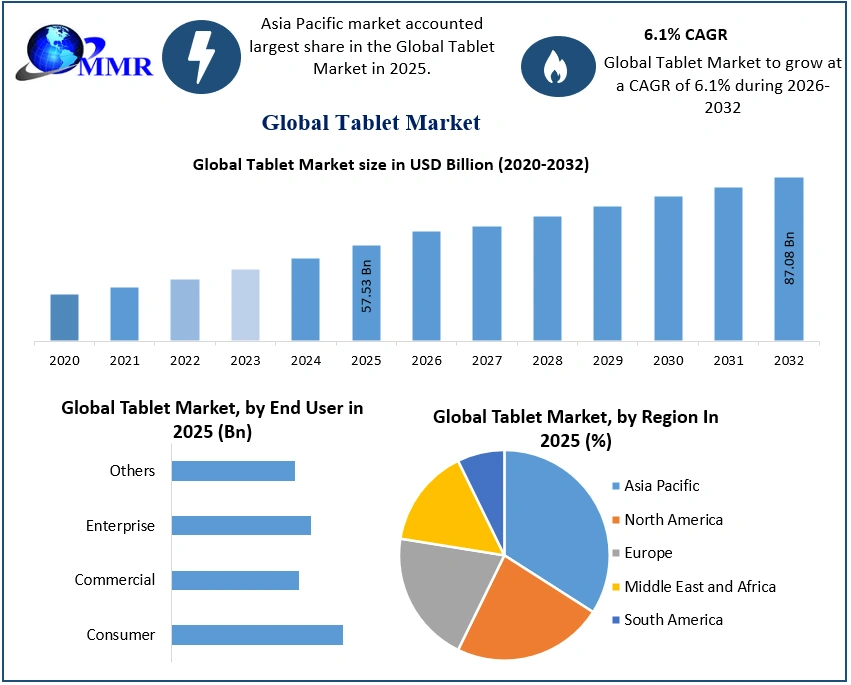
The Tablet Market size was valued at USD 57.53 Billion in 2025 and the total Tablet revenue is expected to grow at a CAGR of 6.1% from 2026 to 2032, reaching nearly USD 87.08 Billion by 2032.
Rising digital learning, remote work, AI-powered tablets, 5G adoption, and enterprise mobility are driving strong market growth worldwide.
Tablet Market Overview
A tablet is a portable, touchscreen device larger than a smartphone and smaller than a laptop, designed for browsing, streaming, gaming, reading, and productivity. It supports apps, stylus input, and wireless connectivity, making it popular for education, entertainment, remote work, and enterprise applications due to its versatility and ease of use. The increasing demand across consumer, enterprise, and education sectors drives the Tablet Market. Increasing adoption of detachable tablets, Slate tablets, and rugged tablets across commercial and industrial applications is strengthening market growth. The proliferation of Android tablets, iOS tablets (iPad), and Windows tablets provides consumers with diverse device options across price brackets, from budget tablets under $200 to premium OLED-display tablets with stylus support.
The increase in online learning tablets, remote work tablets, and education tablet adoption significantly boosted global shipments, which grew by 8.5% year-on-year in 2024, reaching 168 million units. The Asia Pacific tablet market, especially China and India, remains the fastest-growing region, accounting for 38% of global shipments. North America follows with a strong demand for 5G tablets, AI-powered tablets, and commercial devices.
Key manufacturers such as Apple (iPad), Samsung Galaxy Tab, Lenovo, Xiaomi, Huawei, and Microsoft Surface. Increasing preference for large-screen tablets above 10 inches, longer battery life, stylus-compatible tablets, and digital content consumption devices keep the market competitive and innovation-driven.
To know about the Research Methodology :- Request Free Sample Report
Trend: Shift Toward Premium Displays, AI Capabilities & 5G Tablet
A trend shaping the global tablet Market is the rapidly increasing consumer and enterprise shift toward OLED-display tablets, high-resolution screens, AI-powered tablets, and 5G-enabled devices. In 2024, more than 31% of newly launched tablets featured OLED or AMOLED displays, compared to just 14% in 2021. The demand is strongest among professional users such as graphic designers, video editors, and digital content creators seeking high-performance tablets. AI-enabled chipsets are another transformative trend. With Apple’s M-series Screen Sizeors, Qualcomm’s Snapdragon X Elite, and MediaTek’s Dimensity AI architecture, AI-powered tablets grew by 22% YoY in 2024. These features enable faster Screen sizing, intelligent multitasking, real-time transcription, on-device generative AI, and enhanced security, critical for both consumer and commercial applications.
The market for 5G tablets continues to expand, with global shipments rising by 18% in 2024, driven by Asia Pacific, North America, and parts of Europe. As more countries roll out advanced 5G networks, 5G-enabled tablet adoption is expected to reach 55% of all tablet sales by 2030. Consumers increasingly prefer larger screen sizes, especially tablets above 10 inches, which account for 64% of global sales, driving Tablet Market growth. Stylus-based workflows, used for digital art, note-taking, and business productivity, contribute to the popularity of premium tablets with stylus support, particularly in the professional and enterprise segments.
Education, Hybrid Work & Enterprise Digitalization to drive Tablet Market
The rapid surge in education digitalization, remote work adoption, and the increasing use of tablets in commercial and enterprise environments. The global rise in e-learning tablets and government-backed education tablet distribution schemes has significantly impacted overall demand. In 2024, more than 62 million tablets were deployed for school and higher education worldwide, contributing nearly 28% of total tablet shipments. India alone saw a 40% rise in educational tablet adoption under state-backed smart classroom programs, while China’s digital learning ecosystem supported a 12% YoY increase.
Hybrid and remote work trends continue to fuel the Tablet Market demand for detachable tablets, Windows business tablets, and enterprise-grade rugged tablets for industries such as logistics, field operations, construction, and defense. Approximately 34% of global enterprise mobility spending in 2024 was allocated to tablet-based solutions, especially for POS systems, clinical applications, retail operations, and hospitality workflows. The increasing availability of 5G-enabled tablets, AI-powered Screen Sizeors, and improved battery life tablets is accelerating the enterprise transition from laptops to lightweight detachable form factors. Large organizations are increasingly opting for Android tablets and Windows tablets to integrate mobility solutions with existing enterprise software ecosystems.
Market Saturation & Longer Replacement Cycles to restrain the Tablet Market
The Tablet Market is saturated in developed economies, with longer device replacement cycles, and increasing competition from large-screen smartphones and lightweight laptops. Average tablet replacement cycles have extended from 3.1 years in 2019 to 4.5 years in 2024, primarily due to improved hardware longevity and software support.
Developed regions such as North America and Western Europe have already reached high penetration levels.
Approximately 78% of households in these regions own at least one tablet, slowing new sales volumes. The global slowdown in consumer electronics spending in 2023–2024, driven by inflationary pressures, caused a temporary decline in discretionary purchases, especially for premium tablets.
The competitive pressure from hybrid laptops, Chromebooks, and foldable smartphones. Foldables are directly impacting demand for 8-inch to 10-inch tablets. The rise of mini-PCs and low-cost laptops is diverting some consumers away from budget tablets under $200. The commercial sector faces challenges, including integration complexities with legacy systems and high durability requirements for rugged tablets, which increase the total cost of ownership. In the enterprise segment in the Tablet Market, procurement cycles are slower, and organizations prioritize smartphones for mobility, limiting tablet rollout.
Tablet Market Segmentation Analysis
Based on Product, the market is segmented into the Detachable, Slate, Rugged and Others. Slate tablets lead due to their affordability, lightweight design, and strong adoption in the consumer tablet market, education tablet adoption, and online tablet sales across Asia Pacific, India, and South America. Slate tablets dominate because they are ideal for tablets for online learning, digital content consumption devices, tablets for gaming in 2025, and general entertainment. The segment strongly benefits from demand for Android tablets, iOS tablets, and budget tablets under USD 200, with brands like Samsung Galaxy Tab, Lenovo Tab, Xiaomi Pad sales, and Amazon Fire Tablet industry driving volumes. Slate tablets continue to lead due to solid demand across both consumer and commercial tablet markets, especially in retail, healthcare, and tablets for POS operations.

By operating System, the market is categorized into Android, iOS and Windows. Android tablets are the dominant OS segment, surpassing both the iOS tablet market (Apple iPad) and the Windows tablet market. The Android tablet market leads due to its strong presence in emerging regions such as the Asia Pacific market, India tablet adoption, China, Latin America, and the Middle East, where affordability and variety drive mass adoption. Android dominates online tablet sales, offline tablet retail sales, and enterprise deployments, including tablets for POS, tablets for hospital and clinical applications, and rugged tablets for military or field operations. Rapid growth in 5G tablet demand, AI-powered processors in tablets, and stylus-supported tablets further strengthen Android’s position. Brands such as Samsung, Lenovo, Xiaomi, Huawei MatePad, TCL, and Realme contribute significantly to the segment’s scale.

Tablet Market Regional Insights
Asia Pacific dominated the Tablet Market in 2025 and is expected to continue its dominance over the forecast period. The increasing demand for tablets, Android tablets, iOS tablets, Windows tablets, and the emerging adoption of 5G tablets across consumer and enterprise segments. Asia Pacific shipments are 65 million units in 2025, driven by high demand for online tablet sales, education tablet adoption, tablets for online learning, and tablets for hybrid and remote work models. The region remains a hub for the Android tablet market, contributing over 68% of global Android tablet shipments, while the iPad (iOS tablets) market share remains strong in Japan and South Korea.
The surge in detachable, Slate and rugged tablet market for field services, construction, transportation, POS, and healthcare fuels growth. China leads with 28 million shipments, while India’s education tablet demand increased by 40% YoY, supported by government distribution programs. Rising preference for large screen tablets above 10 inches, stylus-supported tablets, AI-powered tablets, and high-resolution tablet screens continues to shape tablet industry trends.
Tablet Market Competitive Landscape
The tablet market's competitive landscape is dominated by global leaders such as Apple, Samsung, Lenovo, Huawei, Xiaomi, and Microsoft, which collectively account for over 82% of global tablet shipments. Apple leads with the highest iPad market share, driven by strong demand for premium tablets and stylus-enabled productivity devices. Samsung maintains a solid position through its Galaxy Tab lineup, especially in Android-driven and 5G-enabled segments.
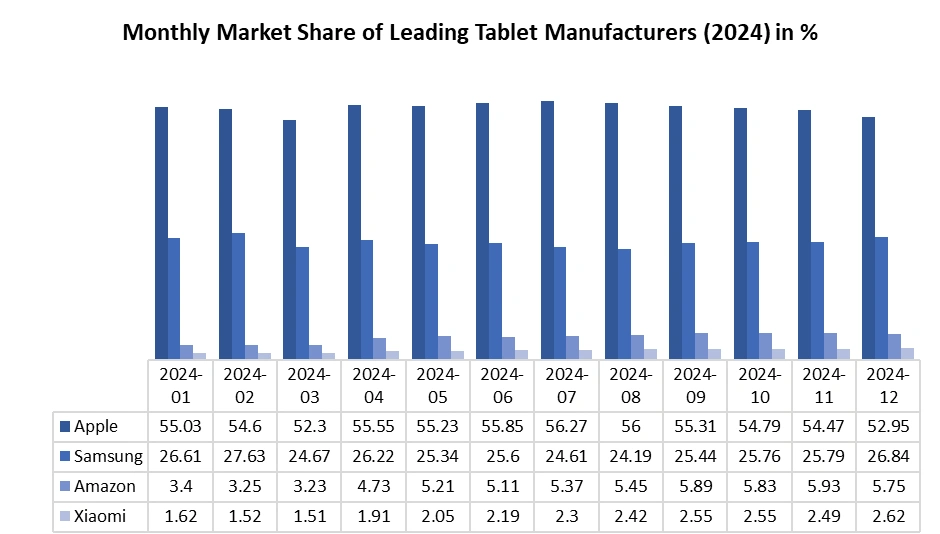
Lenovo and Xiaomi continue expanding rapidly in emerging markets with affordable, high-performance tablets, while Huawei remains competitive in China with its MatePad series. Microsoft strengthens the detachable tablet market through its Surface portfolio, targeting professional and enterprise users. Amazon dominates the budget category with its Fire Tablet range. Intense competition is also emerging from rugged tablet manufacturers and local brands across the Asia-Pacific. Players increasingly differentiate through AI-powered Screen Sizeors, OLED screens, long battery life, enterprise security, and integration with digital ecosystems, driving innovation across consumer and commercial segments.
Tablet Market Recent Industry Developments (2025–2026)
| Date | Company | Development | Impact |
|---|---|---|---|
| 24 February 2026 | Lenovo Group Limited | The company achieved a 35.3% year-over-year growth in the fourth quarter, driven by the strong performance of its XiaoxinPad and Y700 models. | This surge solidified its third-place position in the global market, particularly through expansion in the EMEA and PRC regions. |
| 23 January 2026 | Apple Inc. | The company launched the iPad Air M3 and an entry-level 11th-gen iPad featuring the A16 Bionic chip. | The refresh is expected to drive a 10% shipment growth in 2026 by capturing both premium and base-model consumer segments. |
| 10 November 2025 | Samsung Electronics Co., Ltd. | The company focused its Q3 strategy on high-value Galaxy Tab S10 and S11 models alongside an expanded A series lineup. | The move aims to protect market share in the consumer segment amidst a 1.9% decline in commercial project volumes. |
| 28 October 2025 | Dell Technologies Inc. | The company partnered with T-Mobile to provide approximately 350,000 5G-connected devices to New York City public school students. | This massive deployment highlights the growing role of cellular-equipped tablets in the GIGA 2.0 education initiative. |
| 15 August 2025 | OnePlus Technology Co., Ltd. | The company partnered with Bhagwati Products to initiate local manufacturing of the OnePlus Pad 3 and Pad Lite in India. | Local production is designed to lower costs and increase market penetration within the competitive South Asian tablet landscape. |
| 12 July 2025 | Honor Device Co., Ltd. | The company launched the MagicPad 3 tablet featuring the Snapdragon 8 Gen 3 processor alongside its latest foldable smartphone. | This high-performance launch positions the brand as a direct competitor to premium Android tablets in the productivity-centric segment. |
Tablet Market Scope: Inquire before buying
| Global Tablet Market | |||
|---|---|---|---|
| Report Coverage | Details | ||
| Base Year: | 2025 | Forecast Period: | 2026-2032 |
| Historical Data: | 2020 to 2025 | Market Size in 2025: | USD 57.33 Bn. |
| Forecast Period 2026 to 2032 CAGR: | 6.1% | Market Size in 2032: | USD 87.08 Bn. |
| Segments Covered: | by Product | Detachable Slate Rugged Others |
|
| by Operating System | Android iOS Windows |
||
| by Screen Size | Small (7–8”) Medium (9–11”) Large (12” +) |
||
| by End-User | Consumer Commercial Enterprise Others |
||
| by Distribution Channel | Online Sales Offline Retail |
||
Tablet Market, by Region
Asia Pacific (China, South Korea, Japan, India, Australia, Indonesia, Malaysia, Vietnam, Taiwan, Bangladesh, Pakistan and Rest of APAC)
Europe (UK, France, Germany, Italy, Spain, Sweden, Austria and Rest of Europe)
North America (United States, Canada and Mexico)
Middle East and Africa (South Africa, GCC, Egypt, Nigeria and Rest of ME&A)
South America (Brazil, Argentina Rest of South America)
Tablet Key Players
1. Apple
2. Samsung Electronics
3. Lenovo
4. Huawei
5. Xiaomi
6. Microsoft
7. Amazon
8. ASUS
9. Acer
10. Dell
11. HP (Hewlett-Packard)
12. Panasonic
13. LG Electronics
14. Sony
15. Fujitsu
16. Toshiba
17. Realme
18. Nokia
19. ZTE
20. TCL
21. Alcatel
22. Honor
23. Chuwi
24. Teclast
25. Vivo
26. Oppo
27. Google
28. Zebra Technologies
29. Getac
30. Rugged Science
Frequently Asked Questions:
1] What is the growth rate of the Global Tablet Market?
Ans. The Global Tablet Market is growing at a significant rate of 6.1% during the forecast period.
2] Which region is expected to dominate the Global Tablet Market?
Ans. Asia Pacific is expected to dominate the Tablet Market during the forecast period.
3] What was the Global Tablet Market size in 2025?
Ans. The Tablet Market size is expected to reach USD 57.53 billion in 2025.
4] What is the expected Global Tablet Market size by 2032?
Ans. The Tablet Market size is expected to reach USD 87.08 billion by 2032.
5] Which are the top players in the Global Tablet Market?
Ans. The major players in the Global Tablet Market are Apple, Samsung Electronics, Lenovo, Huawei, Xiaomi and Others.
6] What are the factors driving the Global Tablet Market growth?
Ans. The rising digital learning, remote work adoption, enterprise mobility demand, advancements in AI-powered tablets, 5G connectivity, affordable devices, and increased digital content consumption across consumer and commercial segments drive the Tablet Market.