1. GaN Power Device Market Introduction
1.1. Study Assumption and Market Definition
1.2. Scope of the Study
1.3. Executive Summary
2. Global GaN Power Device Market: Competitive Landscape
2.1. MMR Competition Matrix
2.2. Competitive Landscape
2.3. Key Players Benchmarking
2.3.1. Company Name
2.3.2. Business Segment
2.3.3. End-user Segment
2.3.4. Revenue (2025)
2.3.5. Company Locations
2.4. Leading GaN Power Device Market Companies, by market capitalization
2.5. Market Structure
2.5.1. Market Leaders
2.5.2. Market Followers
2.5.3. Emerging Players
2.6. Mergers and Acquisitions Details
3. GaN Power Device Market: Dynamics
3.1. GaN Power Device Market Trends by Region
3.1.1. North America GaN Power Device Market Trends
3.1.2. Europe GaN Power Device Market Trends
3.1.3. Asia Pacific GaN Power Device Market Trends
3.1.4. Middle East and Africa GaN Power Device Market Trends
3.1.5. South America GaN Power Device Market Trends
3.2. GaN Power Device Market Dynamics by Region
3.2.1. North America
3.2.1.1. North America GaN Power Device Market Drivers
3.2.1.2. North America GaN Power Device Market Restraints
3.2.1.3. North America GaN Power Device Market Opportunities
3.2.1.4. North America GaN Power Device Market Challenges
3.2.2. Europe
3.2.2.1. Europe GaN Power Device Market Drivers
3.2.2.2. Europe GaN Power Device Market Restraints
3.2.2.3. Europe GaN Power Device Market Opportunities
3.2.2.4. Europe GaN Power Device Market Challenges
3.2.3. Asia Pacific
3.2.3.1. Asia Pacific GaN Power Device Market Drivers
3.2.3.2. Asia Pacific GaN Power Device Market Restraints
3.2.3.3. Asia Pacific GaN Power Device Market Opportunities
3.2.3.4. Asia Pacific GaN Power Device Market Challenges
3.2.4. Middle East and Africa
3.2.4.1. Middle East and Africa GaN Power Device Market Drivers
3.2.4.2. Middle East and Africa GaN Power Device Market Restraints
3.2.4.3. Middle East and Africa GaN Power Device Market Opportunities
3.2.4.4. Middle East and Africa GaN Power Device Market Challenges
3.2.5. South America
3.2.5.1. South America GaN Power Device Market Drivers
3.2.5.2. South America GaN Power Device Market Restraints
3.2.5.3. South America GaN Power Device Market Opportunities
3.2.5.4. South America GaN Power Device Market Challenges
3.3. PORTER's Five Forces Analysis
3.4. PESTLE Analysis
3.5. Technology Roadmap
3.6. Regulatory Landscape by Region
3.6.1. North America
3.6.2. Europe
3.6.3. Asia Pacific
3.6.4. Middle East and Africa
3.6.5. South America
3.7. Key Opinion Leader Analysis For GaN Power Device Industry
3.8. Analysis of Government Schemes and Initiatives For GaN Power Device Industry
3.9. GaN Power Device Market Trade Analysis
3.10. The Global Pandemic Impact on GaN Power Device Market
4. GaN Power Device Market: Global Market Size and Forecast by Segmentation (in USD Bn) 2025-2032
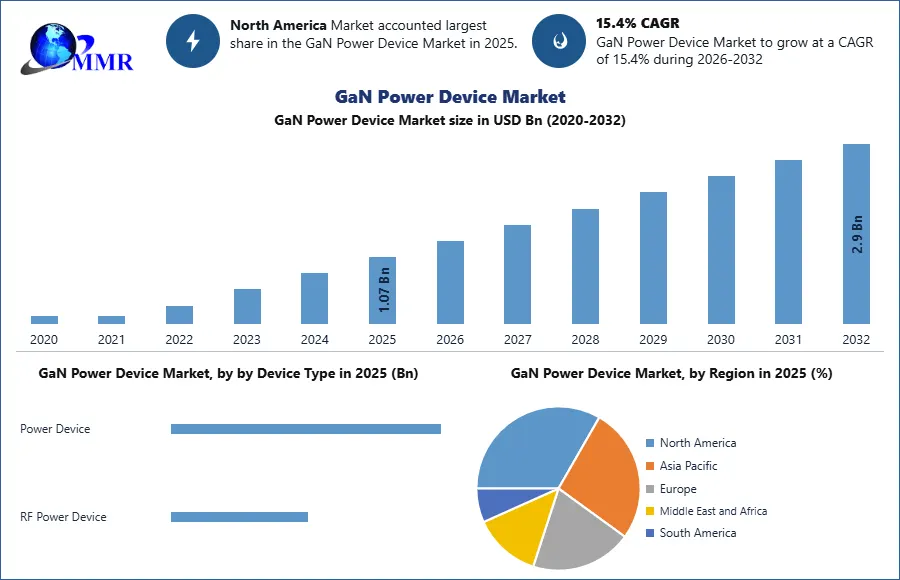
4.1. GaN Power Device Market Size and Forecast, by by Device Type (2025-2032)
4.1.1. Power Device
4.1.2. RF Power Device
4.2. GaN Power Device Market Size and Forecast, by by Voltage Range (2025-2032)
4.2.1. Low Voltage (200V)
4.2.2. Medium Voltage (200V - 600V)
4.2.3. High Voltage (>600V)
4.3. GaN Power Device Market Size and Forecast, by by Application (2025-2032)
4.3.1. Power Drives
4.3.2. Supply and Inverter
4.3.3. Radio Frequency
4.4. GaN Power Device Market Size and Forecast, by by Vertical (2025-2032)
4.4.1. Military, Defense, and Aerospace
4.4.2. Telecommunications
4.4.3. Industrial
4.4.4. Automotive
4.4.5. Renewables
4.4.6. Consumer and Enterprise
4.4.7. Others
4.5. GaN Power Device Market Size and Forecast, by Region (2025-2032)
4.5.1. North America
4.5.2. Europe
4.5.3. Asia Pacific
4.5.4. Middle East and Africa
4.5.5. South America
5. North America GaN Power Device Market Size and Forecast by Segmentation (in USD Bn) 2025-2032
5.1. North America GaN Power Device Market Size and Forecast, by by Device Type (2025-2032)
5.1.1. Power Device
5.1.2. RF Power Device
5.2. North America GaN Power Device Market Size and Forecast, by by Voltage Range (2025-2032)
5.2.1. Low Voltage (200V)
5.2.2. Medium Voltage (200V - 600V)
5.2.3. High Voltage (>600V)
5.3. North America GaN Power Device Market Size and Forecast, by by Application (2025-2032)
5.3.1. Power Drives
5.3.2. Supply and Inverter
5.3.3. Radio Frequency
5.4. North America GaN Power Device Market Size and Forecast, by by Vertical (2025-2032)
5.4.1. Military, Defense, and Aerospace
5.4.2. Telecommunications
5.4.3. Industrial
5.4.4. Automotive
5.4.5. Renewables
5.4.6. Consumer and Enterprise
5.4.7. Others
5.5. North America GaN Power Device Market Size and Forecast, by Country (2025-2032)
5.5.1. United States
5.5.1.1. United States GaN Power Device Market Size and Forecast, by by Device Type (2025-2032)
5.5.1.1.1. Power Device
5.5.1.1.2. RF Power Device
5.5.1.2. United States GaN Power Device Market Size and Forecast, by by Voltage Range (2025-2032)
5.5.1.2.1. Low Voltage (200V)
5.5.1.2.2. Medium Voltage (200V - 600V)
5.5.1.2.3. High Voltage (>600V)
5.5.1.3. United States GaN Power Device Market Size and Forecast, by by Application (2025-2032)
5.5.1.3.1. Power Drives
5.5.1.3.2. Supply and Inverter
5.5.1.3.3. Radio Frequency
5.5.1.4. United States GaN Power Device Market Size and Forecast, by by Vertical (2025-2032)
5.5.1.4.1. Military, Defense, and Aerospace
5.5.1.4.2. Telecommunications
5.5.1.4.3. Industrial
5.5.1.4.4. Automotive
5.5.1.4.5. Renewables
5.5.1.4.6. Consumer and Enterprise
5.5.1.4.7. Others
5.5.2. Canada
5.5.2.1. Canada GaN Power Device Market Size and Forecast, by by Device Type (2025-2032)
5.5.2.1.1. Power Device
5.5.2.1.2. RF Power Device
5.5.2.2. Canada GaN Power Device Market Size and Forecast, by by Voltage Range (2025-2032)
5.5.2.2.1. Low Voltage (200V)
5.5.2.2.2. Medium Voltage (200V - 600V)
5.5.2.2.3. High Voltage (>600V)
5.5.2.3. Canada GaN Power Device Market Size and Forecast, by by Application (2025-2032)
5.5.2.3.1. Power Drives
5.5.2.3.2. Supply and Inverter
5.5.2.3.3. Radio Frequency
5.5.2.4. Canada GaN Power Device Market Size and Forecast, by by Vertical (2025-2032)
5.5.2.4.1. Military, Defense, and Aerospace
5.5.2.4.2. Telecommunications
5.5.2.4.3. Industrial
5.5.2.4.4. Automotive
5.5.2.4.5. Renewables
5.5.2.4.6. Consumer and Enterprise
5.5.2.4.7. Others
5.5.3. Mexico
5.5.3.1. Mexico GaN Power Device Market Size and Forecast, by by Device Type (2025-2032)
5.5.3.1.1. Power Device
5.5.3.1.2. RF Power Device
5.5.3.2. Mexico GaN Power Device Market Size and Forecast, by by Voltage Range (2025-2032)
5.5.3.2.1. Low Voltage (200V)
5.5.3.2.2. Medium Voltage (200V - 600V)
5.5.3.2.3. High Voltage (>600V)
5.5.3.3. Mexico GaN Power Device Market Size and Forecast, by by Application (2025-2032)
5.5.3.3.1. Power Drives
5.5.3.3.2. Supply and Inverter
5.5.3.3.3. Radio Frequency
5.5.3.4. Mexico GaN Power Device Market Size and Forecast, by by Vertical (2025-2032)
5.5.3.4.1. Military, Defense, and Aerospace
5.5.3.4.2. Telecommunications
5.5.3.4.3. Industrial
5.5.3.4.4. Automotive
5.5.3.4.5. Renewables
5.5.3.4.6. Consumer and Enterprise
5.5.3.4.7. Others
6. Europe GaN Power Device Market Size and Forecast by Segmentation (in USD Bn) 2025-2032
6.1. Europe GaN Power Device Market Size and Forecast, by by Device Type (2025-2032)
6.2. Europe GaN Power Device Market Size and Forecast, by by Voltage Range (2025-2032)
6.3. Europe GaN Power Device Market Size and Forecast, by by Application (2025-2032)
6.4. Europe GaN Power Device Market Size and Forecast, by by Vertical (2025-2032)
6.5. Europe GaN Power Device Market Size and Forecast, by Country (2025-2032)
6.5.1. United Kingdom
6.5.1.1. United Kingdom GaN Power Device Market Size and Forecast, by by Device Type (2025-2032)
6.5.1.2. United Kingdom GaN Power Device Market Size and Forecast, by by Voltage Range (2025-2032)
6.5.1.3. United Kingdom GaN Power Device Market Size and Forecast, by by Application (2025-2032)
6.5.1.4. United Kingdom GaN Power Device Market Size and Forecast, by by Vertical (2025-2032)
6.5.2. France
6.5.2.1. France GaN Power Device Market Size and Forecast, by by Device Type (2025-2032)
6.5.2.2. France GaN Power Device Market Size and Forecast, by by Voltage Range (2025-2032)
6.5.2.3. France GaN Power Device Market Size and Forecast, by by Application (2025-2032)
6.5.2.4. France GaN Power Device Market Size and Forecast, by by Vertical (2025-2032)
6.5.3. Germany
6.5.3.1. Germany GaN Power Device Market Size and Forecast, by by Device Type (2025-2032)
6.5.3.2. Germany GaN Power Device Market Size and Forecast, by by Voltage Range (2025-2032)
6.5.3.3. Germany GaN Power Device Market Size and Forecast, by by Application (2025-2032)
6.5.3.4. Germany GaN Power Device Market Size and Forecast, by by Vertical (2025-2032)
6.5.4. Italy
6.5.4.1. Italy GaN Power Device Market Size and Forecast, by by Device Type (2025-2032)
6.5.4.2. Italy GaN Power Device Market Size and Forecast, by by Voltage Range (2025-2032)
6.5.4.3. Italy GaN Power Device Market Size and Forecast, by by Application (2025-2032)
6.5.4.4. Italy GaN Power Device Market Size and Forecast, by by Vertical (2025-2032)
6.5.5. Spain
6.5.5.1. Spain GaN Power Device Market Size and Forecast, by by Device Type (2025-2032)
6.5.5.2. Spain GaN Power Device Market Size and Forecast, by by Voltage Range (2025-2032)
6.5.5.3. Spain GaN Power Device Market Size and Forecast, by by Application (2025-2032)
6.5.5.4. Spain GaN Power Device Market Size and Forecast, by by Vertical (2025-2032)
6.5.6. Sweden
6.5.6.1. Sweden GaN Power Device Market Size and Forecast, by by Device Type (2025-2032)
6.5.6.2. Sweden GaN Power Device Market Size and Forecast, by by Voltage Range (2025-2032)
6.5.6.3. Sweden GaN Power Device Market Size and Forecast, by by Application (2025-2032)
6.5.6.4. Sweden GaN Power Device Market Size and Forecast, by by Vertical (2025-2032)
6.5.7. Austria
6.5.7.1. Austria GaN Power Device Market Size and Forecast, by by Device Type (2025-2032)
6.5.7.2. Austria GaN Power Device Market Size and Forecast, by by Voltage Range (2025-2032)
6.5.7.3. Austria GaN Power Device Market Size and Forecast, by by Application (2025-2032)
6.5.7.4. Austria GaN Power Device Market Size and Forecast, by by Vertical (2025-2032)
6.5.8. Rest of Europe
6.5.8.1. Rest of Europe GaN Power Device Market Size and Forecast, by by Device Type (2025-2032)
6.5.8.2. Rest of Europe GaN Power Device Market Size and Forecast, by by Voltage Range (2025-2032)
6.5.8.3. Rest of Europe GaN Power Device Market Size and Forecast, by by Application (2025-2032)
6.5.8.4. Rest of Europe GaN Power Device Market Size and Forecast, by by Vertical (2025-2032)
7. Asia Pacific GaN Power Device Market Size and Forecast by Segmentation (in USD Bn) 2025-2032
7.1. Asia Pacific GaN Power Device Market Size and Forecast, by by Device Type (2025-2032)
7.2. Asia Pacific GaN Power Device Market Size and Forecast, by by Voltage Range (2025-2032)
7.3. Asia Pacific GaN Power Device Market Size and Forecast, by by Application (2025-2032)
7.4. Asia Pacific GaN Power Device Market Size and Forecast, by by Vertical (2025-2032)
7.5. Asia Pacific GaN Power Device Market Size and Forecast, by Country (2025-2032)
7.5.1. China
7.5.1.1. China GaN Power Device Market Size and Forecast, by by Device Type (2025-2032)
7.5.1.2. China GaN Power Device Market Size and Forecast, by by Voltage Range (2025-2032)
7.5.1.3. China GaN Power Device Market Size and Forecast, by by Application (2025-2032)
7.5.1.4. China GaN Power Device Market Size and Forecast, by by Vertical (2025-2032)
7.5.2. S Korea
7.5.2.1. S Korea GaN Power Device Market Size and Forecast, by by Device Type (2025-2032)
7.5.2.2. S Korea GaN Power Device Market Size and Forecast, by by Voltage Range (2025-2032)
7.5.2.3. S Korea GaN Power Device Market Size and Forecast, by by Application (2025-2032)
7.5.2.4. S Korea GaN Power Device Market Size and Forecast, by by Vertical (2025-2032)
7.5.3. Japan
7.5.3.1. Japan GaN Power Device Market Size and Forecast, by by Device Type (2025-2032)
7.5.3.2. Japan GaN Power Device Market Size and Forecast, by by Voltage Range (2025-2032)
7.5.3.3. Japan GaN Power Device Market Size and Forecast, by by Application (2025-2032)
7.5.3.4. Japan GaN Power Device Market Size and Forecast, by by Vertical (2025-2032)
7.5.4. India
7.5.4.1. India GaN Power Device Market Size and Forecast, by by Device Type (2025-2032)
7.5.4.2. India GaN Power Device Market Size and Forecast, by by Voltage Range (2025-2032)
7.5.4.3. India GaN Power Device Market Size and Forecast, by by Application (2025-2032)
7.5.4.4. India GaN Power Device Market Size and Forecast, by by Vertical (2025-2032)
7.5.5. Australia
7.5.5.1. Australia GaN Power Device Market Size and Forecast, by by Device Type (2025-2032)
7.5.5.2. Australia GaN Power Device Market Size and Forecast, by by Voltage Range (2025-2032)
7.5.5.3. Australia GaN Power Device Market Size and Forecast, by by Application (2025-2032)
7.5.5.4. Australia GaN Power Device Market Size and Forecast, by by Vertical (2025-2032)
7.5.6. Indonesia
7.5.6.1. Indonesia GaN Power Device Market Size and Forecast, by by Device Type (2025-2032)
7.5.6.2. Indonesia GaN Power Device Market Size and Forecast, by by Voltage Range (2025-2032)
7.5.6.3. Indonesia GaN Power Device Market Size and Forecast, by by Application (2025-2032)
7.5.6.4. Indonesia GaN Power Device Market Size and Forecast, by by Vertical (2025-2032)
7.5.7. Malaysia
7.5.7.1. Malaysia GaN Power Device Market Size and Forecast, by by Device Type (2025-2032)
7.5.7.2. Malaysia GaN Power Device Market Size and Forecast, by by Voltage Range (2025-2032)
7.5.7.3. Malaysia GaN Power Device Market Size and Forecast, by by Application (2025-2032)
7.5.7.4. Malaysia GaN Power Device Market Size and Forecast, by by Vertical (2025-2032)
7.5.8. Vietnam
7.5.8.1. Vietnam GaN Power Device Market Size and Forecast, by by Device Type (2025-2032)
7.5.8.2. Vietnam GaN Power Device Market Size and Forecast, by by Voltage Range (2025-2032)
7.5.8.3. Vietnam GaN Power Device Market Size and Forecast, by by Application (2025-2032)
7.5.8.4. Vietnam GaN Power Device Market Size and Forecast, by by Vertical (2025-2032)
7.5.9. Taiwan
7.5.9.1. Taiwan GaN Power Device Market Size and Forecast, by by Device Type (2025-2032)
7.5.9.2. Taiwan GaN Power Device Market Size and Forecast, by by Voltage Range (2025-2032)
7.5.9.3. Taiwan GaN Power Device Market Size and Forecast, by by Application (2025-2032)
7.5.9.4. Taiwan GaN Power Device Market Size and Forecast, by by Vertical (2025-2032)
7.5.10. Rest of Asia Pacific
7.5.10.1. Rest of Asia Pacific GaN Power Device Market Size and Forecast, by by Device Type (2025-2032)
7.5.10.2. Rest of Asia Pacific GaN Power Device Market Size and Forecast, by by Voltage Range (2025-2032)
7.5.10.3. Rest of Asia Pacific GaN Power Device Market Size and Forecast, by by Application (2025-2032)
7.5.10.4. Rest of Asia Pacific GaN Power Device Market Size and Forecast, by by Vertical (2025-2032)
8. Middle East and Africa GaN Power Device Market Size and Forecast by Segmentation (in USD Bn) 2025-2032
8.1. Middle East and Africa GaN Power Device Market Size and Forecast, by by Device Type (2025-2032)
8.2. Middle East and Africa GaN Power Device Market Size and Forecast, by by Voltage Range (2025-2032)
8.3. Middle East and Africa GaN Power Device Market Size and Forecast, by by Application (2025-2032)
8.4. Middle East and Africa GaN Power Device Market Size and Forecast, by by Vertical (2025-2032)
8.5. Middle East and Africa GaN Power Device Market Size and Forecast, by Country (2025-2032)
8.5.1. South Africa
8.5.1.1. South Africa GaN Power Device Market Size and Forecast, by by Device Type (2025-2032)
8.5.1.2. South Africa GaN Power Device Market Size and Forecast, by by Voltage Range (2025-2032)
8.5.1.3. South Africa GaN Power Device Market Size and Forecast, by by Application (2025-2032)
8.5.1.4. South Africa GaN Power Device Market Size and Forecast, by by Vertical (2025-2032)
8.5.2. GCC
8.5.2.1. GCC GaN Power Device Market Size and Forecast, by by Device Type (2025-2032)
8.5.2.2. GCC GaN Power Device Market Size and Forecast, by by Voltage Range (2025-2032)
8.5.2.3. GCC GaN Power Device Market Size and Forecast, by by Application (2025-2032)
8.5.2.4. GCC GaN Power Device Market Size and Forecast, by by Vertical (2025-2032)
8.5.3. Nigeria
8.5.3.1. Nigeria GaN Power Device Market Size and Forecast, by by Device Type (2025-2032)
8.5.3.2. Nigeria GaN Power Device Market Size and Forecast, by by Voltage Range (2025-2032)
8.5.3.3. Nigeria GaN Power Device Market Size and Forecast, by by Application (2025-2032)
8.5.3.4. Nigeria GaN Power Device Market Size and Forecast, by by Vertical (2025-2032)
8.5.4. Rest of ME&A
8.5.4.1. Rest of ME&A GaN Power Device Market Size and Forecast, by by Device Type (2025-2032)
8.5.4.2. Rest of ME&A GaN Power Device Market Size and Forecast, by by Voltage Range (2025-2032)
8.5.4.3. Rest of ME&A GaN Power Device Market Size and Forecast, by by Application (2025-2032)
8.5.4.4. Rest of ME&A GaN Power Device Market Size and Forecast, by by Vertical (2025-2032)
9. South America GaN Power Device Market Size and Forecast by Segmentation (in USD Bn) 2025-2032
9.1. South America GaN Power Device Market Size and Forecast, by by Device Type (2025-2032)
9.2. South America GaN Power Device Market Size and Forecast, by by Voltage Range (2025-2032)
9.3. South America GaN Power Device Market Size and Forecast, by by Application (2025-2032)
9.4. South America GaN Power Device Market Size and Forecast, by by Vertical (2025-2032)
9.5. South America GaN Power Device Market Size and Forecast, by Country (2025-2032)
9.5.1. Brazil
9.5.1.1. Brazil GaN Power Device Market Size and Forecast, by by Device Type (2025-2032)
9.5.1.2. Brazil GaN Power Device Market Size and Forecast, by by Voltage Range (2025-2032)
9.5.1.3. Brazil GaN Power Device Market Size and Forecast, by by Application (2025-2032)
9.5.1.4. Brazil GaN Power Device Market Size and Forecast, by by Vertical (2025-2032)
9.5.2. Argentina
9.5.2.1. Argentina GaN Power Device Market Size and Forecast, by by Device Type (2025-2032)
9.5.2.2. Argentina GaN Power Device Market Size and Forecast, by by Voltage Range (2025-2032)
9.5.2.3. Argentina GaN Power Device Market Size and Forecast, by by Application (2025-2032)
9.5.2.4. Argentina GaN Power Device Market Size and Forecast, by by Vertical (2025-2032)
9.5.3. Rest Of South America
9.5.3.1. Rest Of South America GaN Power Device Market Size and Forecast, by by Device Type (2025-2032)
9.5.3.2. Rest Of South America GaN Power Device Market Size and Forecast, by by Voltage Range (2025-2032)
9.5.3.3. Rest Of South America GaN Power Device Market Size and Forecast, by by Application (2025-2032)
9.5.3.4. Rest Of South America GaN Power Device Market Size and Forecast, by by Vertical (2025-2032)
10. Company Profile: Key Players
10.1. CREE
10.1.1. Company Overview
10.1.2. Business Portfolio
10.1.3. Financial Overview
10.1.4. SWOT Analysis
10.1.5. Strategic Analysis
10.1.6. Scale of Operation (small, medium, and large)
10.1.7. Details on Partnership
10.1.8. Regulatory Accreditations and Certifications Received by Them
10.1.9. Awards Received by the Firm
10.1.10. Recent Developments
10.2. Infineon
10.3. Qorvo
10.4. Macom
10.5. Microsemi
10.6. Mitsubishi Electric
10.7. Efficient Power Conversion
10.8. GaN Systems
10.9. Navitas Semiconductor
10.10. Toshiba
10.11. Fujitsu Limited
10.12. Panasonic Corporation
10.13. VisIC
10.14. Texas Instruments Inc.
10.15. Taiwan Semiconductor Manufacturing Company
10.16. IQE
10.17. Koninklijke Philips N.V.
10.18. Sumitomo Electric Industries Ltd.
10.19. Exagan
10.20. Integra Technologies Inc.
10.21. Transphorm Inc.
10.22. GaNpower
10.23. Analog Devices Inc.
10.24. Ampleon
10.25. Northrop Grumman Corporation
10.26. Dialog Semiconductor
10.27. Others
11. Key Findings
12. Industry Recommendations
13. GaN Power Device Market: Research Methodology
14. Terms and Glossary