
Syngas Market by Feedstock ,Technology,Gasifier Type, Application, and Region - Global Market Size Estimation, Industry-Wide Analysis, Competitive Landscape Assessment & Long-Term Forecast to 2032
Overview
The Syngas Market size was valued at USD 76.63 Billion in 2025 and the total Syngas revenue is expected to grow at a CAGR of 10.8% from 2026 to 2032, reaching nearly USD 157.1 Billion.
Syngas Market Overview:
The global concerns surrounding energy and the environment have propelled the significance of Gas-to-Liquid technologies, encompassing Fischer-Tropsch (FT) synthesis, methanol synthesis, and dimethyl ether (DME) synthesis. These innovations not only produce clean fuels but also yield a spectrum of chemical products, contributing to the burgeoning syngas market. Although GTL fuels originate from diverse feedstocks, processes involving coal or biomass exhibit more stages and a larger environmental footprint compared to natural gas inputs. Notably, European companies predominantly prioritize natural gas-to-liquid processes, while countries like China emphasize coal as their primary feedstock. 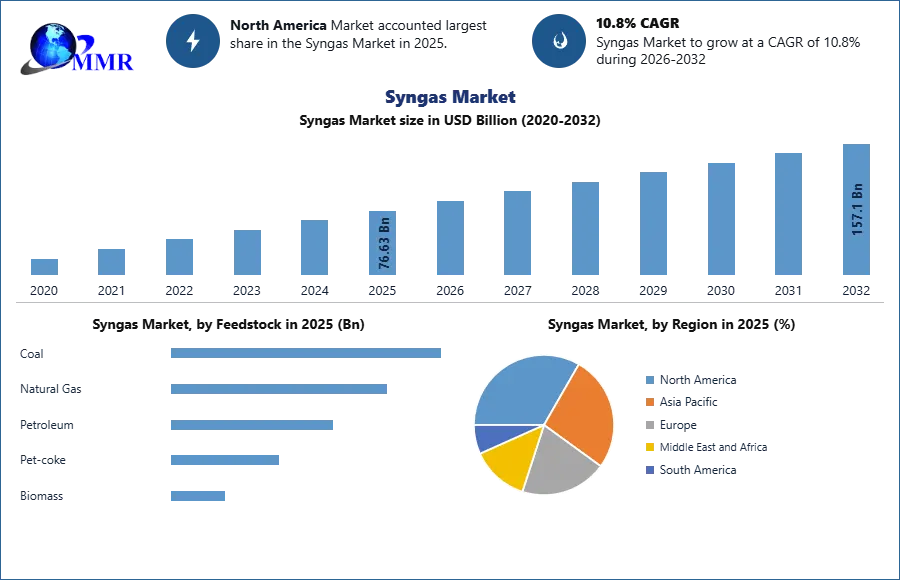 To know about the Research Methodology :- Request Free Sample Report
GTL technology, with an established presence, demands ongoing refinements. Qatar's operational major GTL plants, like Sasol's Oryx and Shell's PEARL-GTL, employ distinct methods for syngas production and conversion to fuels. However, both processes present substantial room for further optimization in the syngas market. Original stakeholders, like BP, envision advancements in conversion technology to expand the Gas-to-Products (GTP) portfolio. Overcoming challenges such as reactor size, high FT-related expenditures, syngas costs, and air separation processes are crucial to enhancing GTL's viability in the syngas market, despite its characteristic high capital costs ranging from $25,000 to $45,000 per daily barrel.
The Global Syngas Market is facing a fundamental structural shift as the 2026 Middle East crisis destabilizes petrochemical feedstocks. With the Hormuz blockade driving crude to $120/bbl, energy-intensive gasification overheads have spiked 30%, while 400% maritime freight surcharges disrupt global trade. Market leaders are prioritizing near-shored biomass gasification and waste-to-energy models to bypass volatile corridors. This strategic transition is essential for maintaining the 11.29% CAGR, ensuring industrial resilience and supply security for the global fertilizer and chemical sectors.
Syngas Market Dynamics:
Growing Syngas Adoption in the Chemical Industry to Accelerate Market Growth:
One of the primary catalysts for the growth of the syngas market is the surging demand from chemical industries worldwide. Syngas serves as a pivotal ingredient in generating synthetic natural gas (SNG), vital for producing compressed natural gas (CNG) and liquefied natural gas (LNG), crucial in maritime, rail, and road transportation sectors. Its indispensable role in fuel gas engines, ensuring enhanced stability, cost efficiency, and power supply, further propels the demand within the syngas market.
Rapidly availability of feedstock in the Middle East and Africa region has led major companies to set up new plants and increase existing plan production:
Major companies have set up new facilities and increased existing plan production due to the Middle East and Africa region's rapid supply of feedstock. For Example, Linde which is a leading global industrial gases and engineering company has started a New Syngas Processing Plant in the U.S. Gulf Coast.
To address the increased demand for sustainable fuels, more sophisticated feedstocks are expected to be required:
After 2035, the expected surge in EV adoption could reduce ICE car usage, impacting liquid fuels and escalating demand for sustainable fuels in road transport within the syngas market. However, aviation needs may counterbalance, augmenting sustainable fuel demand, potentially hitting 400 Mt by 2050. Careful growth in edible oils and sugar feedstocks is vital, mindful of food scarcity in Ukraine. Scarcity of waste oil feedstocks might cap global supply (30 Mt) by the late, necessitating rapid cultivation of low indirect land use change (ILUC)/cover crops. Meeting rising sustainable fuel demands entails a significant shift to alternative feedstocks, including non-biological origin renewable fuels (RFNBO) like CO2 and H2 for synthetic fuels, and lingo-cellulosic materials within the syngas market.
Sustainable fuel investments are gaining traction:
With a total investment pipeline of $40 billion to $50 billion planned (of which about 70% is already post-final investment decision), 46 Mt of sustainable fuel capacity is expected by 2026. However, further expenditures of $1 trillion to $1.4 trillion are required by 2040 to achieve decarbonization targets and regulated demand. In the future decades, financial models may need to address integrated production logic as volumes change from road to aircraft, where production profitability is expected to be determined by supply-demand balance, feedstock availability, and customer appeal.
Cost reduction trends in syngas production:
Syngas generation is a vital component for either FT products or methanol; in both cases, it is the most expensive and energy-intensive stage of the production cycle. Syngas Market production generally accounts for 50-60% of overall cost, with FT conversion accounting for 25% and product upgrading accounting for 15-25%. Aerothermal reforming is the current technology of choice for large-scale FT facilities based on natural gas. The primary expenses of an ATR unit are associated with the production of oxygen. As a result, even though the process is well-established, this is the stage that requires future growth.
Recent advancements in membrane technology for removing H2 and CO2, as well as oxygen separation from the air, bring up new avenues for cost reduction in syngas generation. The syngas plant accounts for around 60-70% of the capital cost of methanol production. To significantly lower the cost, a breakthrough is necessary. The Argonne National Laboratory, in collaboration with Amoco, pioneered the use of membrane technology in the manufacture of syngas, demonstrating that the membrane process could reduce the cost of syngas production by around 30%. Amoco, BP, Praxair, Statoil, and Sasol have announced a collaboration to develop this technology. The Department of Energy of the United States launched an $84 million effort to develop membrane technology for syngas generation.
High Initial Investment Could Limit the Syngas Market's Growth:
The long process of building an operating syngas plant & large capital expenditures are the primary factors hindering industry growth. While hydrogen is utilized to create a number of chemical intermediates and clean fuels, carbon monoxide is a raw material used in the manufacturing of a wide variety of specialized compounds. Acetylene Off-Gas (AOG), a waste stream with a lower value, will be converted into these two high-value products at the Linde plant in order to service clients along its pipeline.
According to Jeff Barnhard, Vice President, South Region, the new Geismar plant takes companies total investment in this area to over $250 million and underscores their continuous commitment to servicing their customers in the Mississippi River corridor in a safe, dependable, and sustainable manner. They are still collaborating with their clients to promote their expansion by supplying the basic building blocks required to make higher-value chemicals and clean fuels.
The clean energy transition is rapidly underway:
India's groundbreaking initiative in Hyderabad marks the country's entry into the syngas market by constructing a pilot plant and establishing a proprietary process to convert high-ash Indian coal into methanol. This technique will encourage the use of methanol as a transportation fuel (by blending it with gasoline) and help the nation adopt clean technologies, hence lowering the need to import crude oil. The general procedure for turning coal into methanol includes turning it into synthesis (syngas) gas, cleaning and conditioning syngas, turning syngas into methanol, and purifying methanol.
Bharat Heavy Electricals Limited (BHEL) has created the fluidized bed gasification technique suitable for high ash Indian coals in order to produce syngas and then convert syngas to methanol with 99% purity. This technology will help to solve this difficulty. In order to convert syngas into methanol, BHEL has integrated a suitable downstream process into its existing coal-to-syngas pilot facility in Hyderabad. The Department of Science and Technology (DST) is funding this pilot-scale initiative, which has a 0.25 metric tonne per day capability to produce methanol. It was started by NITI Aayog. The pilot plant is currently producing methanol that is purer than 99%. Scaling this initiative accelerates India's journey toward energy independence, optimizing its energy resources within the syngas market.
Future lucrative opportunities for the syngas market could be created by key players' strong presence and their strategic moves.
Due to the existence of major companies on a global scale, the syngas market price is expected to increase quickly. Companies like Linde plc, Air Products & Chemicals, Inc., and Haldor Topsoe A/S have been putting a lot of emphasis on tactics including acquisitions, expansions, and the introduction of novel products in underserved and promising markets. For instance, a long-term agreement to develop, own, and run a new syngas and derivatives market manufacturing plant was formally inked in May between Air Products Inc. and BPCL (Bharat Petroleum Corporation Limited), a government-owned oil and gas company in India. During the forecast period, it is expected that such significant advances would also open up investment prospects for the syngas sector.
The fluidized bed gasifier sub-segment would have the biggest market share globally & and produce $25,721.6 Mn in revenue.
In order to increase turbulence and achieve more thorough gasification of low reactivity feedstock, fluidized bed gasifiers are frequently used. Additionally, compared to entrained-bed gasifiers, it has superior cold gas efficiency. Furthermore, one of the most important designs for biomass gasification is the fluidized bed gasifier, largely because it can be used for medium-scale processes. Furthermore, fluidized bed gasifier demand is expected to be driven by major benefits like high efficiency, flexible feedstock, and decreased emissions. As a result, the fluidized bed gasifier sector had the largest syngas market share in 2025.
By the end of 2032, the coal segment of the syngas market price is estimated to reach $xx million, up from $xx million in 2025. This growth is primarily attributable to the high availability of coal for energy generation and its excellent compatibility as a feedstock with cutting-edge technologies for the production of synthetic gas. In addition, significant markets like China and India are heavily involved in the manufacturing of coal-based syngas. During the forecast period, this might support the industry growth of the coal segment globally.
The global syngas market's steam reforming sub-segment is expected to grow the fastest, from $xx million in the year 2025 to up to $xx million in 2032. One of the tested & and effective technologies for the manufacture of syngas and derivatives market is steam reforming, primarily because this approach is a low-cost, dependable, and popular way to produce hydrogen with favorable environmental effects. In order to increase their presence in the worldwide market, major firms like Haldor Topsoe A/S, a renowned Danish catalysis company, are developing unique breakthroughs. For instance, Topsoe announced in February that it would introduce the highly efficient and dependable "advanced steam reforming catalyst series" known as TITAN. Due to its hibonite-rich composition, it primarily offers improved performance and a longer catalyst lifespan. During the forecast period, such corporate developments can have a favorable effect on the growth of the syngas market.
Syngas Market Regional Insights:
By the end of 2032, the market size of the Asia-Pacific synthesis gas is expected to surpass $xx million and increase at a 6.2% annual pace, making it the region with the largest market. Due to increased demand for syngas across a variety of industries, including those producing fuel, chemicals, and power, the Asia-Pacific region is expected to experience rapid expansion during the forecast period. Additionally, the Asia Pacific synthesis gas market size will benefit from the growing urbanization in Asian nations like Japan and Australia.
China Leads Syngas Investments in the APAC region:
Coal accounts for 1.9 billion tonnes of oil equivalent per year in China's overall primary energy consumption in syngas market in 2025. In the previous decade, China's coal gasification sector has seen rapid commercialization. Overcapacity developed in the late 2000s in coal, steel, fertilizers, methanol, and dimethyl ether. In its most recent Five-Year Plan, China targeted emission and particle reductions, as well as water utilization technologies. Domestic coal use in China peaked in . The growth of consumer goods production drives rising demand for methanol, olefins, acetyls, and Oxo compounds. Larger-scale projects have been emphasized in China, notably by big oil, gas, coal, and power corporations. Renewables, high-efficiency pulverized coal, and natural gas are becoming more prevalent.
 Lower petroleum prices put pressure on coal-to-liquids and synthetic natural gas projects, but there are other forces at play e.g. Lower coal and steel prices, etc. Overall, capital investment intensity is lower than in other nations. The water resource issue is that large-scale SNG in particular consumes vast quantities of water and ZLD (Zero Liquid Discharge) investment increases CAPEX by 2% to 3%. SNG reduces pollution but makes fulfilling CO2 reduction targets more difficult. The Chinese government favors SNG capacity as a means of influencing natural gas pricing.
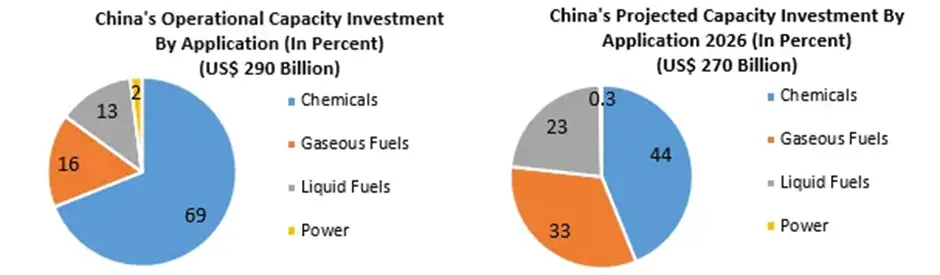
Nearly US$13.16 billion in coal-to-olefins investment from happened in China. The country’s estimated gasification investment is $122 billion through 2026. The plants have the Capacity for integrated and merchant methanol from coal, as well as certain natural gas-based methanol olefins. Methanol and its product dimethyl ether are overcapacities, with utilization rates ranging from 25% to 50%.
Biomass Gasification in Europe:
The total estimated demand for biomass-based gasification is estimated to be 140,351 million British thermal units per day (MMBtu), with the UK accounting for 90,494 MMBtu/d. Finland, Sweden, and the United Kingdom are the key planned destinations for biomass gasification, particularly for the integrated capacity at feedstock-producing sites. Bio-based transportation fuels derived from syngas are generally not considered economically significant.
In Finland, a large-scale proposal (Kaidi) represents a 388% scale-up and innovative use for plasma gasification. With enabling environments such as positive tipping fees, evaluated internal rates of return for bio-based liquids are modest and likely to be found exclusively in Europe. Agricultural leftovers with a favorable cost impact exacerbate economic growth. There are still plenty of harvest residuals available in important European transport fuel markets.
Additionally, Asia's chemical industries present a plethora of potential for the manufacture of fertilizers & petrochemicals. Additionally, major players in the global syngas market are forming strategic alliances to provide businesses with cutting-edge syngas platforms. For instance, Malaysia Marine & Heavy Engineering has chosen Siemen AG, a German multinational conglomerate business, to deliver three mechanical-drive SGT-300 Syngass and three SGT-300 industrial Syngas generators for the PETRONAS Kasawari Gas Field Development Project (GTG). Additionally, a growing population raises the demand for syngas & its derivatives in the production of liquid fuel, gaseous fuel, and electricity using hydrogen as the fuel source. The expansion of businesses and various efforts will fuel the market for Syngas.
Competitive Scenario in the Global Syngas Market
The report provides an in-depth analysis of the market and contains meaningful insights, facts, historical data, and statistically supported and industry-validated market statistics.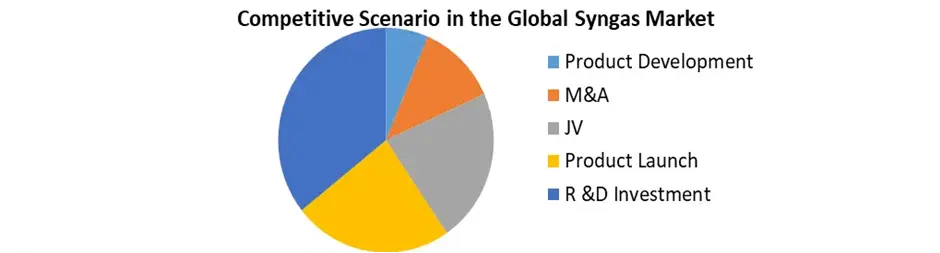 The bottom-up approach has been used to estimate the market size. Key Players in the Syngas & Derivatives market are identified through secondary research and their market revenues are determined through primary and secondary research. Secondary research included a review of annual and financial reports of leading manufacturers, while primary research included interviews with important opinion leaders and industry experts such as skilled front-line personnel, entrepreneurs, and marketing professionals.
Some of the leading key players in the global Syngas market include Sasol Limited, Haldor Topsoe, Air Liquide, and Siemens. They are continuously strategizing on mergers and acquisitions, strategic alliances, joint ventures, and partnerships for the growth of their market shares.
Recent Industry Developments
| Exact Date | Company | Development | Impact |
|---|---|---|---|
| 02 March 2026 | Bharat Petroleum (BPCL) | BPCL signed a long-term agreement with Air Products to develop a major syngas and derivatives plant in India. | This partnership accelerates Asia-Pacific market growth by localizing high-value chemical feedstock production. |
| 11 February 2026 | Topsoe A/S | The company launched the TITAN steam reforming catalyst series, designed to maximize hydrogen yield in large-scale syngas plants. | The technology reduces energy intensity and extends catalyst lifespan, lowering operational costs for global producers. |
| 02 February 2026 | Adani Group | The group initiated work on a ₹70,000 crore coal gasification plant in Maharashtra to produce syngas, ammonia, and hydrogen. | The project represents a massive infrastructure expansion aimed at reducing national dependence on imported chemical intermediates. |
| 15 January 2026 | Linde plc | Linde officially commissioned a new syngas processing facility on the U.S. Gulf Coast to supply high-purity hydrogen and carbon monoxide. | This facility strengthens supply chain reliability for the North American petrochemical and refining sectors. |
| 12 December 2025 | BHEL | BHEL successfully scaled its fluidized bed coal gasification pilot, achieving 99% purity in methanol production from syngas. | The technical milestone proves the commercial viability of cleaner coal-to-fuel pathways for emerging economies. |
| 25 September 2025 | BASF SE | BASF completed the construction of its fully integrated syngas plant at the Zhanjiang Verbund site in China. | The plant utilizes low-carbon procedure concepts, setting a new benchmark for sustainable industrial syngas production. |
Syngas Market Scope: Inquire before buying
| Syngas Market | |||
|---|---|---|---|
| Report Coverage | Details | ||
| Base Year: | 2025 | Forecast Period: | 2026-2032 |
| Historical Data: | 2020 to 2025 | Market Size in 2025: | 76.63 USD Billion |
| Forecast Period 2026-2032 CAGR: | 10.8% | Market Size in 2032: | 157.1 USD Billion |
| Segments Covered: | by Feedstock | Coal Natural Gas Petroleum Pet-coke Biomass |
|
| by Technology | Steam Reforming Partial Oxidation Auto-thermal Reforming Combined or Two-step Reforming Biomass Gasification |
||
| by Gasifier Type | Fixed Bed Entrained Flow Fluidized Bed |
||
| by Application | Power Generation Chemicals Liquid Fuels Others |
||
Syngas Market, by Region
North America (United States, Canada and Mexico)
Europe (UK, France, Germany, Italy, Spain, Sweden, Austria and Rest of Europe)
Asia Pacific (China, South Korea, Japan, India, Australia, Indonesia, Malaysia, Vietnam, Taiwan, Bangladesh, Pakistan and Rest of APAC)
Middle East and Africa (South Africa, GCC, Egypt, Nigeria and Rest of ME&A)
South America (Brazil, Argentina Rest of South America)
Key Players / Competitors Profiles Covered in Brief in Global Syngas Market Report in Strategic Perspective:
- Air Products and Chemicals, Inc.
- McDermott International
- Genesis Energy
- Synthesis Energy Systems
- SunGas Renewables
- Siemens AG
- CF Industries Holdings, Inc.
- Air Liquide S.A.
- Linde plc
- BASF SE
- TechnipFMC PLC
- AHT CleanTec
- Yara International ASA
- Sunfire
- Refuel.green
- Yingde Gases
- Mitsubishi Heavy Industries, Ltd.
- Sasol Limited
- Hualu-Hengsheng
- Shell plc
- Topsoe A/S
- KBR Inc.
- Chiyoda Corporation
- Dow Inc.
- John Wood Group PLC
Frequently Asked Questions
1. What is the projected Syngas Market size and CAGR for the forecast period?
Ans. The syngas market valuation was USD 76.63 billion in 2025, projected to reach USD 157.1 billion by 2032, maintaining a robust 10.8% industry growth CAGR.
2. Which region leads the Syngas Market share analysis through 2032?
Ans. Asia-Pacific dominates the syngas market share analysis, driven by China’s massive coal gasification infrastructure and India’s strategic investments in methanol production for cleaner energy transitions.
3. What are the primary Syngas Market trends 2026 for cost reduction?
Ans. Syngas market trends 2026 highlight membrane technology and TITAN steam reforming catalysts, reducing production expenses by 30% through improved hydrogen yields and oxygen separation efficiency.
4. How is the shift to sustainable fuels impacting industry growth drivers?
Ans. Industry growth drivers include a $1.4 trillion decarbonization investment, pivoting feedstocks toward biomass and RFNBO to meet escalating global demand for sustainable aviation and maritime fuels.
5. Which gasifier technology dominates the Syngas Market revenue share?
Ans. Fluidized bed gasifiers lead Syngas Market revenue due to high cold gas efficiency, feedstock flexibility, and superior performance in biomass gasification and low-reactivity coal processing.
6. What role does coal play in the Syngas Market feedstock analysis?
Ans. Coal remains a critical feedstock, especially in China and India, where high availability and advanced gasification techniques facilitate large-scale methanol, olefin, and chemical production.
7. What are the main Syngas Market challenges for new project developers?
Ans. High capital expenditures, ranging from $25,000 to $45,000 per daily barrel, and complex air separation requirements represent significant entry barriers for new syngas market participants.