
Syngas & Derivatives Market - Industry Structure Evaluation, Demand Drivers Analysis, Regional Growth Analysis and Identification, Competitive Positioning / Landscape Review & Global Market Size Forecast to 2032
Overview
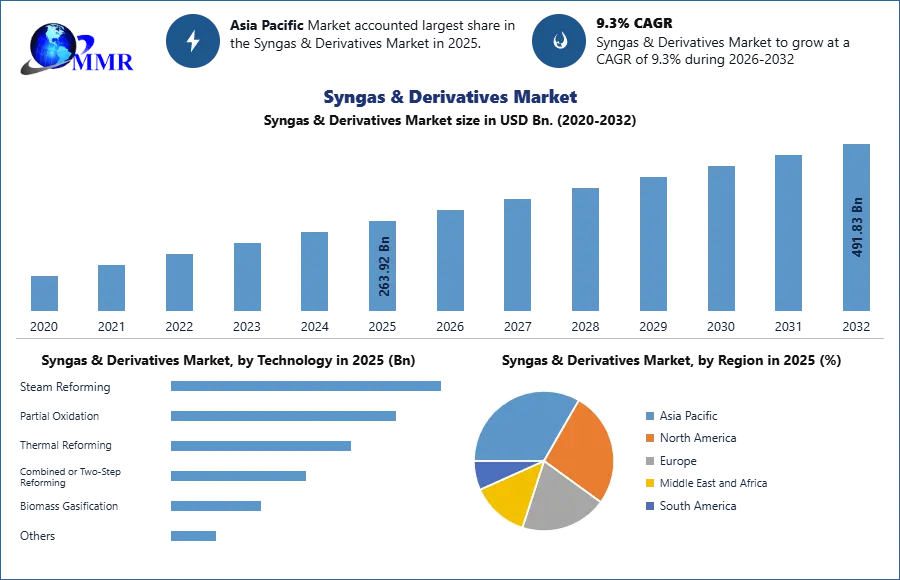
Syngas & Derivatives Market was valued at US$ 263.92 Bn. in 2025 and the total Syngas & Derivatives revenue is expected to grow at 9.3% from 2026 to 2032, reaching nearly US$ 491.83 Bn.
Syngas & Derivatives Market Overview:
The rapid growth of the global economy and the rise in the global oil price have exacerbated the world's energy and environmental concerns. Gas-to-liquid (GTL) techniques such as Fischer-Tropsch (FT) synthesis, methanol synthesis, and dimethyl ether (DME) synthesis have grown in importance and popularity. Aside from producing clean fuel, the results of GTL operations may be turned into a variety of different chemical products.
Although GTL fuels may be made from a variety of feedstocks, using coal or biomass involves more stages and has a greater environmental effect than starting with natural gas. In reality, most European firms have focused on natural gas-to-liquid, whereas nations such as China are primarily interested in starting with coal.
The GTL technology is principally established, while refinements are still required. In Qatar, two major commercial-size GTL plants have been built and are operational. Sasol's Oryx process uses ATR for syngas generation and an FT with Fe catalyst in a fluidized bed reactor (36,000 barrels per day), whereas Shell's PEARL-GTL process uses an uncatalyzed POX process for syngas production and a Co catalyst in a fixed bed reactor (140,000 barrel per day).
Both processes have a lot of room for development and optimization. Certain original stakeholders, such as BP, perceive opportunities to advance conversion technology even further to provide a greater gas-to-products (GTP) portfolio. The huge size of reactors and expenditures required for FT, as well as the expense of syngas and the associated air separation process, are critical challenges. GTL is a high-capital-cost process, with capital costs ranging from $25,000 to $45,000 per daily barrel.
This report analyzes the Syngas & Derivatives Market as the 2026 Middle East crisis triggers a historic realignment of global energy and chemical feedstocks. With Strait of Hormuz disruptions driving crude toward $120/bbl and paralyzing LNG exports, syngas has emerged as a critical pivot for industrial autonomy. We explore the accelerated shift toward coal-to-liquids (CTL) and biomass gasification to bypass volatile petroleum imports. By evaluating the surge in demand for ammonia and methanol derivatives, this study provides decision-makers with strategic frameworks to navigate a landscape where localized, gasification-based production ensures chemical supply-chain resilience amidst unprecedented geopolitical fragmentation.
Syngas & Derivatives Market Report Scope:
The Syngas & Derivatives market is segmented based on Technology, Gasifier Type, Feedstock, Application, and Region. The growth of various segments helps report users in acquiring knowledge of the many growth factors expected to be prevalent throughout the market and develop different strategies to help identify core application areas and the gap in the target market. The report provides an in-depth analysis of the market and contains meaningful insights, facts, historical data, and statistically supported and industry-validated market statistics.
It also includes estimates based on an appropriate set of assumptions and methodologies.
The bottom-up approach has been used to estimate the market size. Key Players in the Syngas & Derivatives market are identified through secondary research and their market revenues are determined through primary and secondary research. Secondary research included a review of annual and financial reports of leading manufacturers, while primary research included interviews with important opinion leaders and industry experts such as skilled front-line personnel, entrepreneurs, and marketing professionals.
Some of the leading key players in the global Syngas & Derivatives market include Sasol Limited, Haldor Topsoe, Air Liquide, and Siemens. They are continuously strategizing on mergers and acquisitions, strategic alliances, joint ventures, and partnerships for the growth of their market shares.
To know about the Research Methodology :- Request Free Sample Report
Syngas & Derivatives Market Dynamics:
Sustainable fuels can produce GHG reductions equivalent to BEVs and can be used in a variety of industries:
Multiple decarbonization strategies are expected to be required to meet aggressive decarbonization objectives. Sustainable fuels, for example, might assist meet such decarbonization ambitions. Biofuels such as hydro-treated vegetable oil (HVO) or bioethanol are examples of sustainable fuels, as are synthetic fuels such as ammonia or methanol.
They may be used in traditional internal combustion engines as drop-in fuels (ICE). Although the long-term costs of using sustainable fuels are expected to be higher than alternatives, the use of 100 percent renewable diesel, such as HVO, can achieve relative life-cycle greenhouse-gas reductions to the use of electric vehicles (EVs), enabling faster decarbonization of current fleets.
The demand for sustainable fuels is expected to triple over the next two decades:
Sustainable fuels are forecast to play an increasingly important role in transport sectors throughout modes, including difficult-to-abate sectors like aviation and heavy-duty road transport. Depending on nations' net-zero ambition levels, the percentage of sustainable fuels in transportation energy consumption might range from 7% to 37% by 2050. Growth in sustainable fuels is predominantly driven by road transport until 2035, when it reaches 290 Mt in the Additional Acceleration scenario, with aviation playing an increasingly important role afterward.
To address the increased demand for sustainable fuels, more sophisticated feedstocks are expected to be required:
After 2035, the expected growth in EV penetration in the transportation sector may result in a decrease in the usage of ICE cars and a corresponding decrease in liquid fuels thus driving the demand for sustainable fuels, in road transport. However, growing requirements in aviation might balance the fuel industry, resulting in further growth of overall demand for sustainable fuels, reaching about 400 Mt by 2050. Growth in edible oils and sugar feedstocks must be carefully balanced with the requirement to fulfill food demand, particularly considering the present food scarcity in Ukraine.
Due to the scarcity of waste oil feedstocks, the global supply cap (30 Mt) is expected to be met in the late 2020s unless purposefully grown numbers of low indirect land use change (ILUC)/cover crops are swiftly ramped up. Indeed, addressing the rising demand for sustainable fuels would necessitate a major increase in the use of feedstocks other than oils and sugars, such as renewable fuels from the non-biological origin (RFNBO) (CO2 and H2 for synthetic fuels) and lingo-cellulosic materials.
Sustainable fuel investments are gaining traction:
With a total investment pipeline of $40 billion to $50 billion planned (of which about 70% is already post-final investment decision), 46 Mt of sustainable-fuels capacity is expected by 2026. However, further expenditures of $1 trillion to $1.4 trillion are required by 2040 to achieve decarbonization targets and regulated demand. In the future decades, financial models may need to address integrated production logic as volumes change from road to aircraft, where production profitability is expected to be determined by supply-demand balance, feedstock availability, and customer appeal.
Cost reduction trends in syngas production:
Syngas generation is a vital component for either FT products or methanol; in both cases, it is the most expensive and energy-intensive stage of the production cycle. Syngas production generally accounts for 50-60% of overall cost, with FT conversion accounting for 25% and product upgrading accounting for 15-25%. Autothermal reforming is the current technology of choice for large-scale FT facilities based on natural gas. The primary expenses of an ATR unit are associated with the production of oxygen. As a result, even though the process is well-established, this is the stage that requires future growth.
Recent advancements in membrane technology for removing H2 and CO2, as well as oxygen separation from the air, bring up new avenues for cost reduction in syngas generation. The syngas plant accounts for around 60-70% of the capital cost of methanol production. To significantly lower the cost, a breakthrough is necessary. The Argonne National Laboratory, in collaboration with Amoco, pioneered the use of membrane technology in the manufacture of syngas, demonstrating that the membrane process could reduce the cost of syngas production by around 30%. Amoco, BP, Praxair, Statoil, and Sasol have announced a collaboration to develop this technology. The Department of Energy of the United States launched an $84 million effort to develop membrane technology for syngas generation.
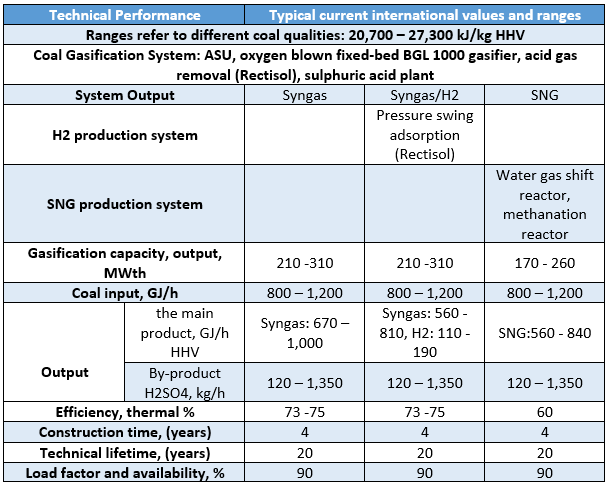
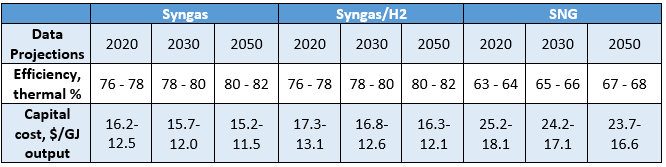
Key Data and Figures for Coal Gasification Technology
Syngas & Derivatives Market Segment Analysis:
By Application, the fuel segment is expected to grow at a CAGR of 10.3% during the forecast period. As aviation transitions from fossil to sustainable fuels, power-to-liquid (PtL) fuel might emerge as a significant alternative, with up to 100 percent reductions in greenhouse gas emissions. PtL fuels are produced by two basic processes: fuel synthesis and methanol to jet. Both necessitate the production of synthesis gas, or "syngas," which is essentially a combination of carbon monoxide and hydrogen. Syngas can be created using co-electrolysis or reverse water gas shift (RWGS). The co-electrolysis process eliminates the need for separate hydrogen production and produces syngas in a single phase, whereas RWGS needs renewable or low-carbon hydrogen as a prelude to syngas generation.
If co-electrolysis can mature as a syngas-generation phase, it will have various advantages over RWGS, including cheaper levelized fuel production costs due to the combined hydrogen and syngas production stages saving expenditure. Because of heat recovery and integration with the fuel synthesis stage, co-electrolysis has the potential to be a more efficient process. Aside from these two approaches, other firms are working with unique and possibly game-changing technologies.
Advances in low-carbon and renewable hydrogen generation will also be critical to the PtL value chain's maturation. Lowering the levelized cost of hydrogen to less than $1 per kilogram (which includes renewable-electricity input but excludes transport and distribution) would cut the cost of PtL to $1,200 to $1,800 per ton, depending on the carbon source, resulting in a 40% reduction in average cost by 2030. While this is still more expensive than fossil jet fuel, it is within the price range of alternative SAFs. Low-carbon hydrogen, often known as "blue," is produced mostly from natural gas using carbon capture and storage, whereas renewable or "green" hydrogen is produced using renewable power.
Low-carbon hydrogen is currently more cost-effective than renewable hydrogen and can be utilized as a transition technology to accelerate PtL scaling. Although low-carbon hydrogen has reduced production costs, producing PtL involves absorbing CO2 twice—once during the hydrogen generation process and again during the fuel synthesis stage. Because this is an inherently inefficient technology, renewable hydrogen can be prioritized for long-term PtL production.
To reduce PtL input prices to less than $15 to $20 per megawatt-hour, rapid R&D is necessary now and in the future, as well as faster-than-anticipated cost drops for renewable power. Annual PtL jet fuel output is expected to rise from around 100,000 tons announced through 2025 to ten million to 105 million tons by 2035, a potential thousand-fold increase within a decade. To fulfill PtL demand, significant capital will be required—possibly a total of $3 trillion to $4 trillion between 2022 and 2050. Because of the capital intensity of PtL, investors are bound to play a large role in production growth.
Syngas & Derivatives Market Regional Insights:
China Leads Syngas Investments in the APAC region:
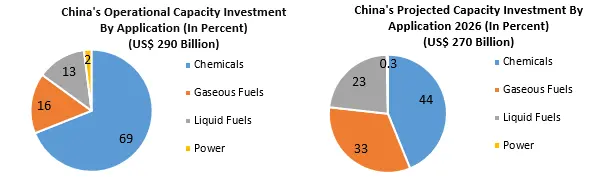
Coal accounts for 1.9 billion tonnes of oil equivalent per year in China's overall primary energy consumption. In the previous decade, China's coal gasification sector has seen rapid commercialization. Overcapacity developed in the late 2000s in coal, steel, fertilizers, methanol, and dimethyl ether. In its most recent Five-Year Plan, China targeted emission and particle reductions, as well as water reutilization technologies. Domestic coal use in China peaked in 2020. The growth of consumer goods production drives rising demand for methanol, olefins, acetyls, and Oxo compounds. Larger-scale projects have been emphasized in China, notably by big oil, gas, coal, and power corporations. Renewables, high-efficiency pulverized coal, and natural gas is becoming more prevalent.
Lower petroleum prices put pressure on coal-to-liquids and synthetic natural gas projects, but there are other forces at play e.g. Lower coal and steel prices, etc. Overall, capital investment intensity is lower than in other nations. The water resource issue is that large-scale SNG in particular consumes vast quantities of water and ZLD (Zero Liquid Discharge) investment increases CAPEX by 2% to 3%. SNG reduces pollution but makes fulfilling CO2 reduction targets more difficult. The Chinese government favors SNG capacity as a means of influencing natural gas pricing.
Nearly US$13.16 billion in coal-to-olefins investment from 2010 to 2023 happened in China. The country’s estimated gasification investment is $122 billion through 2026. The plants have the Capacity for integrated and merchant methanol from coal, as well as certain natural gas-based methanol olefins. Methanol and its product dimethyl ether are overcapacities, with utilization rates ranging from 25% to 50%.
Recent Industry Developments (2025–2026)
| Exact Date | Company | Development | Impact |
|---|---|---|---|
| 23 February 2026 | Haldor Topsoe A/S | The company introduced the TITAN steam reforming catalyst series designed to maximize hydrogen yield from syngas while reducing energy intensity. | This development significantly lowers operational costs and carbon footprints for ammonia and methanol producers. |
| 18 February 2026 | Adani Group | The group initiated work on a ₹70,000 crore coal gasification plant in India focused on syngas and hydrogen production. | The project scales up domestic syngas capacity and reduces national dependence on imported chemical feedstocks. |
| 28 January 2026 | Haffner Energy | Launched the C-iC modular unit line, a flexible system capable of producing renewable syngas and biomethanol from biomass residues. | The modular design lowers CAPEX barriers, enabling rapid deployment of decentralized green syngas production. |
| 12 January 2026 | Linde plc | Commissioned a new state-of-the-art syngas processing plant on the U.S. Gulf Coast to supply high-value chemical derivatives. | This expansion strengthens regional supply chain resilience for downstream methanol and carbon monoxide consumers. |
| 14 May 2025 | Johnson Matthey | Selected to provide methanol synthesis technology and catalysts for a $2 billion biomethanol facility in Louisiana. | The collaboration accelerates the commercialization of low-carbon syngas derivatives for the sustainable fuels market. |
| 10 February 2025 | BASF | Commenced operational integration of its fully integrated syngas plant at the Zhanjiang Verbund site in China. | The facility utilizes low-emission technology to optimize the efficiency of syngas-to-chemicals conversion at a global scale. |
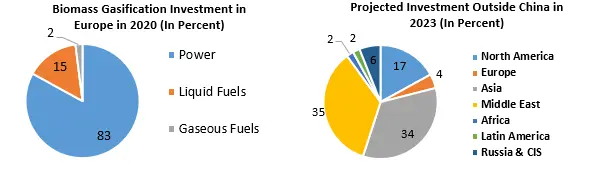
Biomass Gasification in Europe:
The total estimated demand for biomass-based gasification is estimated to be 140,351 million British thermal units per day (MMBtu), with the UK accounting for 90,494 MMBtu/d. Finland, Sweden, and the United Kingdom are the key planned destinations for biomass gasification, particularly for the integrated capacity at feedstock-producing sites. Bio-based transportation fuels derived from syngas are generally not considered economically significant.
In Finland, a large-scale proposal (Kaidi) represents a 388% scale-up and innovative use for plasma gasification. With enabling environments such as positive tipping fees, evaluated internal rates of return for bio-based liquids are modest and likely to be found exclusively in Europe. Agricultural leftovers with a favorable cost impact exacerbate economic growth. There are still plenty of harvest residuals available in important European transport fuel markets.
Key Emerging and Maturing Commercialization Regions in the Industry:
Between 2015 and 2025, global methanol consumption is expected to grow at an unprecedented rate. Demand increased by 23% between late 2013 and late 2018. Capacity additions are expected to be led by China and the United States. Carbon collection and storage is a commercially viable option for IGCC. Improvements in efficiency and technologies like integrated fuel cells are viewed as required for IGCC (Integrated Coal Gasification Combined Cycle) to compete in the future.
This scenario is unlikely in the United States since there have been no new coal-based IGCC plans in the recent five years. A few firms may be able to monetize stranded/remote natural gas by downscaling gas-to-liquids and gas-to-methanol. These are still in their early phases. The United States, India, and Iran are the fastest growing markets for natural gas-based syngas capacity additions. Before 2020, coal was the major syngas feedstock. 65% of new capacity is expected to be added by coal gasification, mostly in China, with 36% of capacity under development.
Syngas & Derivatives Market Scope: Inquire before buying
| Syngas & Derivatives Market | |||
|---|---|---|---|
| Report Coverage | Details | ||
| Base Year: | 2025 | Forecast Period: | 2026-2032 |
| Historical Data: | 2020 to 2025 | Market Size in 2025: | 263.92 USD Bn. |
| Forecast Period 2026-2032 CAGR: | 9.3% | Market Size in 2032: | 491.83 USD Bn. |
| Segments Covered: | by Technology | Steam Reforming Partial Oxidation Thermal Reforming Combined or Two-Step Reforming Biomass Gasification Others |
|
| by Gasifier Type | Fixed (Moving) Bed Gasifier Entrained Flow Gasifier Fluidized Bed Gasifier Others |
||
| by Feedstock | Coal Petroleum Byproducts Natural Gas Biomass/Waste Others |
||
| by Application | Chemicals Fuel Electricity Others |
||
Syngas & Derivatives Market, by Region
North America (United States, Canada and Mexico)
Europe (UK, France, Germany, Italy, Spain, Sweden, Austria, Turkey, Russia and Rest of Europe)
Asia Pacific (China, India, Japan, South Korea, Australia, ASEAN and Rest of APAC)
Middle East and Africa (South Africa, GCC, Egypt, Nigeria and Rest of ME&A)
South America (Brazil, Argentina, Columbia and Rest of South America)
Key Players / Competitors Profiles Covered in Brief in Global Syngas & Derivatives Market Report in Strategic Perspective:
- Air Liquide S.A.
- Air Products and Chemicals Inc.
- BASF SE
- CF Industries Holdings, Inc.
- Chiyoda Corporation
- Dow Inc.
- General Electric Company
- Haldor Topsoe A/S
- KBR Inc.
- Linde plc
- Methanex Corporation
- Mitsubishi Heavy Industries, Ltd.
- Nutrien Ltd.
- Sasol Limited
- Siemens AG
- Synthesis Energy Systems, Inc.
- TechnipFMC PLC
- Yara International ASA
- John Wood Group PLC
- McDermott International, Inc.
- Shell PLC
- ExxonMobil Corporation
- Clariant
- Johnson Matthey
- Haffner Energy
Frequently Asked Questions
1. What is the projected Syngas & Derivatives Market Size and growth forecast?
Ans. The market valuation was US$ 263.92 billion in 2025. It expects a 9.3% CAGR, reaching US$ 491.83 billion by the 2032 Syngas & Derivatives Market Forecast.
2. Which region leads the Syngas & Derivatives Market Share Analysis and why?
Ans. Asia Pacific, specifically China, dominates due to massive coal gasification investments totaling $122 billion through 2026, driven by rising domestic demand for chemicals and methanol.
3. What are the primary Syngas & Derivatives Market Trends 2026 for sustainable fuels?
Ans. Market demand for sustainable fuels is expected to triple, driven by aviation’s transition to power-to-liquid (PtL) technologies and aggressive global carbon reduction mandates through 2035.
4. How is technology impacting Syngas & Derivatives Industry Growth Drivers for cost reduction?
Ans. Advanced membrane technology and co-electrolysis are key drivers, potentially reducing syngas production costs by 30% while lowering the capital intensity of high-value chemical derivative manufacturing.
5. What role does biomass play in the Syngas & Derivatives Market expansion?
Ans. Europe leads biomass gasification, utilizing agricultural residues to produce renewable syngas. Modular units, like Haffner Energy’s C-iC, enable decentralized, low-carbon production to meet regional energy targets.
6. What are the main Syngas & Derivatives Market supply chain challenges?
Ans. High capital expenditures, ranging from $25,000 to $45,000 per daily barrel for GTL, and water scarcity issues in coal-to-liquid projects remain significant barriers to global scaling.
7. Which feedstock is emerging as a leader in Syngas & Derivatives Market?
Ans. While coal remains dominant in China, natural gas-based capacity is growing rapidly in the U.S. and Iran, accounting for 36% of new global capacity developments.