
STATCOM Market by Product, End User and Region - Global Market Size Estimation, Industry-Wide Analysis, Competitive Landscape Assessment & Long-Term Forecast to 2032
Overview
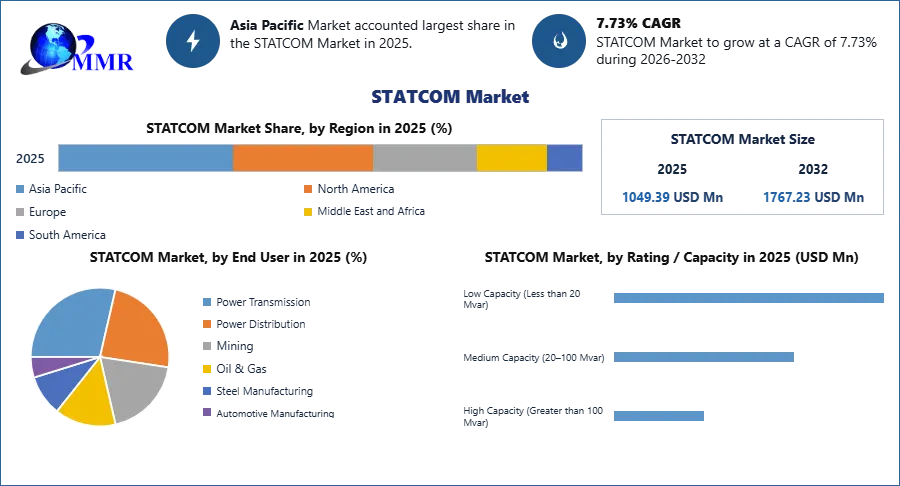
The STATCOM Market size was valued at USD 1049.39 Million in 2025 and the total STATCOM revenue is expected to grow at a CAGR of 7.73% from 2026 to 2032, reaching nearly USD 1767.23 Million.
The report study has analyzed the revenue impact of COVID -19 pandemic on the sales revenue of market leaders, market followers, and market disrupters in the report, and the same is reflected in our analysis.
STATCOM market Definition
A STATCOM stands for static synchronous compensator. It is a voltage regulating device which is generally used in flexible alternating current electricity transmission systems (FACTS). It is also known as STATCON that is static synchronous condenser.
 To know about the Research Methodology :- Request Free Sample Report
STATCOM market Dynamics
A global STATCOM market has witnessed tremendous growth from the past few years. The growth of STATCOM market is attributed to the large scale adoption of STATCOM regulating devices for applications such as in renewable energy markets, wind and solar farms, rolling mills, mining and heavy industry and in electric arc furnaces applications. An increasing demand for electricity in developing economies, rising industrialization and urbanization, rising integration of STATCOM with energy storage devices and ongoing technological advancements in electronics, robotics and automation systems are expected to improve the growth of the market during the forecast period. The STATCOM device provides some benefits such as superior performance, steady voltage of power grid applications and improved transmission capacity, which are ultimately propelling the growth of the market.
However, high initial cost related with installations of STATCOM solutions is the major restraining factor that could hinder the growth of market.
STATCOM Market: Segment Analysis:
By industry, power transmission segment dominated the market in 2025 and is projected to witness fast growth at a CAGR of xx% during the forecast period. A growing installation of STATCOM solutions in transmission grids to provide grid operators with fast response time, enhanced options of functioning voltage, reactive power compensation and small footprints is attributed to the growth of the market. Additionally, benefits such as robust recovery support and high reactive output is making them more demandable in power transmission industry. An increasing need to efficiently transmit and generate power and electricity using transmission line to different consumers across the globe and rising demand to improve the voltage profile of transmission system is expected to impel the growth of the market during the forecast period.
STATCOM Market: Regional Analysis:
Region-wise, Asia Pacific held the largest market share in 2025 and is expected to maintain its dominance at a CAGR of xx% during the forecast period. Countries such as China, Japan, India, and South Korea are the major key contributors behind the growth of the market. The growth is attributed to the rising installations of STATCOM solutions in power grid applications.
Increasing demand for power and electricity in developing economies, rising demand from renewable energy markets such as from solar panel installations, wind farms, solar farms markets and increasing government’s investments and initiatives to provide electricity across the countries is expected to propel the growth of the market in APAC region.
According to MMR study, in June 2018, Siemens Company has commissioned world largest STATCOM solutions with 400 kV and worth of approximately €78 million, at Power Grid Corporation of India’s (PGCIL) substation in Odisha.
In March 2020, NR Electric Co. Ltd has effectively commissioned STATCOM system with 120MVar at Gujirat Energy Transmission Corporation Limited (GETCO) in India.
The objective of the report is to present a comprehensive analysis of the Global STATCOM Market including all the stakeholders of the industry. The past and current status of the industry with forecasted market size and trends are presented in the report with the analysis of complicated data in simple language. The report covers all the aspects of the industry with a dedicated study of key players that includes market leaders, followers and new entrants. PORTER, SVOR, PESTEL analysis with the potential impact of micro-economic factors of the market have been presented in the report. External as well as internal factors that are supposed to affect the business positively or negatively have been analyzed, which will give a clear futuristic view of the industry to the decision-makers.
The report also helps in understanding Global STATCOM Market dynamics, structure by analyzing the market segments and projects the Global STATCOM Market. Clear representation of competitive analysis of key players by Application, price, financial position, Product portfolio, growth strategies, and regional presence in the Global STATCOM Market make the report investor’s guide.
Recent Industry Developments
| Exact Date | Company | Development | Impact |
|---|---|---|---|
| 10 December 2025 | ABB | Completed the acquisition of Gamesa Electric, a specialist in power electronics and wind converters, from Siemens Gamesa. | Significantly strengthens ABB's portfolio in reactive power compensation and converter technology for the global renewable energy sector. |
| 14 January 2026 | Hitachi Energy | Announced the commercialization of its high-efficiency modular STATCOM units featuring response times below 5 ms. | Sets a new industry benchmark for ultra-fast voltage stabilization in grids with high solar and wind penetration. |
| 20 February 2025 | Siemens Energy | Launched the SVC PLUS next-generation series, integrating IGBT-based technology for ±300 MVAR capacity. | Improves grid resilience by providing superior power quality in a more compact, modular footprint. |
| 07 April 2025 | ABB | Introduced a 7200A Emax 2 integrated switchgear solution specifically designed for large-scale wind farm STATCOM systems. | Enables the integration of higher-yield turbines while maintaining the highest levels of switching efficiency and reliability. |
| 18 March 2026 | GE Vernova | Commissioned a major High-Voltage STATCOM project in North America to support the decarbonization of state-level transmission grids. | Demonstrates market leadership in large-scale utility projects aimed at reaching net-zero greenhouse gas targets. |
STATCOM Market Scope: Inquire before buying
| STATCOM Market | |||
|---|---|---|---|
| Report Coverage | Details | ||
| Base Year: | 2025 | Forecast Period: | 2026-2032 |
| Historical Data: | 2020 to 2025 | Market Size in 2025: | 1049.39 USD Mn |
| Forecast Period 2026-2032 CAGR: | 7.73% | Market Size in 2032: | 1767.23 USD Mn |
| Segments Covered: | by Rating / Capacity | Low Capacity (Less than 20 Mvar) Medium Capacity (20–100 Mvar) High Capacity (Greater than 100 Mvar) |
|
| by End User | Power Transmission Power Distribution Mining Oil & Gas Steel Manufacturing Automotive Manufacturing |
||
| by Installation Type | Utility Scale Industrial Renewable Energy Integration |
||
STATCOM Market, by Region
North America (United States, Canada and Mexico)
Europe (UK, France, Germany, Italy, Spain, Sweden, Austria and Rest of Europe)
Asia Pacific (China, South Korea, Japan, India, Australia, Indonesia, Malaysia, Vietnam, Taiwan, Bangladesh, Pakistan and Rest of APAC)
Middle East and Africa (South Africa, GCC, Egypt, Nigeria and Rest of ME&A)
South America (Brazil, Argentina Rest of South America)
Key Players / Competitors Profiles Covered in Brief in Global STATCOM Market Report in Strategic Perspective:
- Bharat Heavy Electricals Limited
- General Electric India Ltd.
- Veeral Controls Pvt. Ltd
- NR Energy Solutions India Pvt. Ltd.
- Ingeteam, Inc.
- Siemens AG
- Toshiba Corporation
- NR Electric Co., Ltd.
- ABB
- Hitachi Energy
- Mitsubishi Electric Corporation
- GE Vernova
- Sieyuan Electric Co., Ltd.
- Hyosung Heavy Industries
- American Superconductor (AMSC)
- Eaton Corporation
- RXHK (Rongxin Huiko Electric Co., Ltd.)
- TBEA Co., Ltd.
- Windsun Science & Technology Co., Ltd.
- Merus Power
- Nari Technology Co., Ltd.
- Shenzhen Hopewind Electric Co., Ltd.
- Shandong Taikai Power Electronic Co., Ltd.
- Anhui Zhongdian Electric
- Beijing In-power Electric Co., Ltd.