Smart Material Market: Material & Chemical Analysis and Forecast (2024-2030) Trends, Statistics, Dynamics, Segmentation by type, application

The Smart Materials Market size was valued at USD 65.3 Billion in 2023 and the total Smart Materials Market revenue is expected to grow at a CAGR of 14.9% from 2023 to 2030, reaching nearly USD 172.64 Billion in 2030. Objectives: Maximize Market Research conducted a brief analysis of the Smart Material Market. The purpose of the research is to provide stakeholders in the industry with a thorough insight into the Smart Material Market. The analysis examines all areas of the industry, with a focus on significant companies such as market leaders, followers, and newcomers. The research is an investor's guide since it depicts the competitive analysis of major competitors in the Smart Materials Market by product, price, financial situation, product portfolio, growth plans, and geographical presence. Smart Materials that instantly transform from a liquid to a semi-solid in the presence of an external magnetic field, or they change shape or size by giving a small amount of heat, are considered smart materials. The smart materials market continues to grow as research and development teams focus on enhancing material properties, scalability, and cost-effectiveness. With advancements in nanotechnology, additive manufacturing, and IoT integration, applications of smart materials are expected to grow and create new opportunities for industries. Apple is the leading company in the smartwatch industry in terms of shipment share, accounting for 22 % of global shipments as of the second quarter of 2023. The growing use of piezoelectric devices and the development of tires with shape memory alloys will have a significant impact on the growth of the Smart Material Market. Smart Materials are utilized in applications, like transducers, actuators and engines, and structural materials. Smart material items like protection and aviation, cars, shoppers, and hardware. The widely used are polylactic acid (PLA), thermoplastics, polylactic acid (PLA), and acrylonitrile butadiene styrene (ABS), which are used in mobile phone casings, toys, and car bodies. Smart materials are very useful in 4D printers. As the public becomes more aware of the benefits of smart materials and their adoption across various zones is expected to accelerate the Smart Material Market. Asia-Pacific is the fastest-growing region with a market share of over 33.5% in 2023. The region is expected to grow at a CAGR of 6.4% during the forecast period and maintain its dominance by 2030. The Asia-Pacific region is showing striking development, owing to the increasing demand from end-use industries in countries such as Japan, India, and China, and significant research and development activities supported by the government. The increasing development of disposable income, cost-competitive production, and increasing domestic demand for smart materials.Smart Material Market
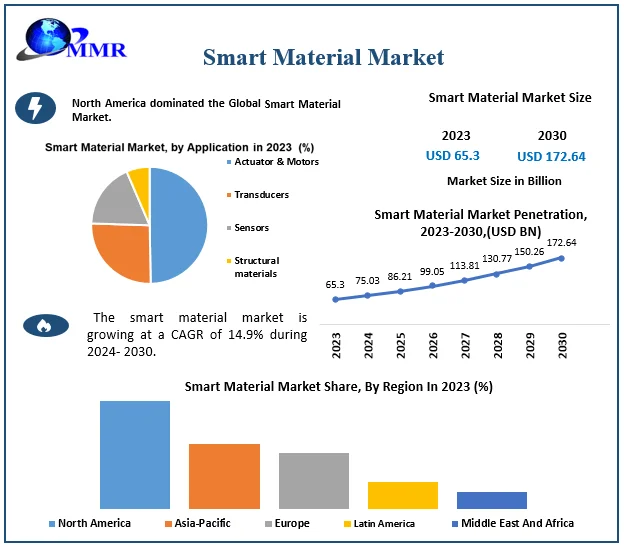
To know about the Research Methodology :- Request Free Sample Report

Smart Materials Market Dynamics:

The increasing investments in medical instruments Some specific groups of industries, like small and medium enterprises (SMEs) less using the adoption of smart materials owing to high cost. The Government introduced some initiatives and programs to encourage industries to invest in smart materials during the forecast periods. According to MMR, global healthcare expenses have been continuously rising, In the United States, healthcare spending reached $6.8 trillion in 2022, representing approximately 21.7% of Gross domestic product. The increased investments in healthcare infrastructure include the allocation of medical instruments to improve diagnostic capabilities, treatment effectiveness, and patient results. Growing Ageing Population: In developing countries, the world’s population aging is increasing, the United Countries shows that the proportion of people aged 65 and above is increasing significantly. Smart materials have increased in improvement traction in older population-centric products. A demand for advanced medical instruments to diagnose and treat age-related diseases such as cancer, neurological disorders, and cardiovascular diseases. Smart materials help reduce daily routine complexities and easier life for old-aged people. So, the population of the old age group is projected to increase at a major rate and is expected to increase demand for smart materials products.Smart Material Market1
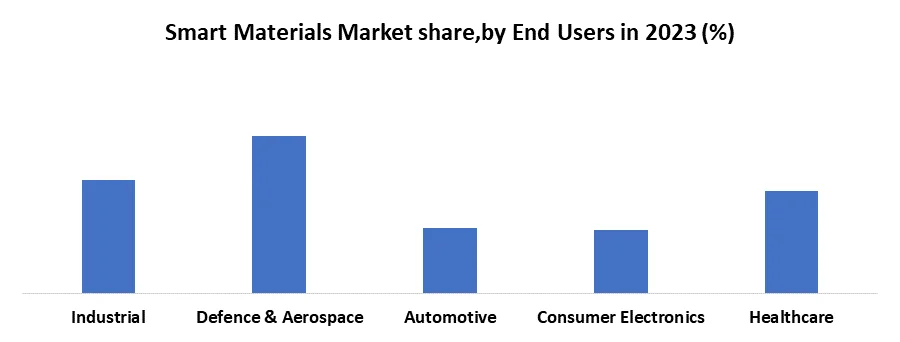
High Manufacturing Expenses More expensive manufacturing expenses can arise from the use of advanced technologies and industrial methods in the development of smart materials. Smart materials are majorly more costly than conventional materials because they require very complex synthesis techniques and specific equipment. Incorporating of smart materials into current system or the development of new application require significant investment, acting as a restraint for adoption of Smart Material Market.

Smart Materials Market Segment Analysis:

Based on Type, the Piezoelectric Material segment held the largest market share of about 24.16% in the Smart Materials Market in 2023. According to the MMR analysis, the segment is expected to grow at a CAGR of 7.3% during the forecast period and maintain its dominance till 2030. Piezoelectric materials dominated because of large scale useful in generating electricity and automotive industries, and also applicable in non-destructive testing, ultrasound equipments. Shape Memory Alloy have fastest growing segment in forecast period. Thanks to the fast rising in clinical fragments like stents and dental supports, clinical materials, prosthetics and machines.Smart Material Market2
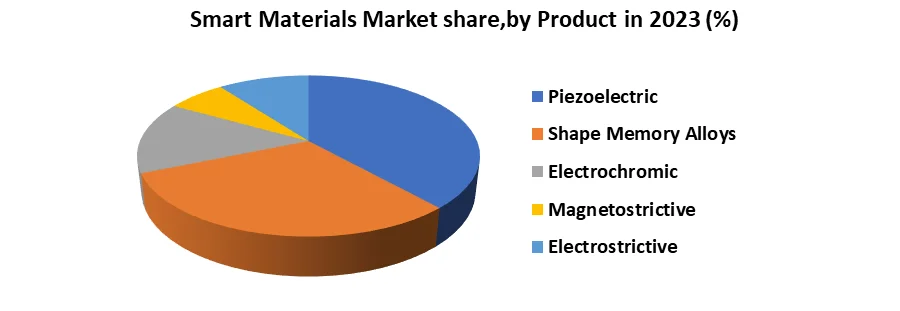
Based on Applications, the Actuators and motors segment held the largest market share of about 36.4% in the Smart Materials market in 2023 and is expected to maintain its dominance till 2030. Rising demand for Actuators and Motors, which are useful in enhancing vehicle performance, and fuel efficiency. It is applicable in automotive, aerospace, and defense industries such as the materials that convert electrical or other stimuli into physical movement, mostly used in robotics.

Smart Materials Market of Regional Insights:

 North America region dominates the Smart Materials Market with the largest market share accounting for 47.81 % in 2023, the region is expected to grow during the forecast period and maintain its dominance by 2030. The North American region is a significant market because widely used in a field in robotics, aerospace, biomedical, and automotive applications. The Government initiatives support the Research and Development infrastructure for Smart Materials. Smart Material adopting in healthcare industries useful in drug delivery systems, tissue engineering, and biosensors for patient health track.Smart Material Market3
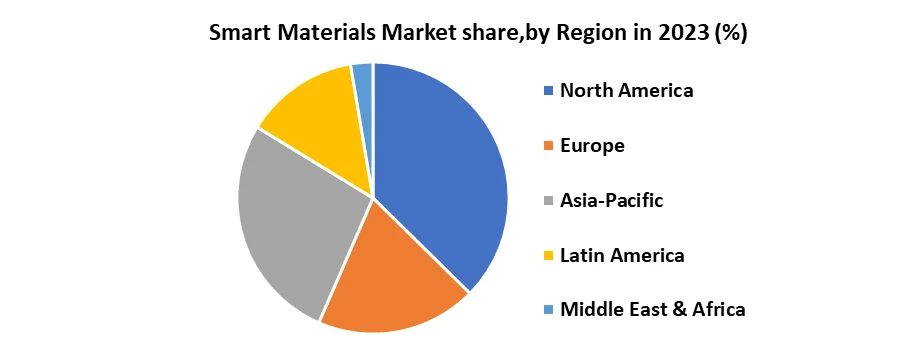
Europe held a market share of about 22.5% in the Smart Material Market in 2023 and is expected CAGR 6.9% to maintain its dominance till 2030. In Europe automotive industry uses smart materials as lightweight metal to minimize fuel intake. Increasing demand for electric, plug-in, and hybrid electric vehicles, so smart material market development is increasing in the future. 

Competitive Landscape for Smart Materials Market:

The rapid industrialization in developing countries like China and India, smart materials have become increasingly popular in a variety of industries, including manufacturing, automotive, and construction. It is estimated that key players have major growth prospects in the growing usage of smart materials in the defense and aerospace industries as well as healthcare. The leading players in the Smart Materials Market include Ceram Tec, CTS Corporation, Harris Corporation, LORD Corporation Piezo Kinetics, Inc. The companies are adopting development strategies such as new product launches and developing their product portfolio and productivity. In March 2023, Kyocera Corporation has the acquisition of AVX Corp., a U.S.-based electronic component manufacturing company. Kyocera formerly owned about 74% of AVX’s outstanding shares, so by completion of the merger, AVX became a fully owned subsidiary of Kyocera. In May 2022, TDK in Tokyo, Japan manufactured the iron-based magnetic substance ferrite which was invented by Yogoro Kato and Takeshi Takei. TDK Corporation announced an investment in XCOM Labs, a wireless technology developer based in the United States through its subsidiary Ventures Inc. The money is used to create 5G and wireless communications systems with an emphasis on bandwidth capacity.

Smart Material Market Scope: Inquire before buying

Global Smart Material Market
Report Coverage Details
Base Year: 2023 Forecast Period: 2024-2030
Historical Data: 2018 to 2023 Market Size in 2023: US $ 66.3 Bn.
Forecast Period 2024 to 2030 CAGR: 14.9% Market Size in 2030: US $ 172.64 Bn.
Segments Covered: by Product Piezoelectric Shape Memory Alloys Electrostrictive Magnetostrictive Electrochromic
by Application Transducers Actuators & Motors Sensors Structural Materials Coatings
by End User Industrial Defense & Aerospace Automotive Consumer Electronics Healthcare Other (Civil Engineering and Retail)

Smart Material Market, by Region

North America (United States, Canada and Mexico) Europe (UK, France, Germany, Italy, Spain, Sweden, Austria and Rest of Europe) Asia Pacific (China, South Korea, Japan, India, Australia, Indonesia, Malaysia, Vietnam, Taiwan, Bangladesh, Pakistan and Rest of APAC) Middle East and Africa (South Africa, GCC, Egypt, Nigeria and Rest of ME&A) South America (Brazil, Argentina Rest of South America)

Smart Material Market Key Players are:

1. Ceram Tec 2. Kyocera Corporation 3. APC International, Ltd. 4. Harris Corporation 5. TDK Corporation 6. NOLIAC A/S 7. AMETEK Inc. 8. CTS Corporation 9. Harris Corporation 10. LORD Corporation 11. Piezo Kinetics, Inc. 12. Smart Material Corp. 13. TDK U.S.A. Corporation 14. MURATA 15. Solvay 16. Johnson Matthey 17. Arkema 18. Meggitt Sensing 19. Saes Getters 20. Fort Wayne Metals 21. View 22. Chromogenic 23. Gentex Corporation Frequently Asked Questions: 1) What was the market size of Global Smart Material Market markets in 2023? Ans - The Global Smart Material Market was worth US$ 65.3 Bn in 2023. 2) What is the market segment of Global Smart Material Market markets? Ans -The market segments are based on Product, Application, and End-user 3) What is the forecast period considered for the Global Smart Material Market? Ans -The forecast period for the Global Smart Material Market is 2024 to 2030. 4) Which are the worldwide major key players covered in the Global Smart Material Market report? Ans - APC International, Ltd., Harris Corporation, CeramTec, Kyocera Corporation, TDK Corporation, NOLIAC A/S, AMETEK Inc., CeramTec, CTS Corporation, Harris Corporation, KYOCERA Corporation, LORD Corporation, Piezo Kinetics, Inc, SMART MATERIAL CORP., TDK U.S.A. Corporation, MURATA, Solvay, Johnson Matthey, Arkema, Meggitt Sensing 5) Which region is dominated in the Global Smart Material Market? Ans- The North American region dominated the Global Smart Material Market.
1. Smart Materials Market: Research Methodology 2. Smart Materials Market 3. Introduction 3.1. Study Assumption and Market Definition 3.2. Scope of the Study 3.3. Executive Summary 4. Smart Materials Market: Dynamics 4.1. Global Smart Materials Market Trends by Region 4.1.1. North America Smart Materials Market Trends 4.1.2. Europe Smart Materials Market Trends 4.1.3. Asia Pacific Smart Materials Market Trends 4.1.4. Middle East and Africa Smart Materials Market Trends 4.1.5. South America Smart Materials Market Trends 4.2. Global Smart Materials Market Dynamics by Region 4.2.1. North America 4.2.1.1. North America Smart Materials Market Drivers 4.2.1.2. North America Smart Materials Market Restraints 4.2.1.3. North America Smart Materials Market Opportunities 4.2.1.4. North America Smart Materials Market Challenges 4.2.2. Europe 4.2.2.1. Europe Smart Materials Market Drivers 4.2.2.2. Europe Smart Materials Market Restraints 4.2.2.3. Europe Smart Materials Market Opportunities 4.2.2.4. Europe Smart Materials Market Challenges 4.2.3. Asia Pacific 4.2.3.1. Asia Pacific Smart Materials Market Drivers 4.2.3.2. Asia Pacific Smart Materials Market Restraints 4.2.3.3. Asia Pacific Smart Materials Market Opportunities 4.2.3.4. Asia Pacific Smart Materials Market Challenges 4.2.4. Middle East and Africa 4.2.4.1. Middle East and Africa Smart Materials Market Drivers 4.2.4.2. Middle East and Africa Smart Materials Market Restraints 4.2.4.3. Middle East and Africa Smart Materials Market Opportunities 4.2.4.4. Middle East and Africa Smart Materials Market Challenges 4.2.5. South America 4.2.5.1. South America Smart Materials Market Drivers 4.2.5.2. South America Smart Materials Market Restraints 4.2.5.3. South America Smart Materials Market Opportunities 4.2.5.4. South America Smart Materials Market Challenges 4.3. PORTER’s Five Forces Analysis 4.4. PESTLE Analysis 4.5. Regulatory Landscape by Region 4.5.1. North America 4.5.2. Europe 4.5.3. Asia Pacific 4.5.4. Middle East and Africa 4.5.5. South America 4.6. Analysis of Government Schemes and Initiatives For the Smart Materials Industry 5. Smart Material Market: Global Market Size and Forecast by Segmentation (by Value) (2023-2030) 5.1. Smart Materials Market Size and Forecast, by Product (2023-2030) 5.1.1. Piezoelectric 5.1.2. Shape Memory Alloys 5.1.3. Electrostrictive 5.1.4. Magnetostrictive 5.1.5. Electrochromic 5.2. Smart Materials Market Size and Forecast, by Application (2023-2030) 5.2.1. Transducers 5.2.2. Actuators & Motors 5.2.3. Sensors 5.2.4. Structural Materials 5.2.5. Coatings 5.3. Smart Materials Market Size and Forecast, by End Users (2023-2030) 5.3.1. Industrial 5.3.2. Defense & Aerospace 5.3.3. Automotive 5.3.4. Consumer Electronics 5.3.5. Healthcare 5.4. Smart Materials Market Size and Forecast, by Region (2023-2030) 5.4.1. North America 5.4.2. Europe 5.4.3. Asia Pacific 5.4.4. Middle East and Africa 5.4.5. South America 6. North America Smart Materials Market Size and Forecast (by Value in USD Billion) (2023-2030) 6.1. North America Smart Materials Market Size and Forecast, by Product (2023-2030) 6.1.1. Piezoelectric 6.1.2. Shape Memory Alloys 6.1.3. Electrostrictive 6.1.4. Magnetostrictive 6.1.5. Electrochromic 6.2. North America Smart Materials Market Size and Forecast, by Application (2023-2030) 6.2.1. Transducers 6.2.2. Actuators & Motors 6.2.3. Sensors 6.2.4. Structural Materials 6.2.5. Coatings 6.3. North America Smart Materials Market Size and Forecast, by End Users (2023-2030) 6.3.1. Industrial 6.3.2. Defense & Aerospace 6.3.3. Automotive 6.3.4. Consumer Electronics 6.3.5. Healthcare 6.4. North America Smart Materials Market Size and Forecast, by Country (2023-2030) 6.4.1. United States 6.4.1.1. United States Smart Materials Market Size and Forecast, by Product (2023-2030) 6.4.1.1.1. Piezoelectric 6.4.1.1.2. Shape Memory Alloys 6.4.1.1.3. Electrostrictive 6.4.1.1.4. Magnetostrictive 6.4.1.1.5. Electrochromic 6.4.1.2. United States Smart Materials Market Size and Forecast by Application (2023-2030) 6.4.1.2.1. Transducers 6.4.1.2.2. Actuators & Motors 6.4.1.2.3. Sensors 6.4.1.2.4. Structural Materials 6.4.1.2.5. Coatings 6.4.1.3. United States Smart Materials Market Size and Forecast, by End Users (2023-2030) 6.4.1.3.1. Industrial 6.4.1.3.2. Defense & Aerospace 6.4.1.3.3. Automotive 6.4.1.3.4. Consumer Electronics 6.4.1.3.5. Healthcare 6.4.2. Canada 6.4.2.1. Canada Smart Materials Market Size and Forecast, by Product (2023-2030) 6.4.2.1.1. Piezoelectric 6.4.2.1.2. Shape Memory Alloys 6.4.2.1.3. Electrostrictive 6.4.2.1.4. Magnetostrictive 6.4.2.1.5. Electrochromic 6.4.2.2. Canada Smart Materials Market Size and Forecast, by Application (2023-2030) 6.4.2.2.1. Transducers 6.4.2.2.2. Actuators & Motors 6.4.2.2.3. Sensors 6.4.2.2.4. Structural Materials 6.4.2.2.5. Coating 6.4.2.3. Canada Smart Materials Market Size and Forecast, by End Users (2023-2030) 6.4.2.3.1. Industrial 6.4.2.3.2. Defense & Aerospace 6.4.2.3.3. Automotive 6.4.2.3.4. Consumer Electronics 6.4.2.3.5. Healthcare 6.4.3. Mexico 6.4.3.1. Mexico Smart Materials Market Size and Forecast, by Product (2023-2030) 6.4.3.1.1. Piezoelectric 6.4.3.1.2. Shape Memory Alloys 6.4.3.1.3. Electrostrictive 6.4.3.1.4. Magnetostrictive 6.4.3.1.5. Electrochromic 6.4.3.2. Mexico Smart Materials Market Size and Forecast, by Application (2023-2030) 6.4.3.2.1. Transducers 6.4.3.2.2. Actuators & Motors 6.4.3.2.3. Sensors 6.4.3.2.4. Structural Materials 6.4.3.2.5. Coatings 6.4.3.3. Mexico Smart Materials Market Size and Forecast, by End Users (2023-2030) 6.4.3.3.1. Industrial 6.4.3.3.2. Defense & Aerospace 6.4.3.3.3. Automotive 6.4.3.3.4. Consumer Electronics 6.4.3.3.5. Healthcare 7. Europe Smart Materials Market Size and Forecast by Segmentation (by Value in USD Billion) (2023-2030) 7.1. Europe Smart Materials Market Size and Forecast, by Product (2023-2030) 7.2. Europe Smart Materials Market Size and Forecast, by Application (2023-2030) 7.3. Europe Smart Materials Market Size and Forecast, by End Users (2023-2030) 7.4. Europe Smart Materials Market Size and Forecast, by Country (2023-2030) 7.4.1. United Kingdom 7.4.1.1. United Kingdom Smart Materials Market Size and Forecast, by Product (2023-2030) 7.4.1.2. United Kingdom Smart Materials Market Size and Forecast, by Application (2023-2030) 7.4.1.3. United Kingdom Smart Materials Market Size and Forecast, by End Users (2023-2030) 7.4.2. France 7.4.2.1. France Smart Materials Market Size and Forecast, by Product (2023-2030) 7.4.2.2. France Smart Materials Market Size and Forecast, by Application (2023-2030) 7.4.2.3. France Smart Materials Market Size and Forecast, by End Users (2023-2030) 7.4.3. Germany 7.4.3.1. Germany Smart Materials Market Size and Forecast, by Product (2023-2030) 7.4.3.2. Germany Smart Materials Market Size and Forecast by Application (2023-2030) 7.4.3.3. Germany Smart Materials Market Size and Forecast, by End Users (2023-2030) 7.4.4. Italy 7.4.4.1. Italy Smart Materials Market Size and Forecast, by Product (2023-2030) 7.4.4.2. Italy Smart Materials Market Size and Forecast by Application (2023-2030) 7.4.4.3. Italy Smart Materials Market Size and Forecast, by End Users (2023-2030) 7.4.5. Spain 7.4.5.1. Spain Smart Materials Market Size and Forecast, by Product (2023-2030) 7.4.5.2. Spain Smart Materials Market Size and Forecast, by Application (2023-2030) 7.4.5.3. Spain Smart Materials Market Size and Forecast, by End Users (2023-2030) 7.4.6. Sweden 7.4.6.1. Sweden Smart Materials Market Size and Forecast, by Product (2023-2030) 7.4.6.2. Sweden Smart Materials Market Size and Forecast, by Application (2023-2030) 7.4.6.3. Sweden Smart Materials Market Size and Forecast, by End Users (2023-2030) 7.4.7. Austria 7.4.7.1. Austria Smart Materials Market Size and Forecast, by Product (2023-2030) 7.4.7.2. Austria Smart Materials Market Size and Forecast, by Application (2023-2030) 7.4.7.3. Austria Smart Materials Market Size and Forecast, by End Users (2023-2030) 7.4.8. Rest of Europe 7.4.8.1. Rest of Europe Smart Materials Market Size and Forecast, by Product (2023-2030) 7.4.8.2. Rest of Europe Smart Materials Market Size and Forecast, by Application (2023-2030) 7.4.8.3. Rest of Europe Smart Materials Market Size and Forecast, by End Users (2023-2030) 8. Asia Pacific Smart Materials Market Size and Forecast by Segmentation (by Value in USD Billion) (2023-2030) 8.1. Asia Pacific Smart Materials Market Size and Forecast, by Product (2023-2030) 8.2. Asia Pacific Smart Materials Market Size and Forecast, by Application (2023-2030) 8.3. Asia Pacific Smart Materials Market Size and Forecast, by End Users (2023-2030) 8.4. Asia Pacific Smart Materials Market Size and Forecast, by Country (2023-2030) 8.4.1. China 8.4.1.1. China Smart Materials Market Size and Forecast, by Product (2023-2030) 8.4.1.2. China Smart Materials Market Size and Forecast, by Application (2023-2030) 8.4.1.3. China Smart Materials Market Size and Forecast, by End Users (2023-2030) 8.4.2. S Korea 8.4.2.1. S Korea Smart Materials Market Size and Forecast, by Product (2023-2030) 8.4.2.2. S Korea Smart Materials Market Size and Forecast, by Application (2023-2030) 8.4.2.3. S Korea Smart Materials Market Size and Forecast, by End Users (2023-2030) 8.4.3. Japan 8.4.3.1. Japan Smart Materials Market Size and Forecast, by Product (2023-2030) 8.4.3.2. Japan Smart Materials Market Size and Forecast, by Application (2023-2030) 8.4.3.3. Japan Smart Materials Market Size and Forecast, by End Users (2023-2030) 8.4.4. India 8.4.4.1. India Smart Materials Market Size and Forecast, by Product (2023-2030) 8.4.4.2. India Smart Materials Market Size and Forecast, by Application (2023-2030) 8.4.4.3. India Smart Materials Market Size and Forecast, by End Users (2023-2030) 8.4.5. Australia 8.4.5.1. Australia Smart Materials Market Size and Forecast, by Product (2023-2030) 8.4.5.2. Australia Smart Materials Market Size and Forecast, by Application (2023-2030) 8.4.5.3. Australia Smart Materials Market Size and Forecast, by End Users (2023-2030) 8.4.6. Indonesia 8.4.6.1. Indonesia Smart Materials Market Size and Forecast, by Product (2023-2030) 8.4.6.2. Indonesia Smart Materials Market Size and Forecast, by Application (2023-2030) 8.4.6.3. Indonesia Smart Materials Market Size and Forecast, by End Users (2023-2030) 8.4.7. Malaysia 8.4.7.1. Malaysia Smart Materials Market Size and Forecast, by Product (2023-2030) 8.4.7.2. Malaysia Smart Materials Market Size and Forecast, by Application (2023-2030) 8.4.7.3. Malaysia Smart Materials Market Size and Forecast, by End Users (2023-2030) 8.4.8. Vietnam 8.4.8.1. Vietnam Smart Materials Market Size and Forecast, by Product (2023-2030) 8.4.8.2. Vietnam Smart Materials Market Size and Forecast, by Application (2023-2030) 8.4.8.3. Vietnam Smart Materials Market Size and Forecast, by End Users (2023-2030) 8.4.9. Taiwan 8.4.9.1. Taiwan Smart Materials Market Size and Forecast, by Product (2023-2030) 8.4.9.2. Taiwan Smart Materials Market Size and Forecast, by Application (2023-2030) 8.4.9.3. Taiwan Smart Materials Market Size and Forecast, by End Users (2023-2030) 8.4.10. Rest of Asia Pacific 8.4.10.1. Rest of Asia Pacific Smart Materials Market Size and Forecast, by Product (2023-2030) 8.4.10.2. Rest of Asia Pacific Smart Materials Market Size and Forecast, by Application (2023-2030) 8.4.10.3. Rest of Asia Pacific Smart Materials Market Size and Forecast, by End Users (2023-2030) 9. Middle East and Africa Smart Materials Market Size and Forecast by Segmentation (by Value in USD Billion) (2023-2030) 9.1. Middle East and Africa Smart Materials Market Size and Forecast, by Product (2023-2030) 9.2. Middle East and Africa Smart Materials Market Size and Forecast, by Application (2023-2030) 9.3. Middle East and Africa Smart Materials Market Size and Forecast, by End Users (2023-2030) 9.4. Middle East and Africa Smart Materials Market Size and Forecast, by Country (2023-2030) 9.4.1. South Africa 9.4.1.1. South Africa Smart Materials Market Size and Forecast, by Product (2023-2030) 9.4.1.2. South Africa Smart Materials Market Size and Forecast, by Application (2023-2030) 9.4.1.3. South Africa Smart Materials Market Size and Forecast, by End Users (2023-2030) 9.4.2. GCC 9.4.2.1. GCC Smart Materials Market Size and Forecast, by Product (2023-2030) 9.4.2.2. GCC Smart Materials Market Size and Forecast by Application (2023-2030) 9.4.2.3. GCC Smart Materials Market Size and Forecast, by End Users (2023-2030) 9.4.3. Nigeria 9.4.3.1. Nigeria Smart Materials Market Size and Forecast, by Product (2023-2030) 9.4.3.2. Nigeria Smart Materials Market Size and Forecast, by Application (2023-2030) 9.4.3.3. Nigeria Smart Materials Market Size and Forecast, by End Users (2023-2030) 9.4.4. Rest of ME&A 9.4.4.1. Rest of ME&A Smart Materials Market Size and Forecast, by Product (2023-2030) 9.4.4.2. Rest of ME&A Smart Materials Market Size and Forecast, by Application (2023-2030) 9.4.4.3. Rest of ME&A Smart Materials Market Size and Forecast, by End Users (2023-2030) 10. South America Smart Materials Market Size and Forecast by Segmentation (by Value in USD Billion) (2023-2030) 10.1. South America Smart Materials Market Size and Forecast, by Product (2023-2030) 10.2. South America Smart Materials Market Size and Forecast, by Application (2023-2030) 10.3. South America Smart Materials Market Size and Forecast, by End Users (2023-2030) 10.4. South America Smart Materials Market Size and Forecast, by Country (2023-2030) 10.4.1. Brazil 10.4.1.1. Brazil Smart Materials Market Size and Forecast, by Product (2023-2030) 10.4.1.2. Brazil Smart Materials Market Size and Forecast, by Application (2023-2030) 10.4.1.3. Brazil Smart Materials Market Size and Forecast, by End Users (2023-2030) 10.4.2. Argentina 10.4.2.1. Argentina Smart Materials Market Size and Forecast, by Product (2023-2030) 10.4.2.2. Argentina Smart Materials Market Size and Forecast, by Application (2023-2030) 10.4.2.3. Argentina Smart Materials Market Size and Forecast, by End Users (2023-2030) 10.4.3. Rest Of South America 10.4.3.1. Rest Of South America Smart Materials Market Size and Forecast, by Product (2023-2030) 10.4.3.2. Rest Of South America Smart Materials Market Size and Forecast, by Application (2023-2030) 10.4.3.3. Rest Of South America Smart Materials Market Size and Forecast, by End Users (2023-2030) 11. Smart Materials Market: Competitive Landscape 11.1. MMR Competition Matrix 11.2. Competitive Landscape 11.3. Key Players Benchmarking 11.3.1. Company Name 11.3.2. Product Segment 11.3.3. End-user Segment 11.3.4. Revenue (2023) 11.3.5. Company Locations 11.4. Leading Smart Materials Market Companies, by Market Capitalization 11.5. Market Structure 11.5.1. Market Leaders 11.5.2. Market Followers 11.5.3. Emerging Players 11.6. Mergers and Acquisitions Details 12. Company Profile: Key Players 12.1. Smart Material Corporation 12.1.1. Company Overview 12.1.2. Business Portfolio 12.1.3. Financial Overview 12.1.4. SWOT Analysis 12.1.5. Strategic Analysis 12.1.6. Scale of Operation (small, medium, and large) 12.1.7. Details on partnership 12.1.8. Regulatory Accreditations and certifications Received by Them 12.1.9. Awards Received by the firm 12.1.10. Recent Developments 12.2. Ceram Tec 12.3. Kyocera Corporation 12.4. APC International, Ltd. 12.5. Harris Corporation 12.6. Lord Corporation 12.7. Piezo Kinetics, Inc. 12.8. TDK U.S.A Corporation 12.9. Murata 12.10. Solvay 12.11. Johnson Mattey 12.12. Arkema 12.13. Meggitt Sensing 12.14. Saes Getters 12.15. Fort Wayne Metals 12.16. View 12.17. Chromogenic 12.18. Gentex Corporation 13. Key Findings 14. Industry Recommendations 15. Smart Materials Market: Research Methodology
  • INQUIRE BEFORE BUYING