Global Security Labels Market
1. Preface
1.1. Report Scope and Market Segmentation
1.2. Research Highlights
1.3. Research Objectives
2. Assumptions and Research Methodology
2.1. Report Assumptions
2.2. Abbreviations
2.3. Research Methodology
2.3.1. Secondary Research
2.3.1.1. Secondary data
2.3.1.2. Secondary Sources
2.3.2. Primary Research
2.3.2.1. Data from Primary Sources
2.3.2.2. Breakdown of Primary Sources
3. Executive Summary: Global Market Size, by Market Value (US$ Bn)
4. Market Overview
4.1. Introduction
4.2. Market Indicator
4.2.1. Drivers
4.2.2. Restraints
4.2.3. Opportunities
4.2.4. Challenges
4.3. Porter’s Analysis
4.4. Value Chain Analysis
4.5. Market Risk Analysis
4.6. SWOT Analysis
4.7. Industry Trends and Emerging Technologies
5. Supply Side and Demand Side Indicators
6. Global Market Analysis and Forecast
6.1. Global Market Size & Y-o-Y Growth Analysis
6.1.1. North America
6.1.2. Europe
6.1.3. Asia Pacific
6.1.4. Middle East & Africa
6.1.5. South America
7. GlobalMarket Analysis and Forecast, by Composition
7.1. Introduction and Definition
7.2. Key Findings
7.3. Global Market Value Share Analysis, by Composition
7.4. Global Market Size (US$ Bn) and Volume(Square Meters) Forecast, by Composition
7.5. Global Market Analysis, by Composition
7.6. Global Market Attractiveness Analysis, by Composition
8. Global Security Labels Market Analysis and Forecast, by Identification Method
8.1. Introduction and Definition
8.2. Key Findings
8.3. Global Market Value Share Analysis, by Identification Method
8.4. Global Market Size (US$ Bn) and Volume(Square Meters)Forecast, by Identification Method
8.5. Global Market Analysis, by Identification Method
8.6. Global Market Attractiveness Analysis, by Identification Method
9. Global Security Labels Market Analysis and Forecast, by Type
9.1. Introduction and Definition
9.2. Key Findings
9.3. Global Market Value Share Analysis, by Type
9.4. Global Market Size (US$ Bn) and Volume(Square Meters) Forecast, by Type
9.5. Global Market Analysis, by Type
9.6. Global Market Attractiveness Analysis, by Type
10. Global Security Labels Market Analysis and Forecast, by Application
10.1. Introduction and Definition
10.2. Key Findings
10.3. Global Market Value Share Analysis, by Application
10.4. Global Market Size (US$ Bn) and Volume(Square Meters) Forecast, by Application
10.5. Global Market Analysis, by Application
10.6. Global Market Attractiveness Analysis, by Application
11. Global Security Labels Market Analysis and Forecast, by Form
11.1. Introduction and Definition
11.2. Key Findings
11.3. Global Market Value Share Analysis, by Form
11.4. Global Market Size (US$ Bn) and Volume(Square Meters) Forecast, by Form
11.5. Global Market Analysis, by Form
11.6. Global Market Attractiveness Analysis, by Form
12. Global Security Labels Market Analysis, by Region
12.1. Global Market Value Share Analysis, by Region
12.2. Global Market Size (US$ Bn) and Volume(Square Meters) Forecast, by Region
12.3. Global Market Attractiveness Analysis, by Region
13. North America Security Labels Market Analysis
13.1. Key Findings
13.2. North America Market Overview
13.3. North America Market Value Share Analysis, by Composition
13.4. North America Market Forecast, by Composition
13.4.1. Facestock
13.4.2. Adhesive
13.4.3. Release liner
13.5. North America Market Value Share Analysis, by Identification Method
13.6. North America Market Forecast, by Identification Method
13.6.1. Bar codes
13.6.2. Radio-frequency identification
13.6.3. Holographic
13.7. North America Market Value Share Analysis, by Type
13.8. North America Market Forecast, by Type
13.8.1. Branding
13.8.2. Identification
13.8.3. Informative
13.9. North America Market Value Share Analysis, by Application
13.10. North America Market Forecast, by Application
13.10.1. Food & beverage
13.10.2. Retail
13.10.3. Consumer durables
13.10.4. Pharmaceuticals
13.11. North America Market Value Share Analysis, by Form
13.12. North America Market Forecast, by Form
13.12.1. Reels
13.12.2. Sheets
13.13. North America Market Value Share Analysis, by Country
13.14. North America Market Forecast, by Country
13.14.1. U.S.
13.14.2. Canada
13.15. North America Market Analysis, by Country
13.16. U.S. Market Forecast, by Composition
13.16.1. Facestock
13.16.2. Adhesive
13.16.3. Release liner
13.17. U.S. Market Forecast, by Identification Method
13.17.1. Bar codes
13.17.2. Radio-frequency identification
13.17.3. Holographic
13.18. U.S. Market Forecast, by Type
13.18.1. Branding
13.18.2. Identification
13.18.3. Informative
13.19. U.S. Market Forecast, by Application
13.19.1. Food & beverage
13.19.2. Retail
13.19.3. Consumer durables
13.19.4. Pharmaceuticals
13.20. U.S Market Forecast, by Form
13.20.1. Reels
13.20.2. Sheets
13.21. Canada Market Forecast, by Composition
13.21.1. Facestock
13.21.2. Adhesive
13.21.3. Release liner
13.22. Canada Market Forecast, by Identification Method
13.22.1. Bar codes
13.22.2. Radio-frequency identification
13.22.3. Holographic
13.23. Canada Market Forecast, by Type
13.23.1. Branding
13.23.2. Identification
13.23.3. Informative
13.24. Canada Market Forecast, by Application
13.24.1. Food & beverage
13.24.2. Retail
13.24.3. Consumer durables
13.24.4. Pharmaceuticals
13.25. Canada Market Forecast, by Form
13.25.1. Reels
13.25.2. Sheets
13.26. North America Market Attractiveness Analysis
13.26.1. By Composition
13.26.2. By Identification Method
13.26.3. By Type
13.26.4. By Application
13.26.5. By Form
13.27. PEST Analysis
13.28. Key Trends
13.29. Key Developments
14. Europe Security Labels Market Analysis
14.1. Key Findings
14.2. Europe Security Labels Market Overview
14.3. Europe Security Labels Market Value Share Analysis, by Composition
14.4. Europe Security Labels Market Forecast, by Composition
14.4.1. Facestock
14.4.2. Adhesive
14.4.3. Release liner
14.5. Europe Security Labels Market Value Share Analysis, by Identification Method
14.6. Europe Security Labels Market Forecast, by Identification Method
14.6.1. Bar codes
14.6.2. Radio-frequency identification
14.6.3. Holographic
14.7. Europe Security Labels Market Value Share Analysis, by Type
14.8. Europe Security Labels Market Forecast, by Type
14.8.1. Branding
14.8.2. Identification
14.8.3. Informative
14.9. Europe Security Labels Market Value Share Analysis, by Application
14.10. Europe Security Labels Market Forecast, by Application
14.10.1. Food & beverage
14.10.2. Retail
14.10.3. Consumer durables
14.10.4. Pharmaceuticals
14.11. Europe Security Labels Market Value Share Analysis, by Form
14.12. Europe Security Labels Market Forecast, by Form
14.12.1. Reels
14.12.2. Sheets
14.13. Europe Security Labels Market Value Share Analysis, by Country
14.14. Europe Security Labels Market Forecast, by Country
14.14.1. Germany
14.14.2. U.K.
14.14.3. France
14.14.4. Italy
14.14.5. Spain
14.14.6. Rest of Europe
14.15. Europe Security Labels Market Analysis, by Country
14.16. Germany Security Labels Market Forecast, by Composition
14.16.1. Facestock
14.16.2. Adhesive
14.16.3. Release liner
14.17. Germany Security Labels Market Forecast, by Identification Method
14.17.1. Bar codes
14.17.2. Radio-frequency identification
14.17.3. Holographic
14.18. Germany Security Labels Market Forecast, by Type
14.18.1. Branding
14.18.2. Identification
14.18.3. Informative
14.19. Germany Security Labels Market Forecast, by Application
14.19.1. Food & beverage
14.19.2. Retail
14.19.3. Consumer durables
14.19.4. Pharmaceuticals
14.20. Germany Security Labels Market Forecast, by Form
14.20.1. Reels
14.20.2. Sheets
14.21. U.K. Security Labels Market Forecast, by Composition
14.21.1. Facestock
14.21.2. Adhesive
14.21.3. Release liner
14.22. U.K. Security Labels Market Forecast, by Identification Method
14.22.1. Bar codes
14.22.2. Radio-frequency identification
14.22.3. Holographic
14.23. U.K. Security Labels Market Forecast, by Type
14.23.1. Branding
14.23.2. Identification
14.23.3. Informative
14.24. U.K. Security Labels Market Forecast, by Application
14.24.1. Food & beverage
14.24.2. Retail
14.24.3. Consumer durables
14.24.4. Pharmaceuticals
14.25. U.K. Security Labels Market Forecast, by Form
14.25.1. Reels
14.25.2. Sheets
14.26. France Security Labels Market Forecast, by Composition
14.26.1. Facestock
14.26.2. Adhesive
14.26.3. Release liner
14.27. France Security Labels Market Forecast, by Identification Method
14.27.1. Bar codes
14.27.2. Radio-frequency identification
14.27.3. Holographic
14.28. France Security Labels Market Forecast, by Type
14.28.1. Branding
14.28.2. Identification
14.28.3. Informative
14.29. France Security Labels Market Forecast, by Application
14.29.1. Food & beverage
14.29.2. Retail
14.29.3. Consumer durables
14.29.4. Pharmaceuticals
14.30. France Security Labels Market Forecast, by Form
14.30.1. Reels
14.30.2. Sheets
14.31. Italy Security Labels Market Forecast, by Composition
14.31.1. Facestock
14.31.2. Adhesive
14.31.3. Release liner
14.32. Italy Security Labels Market Forecast, by Identification Method
14.32.1. Bar codes
14.32.2. Radio-frequency identification
14.32.3. Holographic
14.33. Italy Security Labels Market Forecast, by Type
14.33.1. Branding
14.33.2. Identification
14.33.3. Informative
14.34. Italy Security Labels Market Forecast, by Application
14.34.1. Food & beverage
14.34.2. Retail
14.34.3. Consumer durables
14.34.4. Pharmaceuticals
14.35. Italy Security Labels Market Forecast, by Form
14.35.1. Reels
14.35.2. Sheets
14.36. Spain Security Labels Market Forecast, by Composition
14.36.1. Facestock
14.36.2. Adhesive
14.36.3. Release liner
14.37. Spain Security Labels Market Forecast, by Identification Method
14.37.1. Bar codes
14.37.2. Radio-frequency identification
14.37.3. Holographic
14.38. Spain Security Labels Market Forecast, by Type
14.38.1. Branding
14.38.2. Identification
14.38.3. Informative
14.39. Spain Security Labels Market Forecast, by Application
14.39.1. Food & beverage
14.39.2. Retail
14.39.3. Consumer durables
14.39.4. Pharmaceuticals
14.40. Spain Security Labels Market Forecast, by Form
14.40.1. Reels
14.40.2. Sheets
14.41. Rest of Europe Security Labels Market Forecast, by Composition
14.41.1. Facestock
14.41.2. Adhesive
14.41.3. Release liner
14.42. Rest of Europe Security Labels Market Forecast, by Identification Method
14.42.1. Bar codes
14.42.2. Radio-frequency identification
14.42.3. Holographic
14.43. Rest of Europe Security Labels Market Forecast, by Type
14.43.1. Branding
14.43.2. Identification
14.43.3. Informative
14.44. Rest Of Europe Security Labels Market Forecast, by Application
14.44.1. Food & beverage
14.44.2. Retail
14.44.3. Consumer durables
14.44.4. Pharmaceuticals
14.45. Rest Of Europe Security Labels Market Forecast, by Form
14.45.1. Reels
14.45.2. Sheets
14.46. Europe Security Labels Market Attractiveness Analysis
14.46.1. By Composition
14.46.2. By Identification Method
14.46.3. By Type
14.46.4. By Application
14.46.5. By Form
14.47. PEST Analysis
14.48. Key Trends
14.49. Key Developments
15. Asia Pacific Security Labels Market Analysis
15.1. Key Findings
15.2. Asia Pacific Security Labels Market Overview
15.3. Asia Pacific Security Labels Market Value Share Analysis, by Composition
15.4. Asia Pacific Security Labels Market Forecast, by Composition
15.4.1. Facestock
15.4.2. Adhesive
15.4.3. Release liner
15.5. Asia Pacific Security Labels Market Value Share Analysis, by Identification Method
15.6. Asia Pacific Security Labels Market Forecast, by Identification Method
15.6.1. Bar codes
15.6.2. Radio-frequency identification
15.6.3. Holographic
15.7. Asia Pacific Security Labels Market Value Share Analysis, by Type
15.8. Asia Pacific Security Labels Market Forecast, by Type
15.8.1. Branding
15.8.2. Identification
15.8.3. Informative
15.9. Asia Pacific Security Labels Market Value Share Analysis, by Application
15.10. Asia Pacific Security Labels Market Forecast, by Application
15.10.1. Food & beverage
15.10.2. Retail
15.10.3. Consumer durables
15.10.4. Pharmaceuticals
15.11. Asia Pacific Security Labels Market Value Share Analysis, by Form
15.12. Asia Pacific Security Labels Market Forecast, by Form
15.12.1. Reels
15.12.2. Sheets
15.13. Asia Pacific Security Labels Market Value Share Analysis, by Country
15.14. Asia Pacific Security Labels Market Forecast, by Country
15.14.1. China
15.14.2. India
15.14.3. Japan
15.14.4. ASEAN
15.14.5. Rest of Asia Pacific
15.15. Asia Pacific Security Labels Market Analysis, by Country
15.16. China Security Labels Market Forecast, by Composition
15.16.1. Facestock
15.16.2. Adhesive
15.16.3. Release liner
15.17. China Security Labels Market Forecast, by Identification Method
15.17.1. Bar codes
15.17.2. Radio-frequency identification
15.17.3. Holographic
15.18. China Security Labels Market Forecast, by Type
15.18.1. Branding
15.18.2. Identification
15.18.3. Informative
15.19. China Security Labels Market Forecast, by Application
15.19.1. Food & beverage
15.19.2. Retail
15.19.3. Consumer durables
15.19.4. Pharmaceuticals
15.20. China Security Labels Market Forecast, by Form
15.20.1. Reels
15.20.2. Sheets
15.21. India Security Labels Market Forecast, by Composition
15.21.1. Facestock
15.21.2. Adhesive
15.21.3. Release liner
15.22. India Security Labels Market Forecast, by Identification Method
15.22.1. Bar codes
15.22.2. Radio-frequency identification
15.22.3. Holographic
15.23. India Security Labels Market Forecast, by Type
15.23.1. Branding
15.23.2. Identification
15.23.3. Informative
15.24. India Security Labels Market Forecast, by Application
15.24.1. Food & beverage
15.24.2. Retail
15.24.3. Consumer durables
15.24.4. Pharmaceuticals
15.25. India Security Labels Market Forecast, by Form
15.25.1. Reels
15.25.2. Sheets
15.26. Japan Security Labels Market Forecast, by Composition
15.26.1. Facestock
15.26.2. Adhesive
15.26.3. Release liner
15.27. Japan Security Labels Market Forecast, by Identification Method
15.27.1. Bar codes
15.27.2. Radio-frequency identification
15.27.3. Holographic
15.28. Japan Security Labels Market Forecast, by Type
15.28.1. Branding
15.28.2. Identification
15.28.3. Informative
15.29. Japan Security Labels Market Forecast, by Application
15.29.1. Food & beverage
15.29.2. Retail
15.29.3. Consumer durables
15.29.4. Pharmaceuticals
15.30. Japan Security Labels Market Forecast, by Form
15.30.1. Reels
15.30.2. Sheets
15.31. ASEAN Security Labels Market Forecast, by Composition
15.31.1. Facestock
15.31.2. Adhesive
15.31.3. Release liner
15.32. ASEAN Security Labels Market Forecast, by Identification Method
15.32.1. Bar codes
15.32.2. Radio-frequency identification
15.32.3. Holographic
15.33. ASEAN Security Labels Market Forecast, by Type
15.33.1. Branding
15.33.2. Identification
15.33.3. Informative
15.34. ASEAN Security Labels Market Forecast, by Application
15.34.1. Food & beverage
15.34.2. Retail
15.34.3. Consumer durables
15.34.4. Pharmaceuticals
15.35. ASEAN Security Labels Market Forecast, by Form
15.35.1. Reels
15.35.2. Sheets
15.36. Rest of Asia Pacific Security Labels Market Forecast, by Composition
15.36.1. Facestock
15.36.2. Adhesive
15.36.3. Release liner
15.37. Rest of Asia Pacific Security Labels Market Forecast, by Identification Method
15.37.1. Bar codes
15.37.2. Radio-frequency identification
15.37.3. Holographic
15.38. Rest of Asia Pacific Security Labels Market Forecast, by Type
15.38.1. Branding
15.38.2. Identification
15.38.3. Informative
15.39. Rest of Asia Pacific Security Labels Market Forecast, by Application
15.39.1. Food & beverage
15.39.2. Retail
15.39.3. Consumer durables
15.39.4. Pharmaceuticals
15.40. Rest of Asia Pacific Security Labels Market Forecast, by Form
15.40.1. Reels
15.40.2. Sheets
15.41. Asia Pacific Security Labels Market Attractiveness Analysis
15.41.1. By Composition
15.41.2. By Identification Method
15.41.3. By Type
15.41.4. By Application
15.41.5. By Form
15.42. PEST Analysis
15.43. Key Trends
15.44. Key Developments
16. Middle East & Africa Security Labels Market Analysis
16.1. Key Findings
16.2. Middle East & Africa Security Labels Market Overview
16.3. Middle East & Africa Security Labels Market Value Share Analysis, by Composition
16.4. Middle East & Africa Security Labels Market Forecast, by Composition
16.4.1. Facestock
16.4.2. Adhesive
16.4.3. Release liner
16.5. Middle East & Africa Security Labels Market Value Share Analysis, by Identification Method
16.6. Middle East & Africa Security Labels Market Forecast, by Identification Method
16.6.1. Bar codes
16.6.2. Radio-frequency identification
16.6.3. Holographic
16.7. Middle East & Africa Security Labels Market Value Share Analysis, by Type
16.8. Middle East & Africa Security Labels Market Forecast, by Type
16.8.1. Branding
16.8.2. Identification
16.8.3. Informative
16.9. Middle East & Africa Security Labels Market Value Share Analysis, by Application
16.10. Middle East & Africa Security Labels Market Forecast, by Application
16.10.1. Food & beverage
16.10.2. Retail
16.10.3. Consumer durables
16.10.4. Pharmaceuticals
16.11. Middle East & Africa Security Labels Market Value Share Analysis, by Form
16.12. Middle East & Africa Security Labels Market Forecast, by Form
16.12.1. Reels
16.12.2. Sheets
16.13. Middle East & Africa Security Labels Market Value Share Analysis, by Country
16.14. Middle East & Africa Security Labels Market Forecast, by Country
16.14.1. GCC
16.14.2. South Africa
16.14.3. Rest of Middle East & Africa
16.15. Middle East & Africa Security Labels Market Analysis, by Country
16.16. GCC Security Labels Market Forecast, by Composition
16.16.1. Facestock
16.16.2. Adhesive
16.16.3. Release liner
16.17. GCC Security Labels Market Forecast, by Identification Method
16.17.1. Bar codes
16.17.2. Radio-frequency identification
16.17.3. Holographic
16.18. GCC Security Labels Market Forecast, by Type
16.18.1. Branding
16.18.2. Identification
16.18.3. Informative
16.19. GCC Security Labels Market Forecast, by Application
16.19.1. Food & beverage
16.19.2. Retail
16.19.3. Consumer durables
16.19.4. Pharmaceuticals
16.20. GCC Security Labels Market Forecast, by Form
16.20.1. Reels
16.20.2. Sheets
16.21. South Africa Security Labels Market Forecast, by Composition
16.21.1. Facestock
16.21.2. Adhesive
16.21.3. Release liner
16.22. South Africa Security Labels Market Forecast, by Identification Method
16.22.1. Bar codes
16.22.2. Radio-frequency identification
16.22.3. Holographic
16.23. South Africa Security Labels Market Forecast, by Type
16.23.1. Branding
16.23.2. Identification
16.23.3. Informative
16.24. South Africa Security Labels Market Forecast, by Application
16.24.1. Food & beverage
16.24.2. Retail
16.24.3. Consumer durables
16.24.4. Pharmaceuticals
16.25. South Africa Security Labels Market Forecast, by Form
16.25.1. Reels
16.25.2. Sheets
16.26. Rest of Middle East & Africa Security Labels Market Forecast, by Composition
16.26.1. Facestock
16.26.2. Adhesive
16.26.3. Release liner
16.27. Rest of Middle East & Africa Security Labels Market Forecast, by Identification Method
16.27.1. Bar codes
16.27.2. Radio-frequency identification
16.27.3. Holographic
16.28. Rest of Middle East & Africa Security Labels Market Forecast, by Type
16.28.1. Branding
16.28.2. Identification
16.28.3. Informative
16.29. Rest of Middle East & Africa Security Labels Market Forecast, by Application
16.29.1. Food & beverage
16.29.2. Retail
16.29.3. Consumer durables
16.29.4. Pharmaceuticals
16.30. Rest of Middle East & Africa Security Labels Market Forecast, by Form
16.30.1. Reels
16.30.2. Sheets
16.31. Middle East & Africa Security Labels Market Attractiveness Analysis
16.31.1. By Composition
16.31.2. By Identification Method
16.31.3. By Type
16.31.4. By Application
16.31.5. By Form
16.32. PEST Analysis
16.33. Key Trends
16.34. Key Developments
17. South America Security Labels Market Analysis
17.1. Key Findings
17.2. South America Security Labels Market Overview
17.3. South America Security Labels Market Value Share Analysis, by Composition
17.4. South America Security Labels Market Forecast, by Composition
17.4.1. Facestock
17.4.2. Adhesive
17.4.3. Release liner
17.5. South America Security Labels Market Value Share Analysis, by Identification Method
17.6. South America Security Labels Market Forecast, by Identification Method
17.6.1. Bar codes
17.6.2. Radio-frequency identification
17.6.3. Holographic
17.7. South America Security Labels Market Value Share Analysis, by Type
17.8. South America Security Labels Market Forecast, by Type
17.8.1. Branding
17.8.2. Identification
17.8.3. Informative
17.9. South America Security Labels Market Value Share Analysis, by Application
17.10. South America Security Labels Market Forecast, by Application
17.10.1. Food & beverage
17.10.2. Retail
17.10.3. Consumer durables
17.10.4. Pharmaceuticals
17.11. South America Security Labels Market Value Share Analysis, by Form
17.12. South America Security Labels Market Forecast, by Form
17.12.1. Reels
17.12.2. Sheets
17.13. South America Security Labels Market Value Share Analysis, by Country
17.14. South America Security Labels Market Forecast, by Country
17.14.1. Brazil
17.14.2. Mexico
17.14.3. Rest of South America
17.15. South America Security Labels Market Analysis, by Country
17.16. Brazil Security Labels Market Forecast, by Composition
17.16.1. Facestock
17.16.2. Adhesive
17.16.3. Release liner
17.17. Brazil Security Labels Market Forecast, by Identification Method
17.17.1. Bar codes
17.17.2. Radio-frequency identification
17.17.3. Holographic
17.18. Brazil Security Labels Market Forecast, by Type
17.18.1. Branding
17.18.2. Identification
17.18.3. Informative
17.19. Brazil Security Labels Market Forecast, by Application
17.19.1. Food & beverage
17.19.2. Retail
17.19.3. Consumer durables
17.19.4. Pharmaceuticals
17.20. Brazil Security Labels Market Forecast, by Form
17.20.1. Reels
17.20.2. Sheets
17.21. Mexico Security Labels Market Forecast, by Composition
17.21.1. Facestock
17.21.2. Adhesive
17.21.3. Release liner
17.22. Mexico Security Labels Market Forecast, by Identification Method
17.22.1. Bar codes
17.22.2. Radio-frequency identification
17.22.3. Holographic
17.23. Mexico Security Labels Market Forecast, by Type
17.23.1. Branding
17.23.2. Identification
17.23.3. Informative
17.24. Mexico Security Labels Market Forecast, by Application
17.24.1. Food & beverage
17.24.2. Retail
17.24.3. Consumer durables
17.24.4. Pharmaceuticals
17.25. Mexico Security Labels Market Forecast, by Form
17.25.1. Reels
17.25.2. Sheets
17.26. Rest of South America Security Labels Market Forecast, by Composition
17.26.1. Facestock
17.26.2. Adhesive
17.26.3. Release liner
17.27. Rest of South America Security Labels Market Forecast, by Identification Method
17.27.1. Bar codes
17.27.2. Radio-frequency identification
17.27.3. Holographic
17.28. Rest of South America Security Labels Market Forecast, by Type
17.28.1. Branding
17.28.2. Identification
17.28.3. Informative
17.29. Rest of South America Security Labels Market Forecast, by Application
17.29.1. Food & beverage
17.29.2. Retail
17.29.3. Consumer durables
17.29.4. Pharmaceuticals
17.30. Rest of South America Security Labels Market Forecast, by Form
17.30.1. Reels
17.30.2. Sheets
17.31. South America Security Labels Market Attractiveness Analysis
17.31.1. By Composition
17.31.2. By Identification Method
17.31.3. By Type
17.31.4. By Application
17.31.5. By Form
17.32. PEST Analysis
17.33. Key Trends
17.34. Key Developments
18. Company Profiles
18.1. Market Share Analysis, by Company
18.2. Competition Matrix
18.2.1. Competitive Benchmarking of key players by price, presence, market share, Applications and R&D investment
18.2.2. New Product Launches and Product Enhancements
18.2.3. Market Consolidation
18.2.3.1. M&A by Regions, Investment and Applications
18.2.3.2. M&A Key Players, Forward Integration and Backward
Integration
18.3. Company Profiles: Key Players
18.3.1. CCL Industries, Inc.
18.3.1.1. Company Overview
18.3.1.2. Financial Overview
18.3.1.3. Product Portfolio
18.3.1.4. Business Strategy
18.3.1.5. Recent Developments
18.3.1.6. Company Footprint
18.3.2. Honeywell
18.3.3. UPM Raflatac
18.3.4. Avery Dennison Corporation
18.3.5. 3M
18.3.6. Groupdc
18.3.7. Label Lock
18.3.8. Seiko Holdings Corporation
18.3.9. Polylabel
18.3.10. Tesa SE Group
18.3.11. RR Donnelley
18.3.12. Intertronix
18.3.13. Nova Vision Inc
18.3.14. Kejing Electronics Co. Ltd
18.3.15. Guangzhou Huaisheng Packaging Co., Ltd.
18.3.16. Avery Dennison Corporation
18.3.17. OpSec
18.3.18. Brady Worldwide, Inc.
18.3.19. Holosafe Security Labels
18.3.20. Star Label Products
18.3.21. Watson Label Products
18.3.22. DATA LABEL
18.3.23. Covectra, Inc.
18.3.24. MEGA FORTRIS GROUP
18.3.25. All4Labels Smart + Secure GmbH
19. Primary Key Insights

 To know about the Research Methodology:-Request Free Sample Report
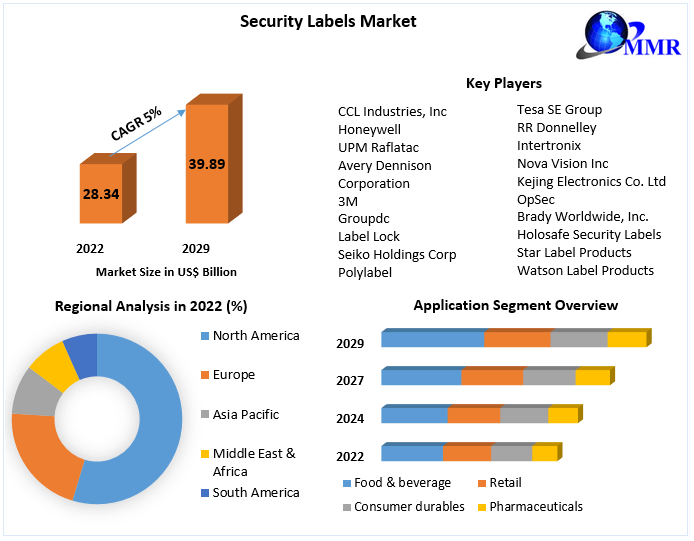
 The barcode segmented accounted for the largest 5% market share in 2022. Barcodes are largely used in various industries such as consumer goods, pharmaceuticals, transportation & logistics, and retail for keeping track of their products as well as for locating outgoing shipments and equipment. It is a cost-effective and most reliable method for gathering any kind of necessary data.