Pre-Engineered Buildings Market: Global Industry Analysis and Forecast (2023-2029) Trends, Statistics, Dynamics, Segmentation by Structure, Application, and Region.

Pre-Engineered Buildings Market was valued at US$ 20140.25 Mn. in 2022. Global Pre-Engineered Buildings Market size is estimated to grow at a CAGR of 11.5% over the forecast period.

Pre-Engineered Buildings Market Overview:

Pre-Engineered buildings are steel frames, which are manufactured at a factory and then shipped to the job site to be assembled. These structures are constructed up of a solid frame formed of steel plates, including beams and columns that may span huge distances without the use of columns, along with roof and wall coverings. Warehouses, distribution facilities, retail stores, shopping centers, office complexes, airplane hangars, and hospitals are among the many industrial applications for pre-engineered buildings. They are generally more cost-effective and efficient than traditional structure framing solutions like light gauge aluminum.Pre-Engineered Buildings Market
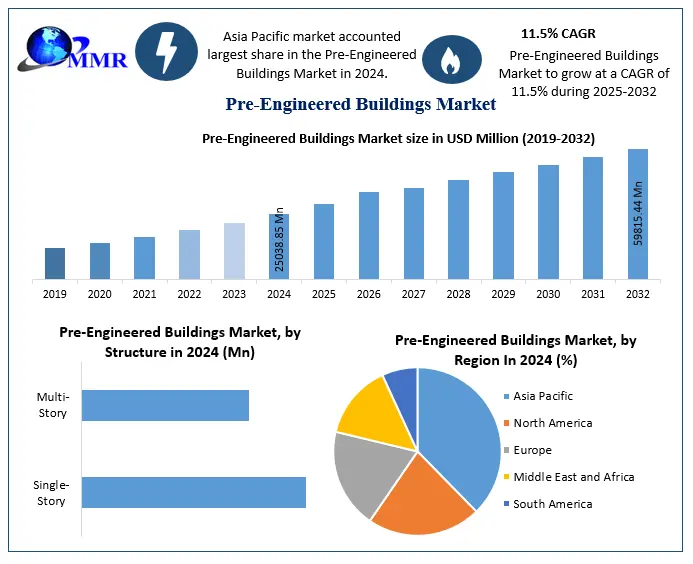
To know about the Research Methodology :- Request Free Sample Report 2022 is considered as a base year to forecast the market from 2023 to 2029. 2020’s market size is estimated on real numbers and outputs of the key players and major players across the globe. Past five years' trends are considered while forecasting the market through 2029. 2022 is a year of exception and analyzed especially with the impact of lockdown by region.

Pre-Engineered Buildings Market Dynamics:

The growing awareness of sophisticated off-site construction technologies and practices, along with rising industrialization across the globe is driving the pre-engineered buildings market growth. The demand for industrial storage facilities and warehouses has increased as e-commerce and logistics stores have become more prevalent in the retail industry. This has increased the need for pre-engineered buildings, which are more cost-effective and long-lasting than conventionally constructed structures. Pre-engineered building systems also provide major performance benefits, such as a longer building material life cycle, infinite design flexibility, and lower material and labor costs. In addition, the introduction of pre-engineered green buildings has boosted the market growth. These green structures are low-carbon, environmentally friendly solutions that use less energy during and after construction. Pre-engineered buildings along with technological advances have greatly contributed to the development of quality of life over time. PEB construction takes 30 to 40% less time than masonry. PEB structures have a good insulating effect and would be ideal for a tropical country such as India. PEB is an excellent choice for construction in isolated and steep places. According to a recent survey by the Metal Building Associations (MBA), pre-engineered buildings account for over 60% of non-residential low-rise buildings in the United States. Pre-engineered building systems are predominantly used in the construction of warehouses, industrial sheds, and buildings across the globe. Rural and urban areas, individual and mass housing projects, farmhouses, slum re-organization, and rehabilitation projects, along with amenity structures such as health centers, kiosks, primary schools, and colleges, are now being constructed by pre-engineered building technology. PEB has also attracted pharmaceutical companies and exposition centers along with functional requirements such as offices, conference halls, call centers, supermarkets, and showrooms. Earthquake-resistant structures are a relatively new application of PEB that has received widespread and quick acceptance across the globe. Increased corrosion risk and reduced thermal and fire resistance, are expected to hamper the pre-engineered building market growth throughout the forecast period. In addition, one of the most significant obstacles to the adoption of PEBs in the countries like India, continued faith in traditional construction methods. Nonetheless, as people become more aware of the benefits of PEBs, demand for these products is expected to rise significantly over the forecast period.

Pre-Engineered Buildings Market Segment Analysis:

Based on the Structure, the Pre-Engineered Buildings Market is segmented into Single-Story and Multi-Story. The ingle-Story segment held the largest market share, accounting for 73.1% in 2020. Infrastructure, logistical, and industrial construction investments are driving demand for single-story pre-engineered buildings. The need for single-story pre-engineered buildings is also being fueled by the growth of new forms of non-residential construction, such as healthcare, education, recreational and social infrastructure, and retail. In addition, the reduced cost of single-story buildings and the advantages of generating big open areas that are efficient, easy to maintain, and architecturally flexible, are boosting the pre-engineered buildings market growth for this segment. Based on the Application, the Pre-Engineered Buildings Market is segmented into Warehouses & Industrial, Infrastructure, Commercial, and Others. The Warehouses & Industrial segment held the largest market share, accounting for 64% in 2022. The segment growth is attributed to the growth of the manufacturing, shipping, and e-commerce industries across the globe. The growth in these areas fuels demands for factories, manufacturing plants, research and development centers, warehouses, and distribution centers, boosting the pre-engineered building market growth. The Infrastructure segment is expected to witness significant growth at a CAGR of 10.9% during the forecast period. The increasing infrastructural, demand for metro station sheds, airport hangers, airport terminal buildings, shipyards, roads and footbridges, and railway platform shelters are driving the segment growth across the globe.

Pre-Engineered Buildings Market Regional Insights:

Asia Pacific region held the largest market share accounted for 38.71% in 2022. The growing demand for pre-engineered structures in the Asia Pacific region is attributed to the region's growing non-residential construction and infrastructure development. India and China account for the majority of pre-engineered building demand in the area, owing to the rising population, economic growth, government investments, and demand for low-cost green structures. In addition, with low labor costs, trade liberalization, and favourable government regulations, foreign investors are establishing factories and distribution centers in Asia Pacific developing countries, fueling the growth of the pre-engineered buildings market growth. In India, the steel structures (SS) market is in excess of 4.5 million metric tonnes, and it has been rising at a rate of more than 10% per year over the past several years. In comparison to both the Indian steel industry and the Indian construction GDP, this market has grown faster. India has a steel capacity of 35 to 40 million tons installed, with an apparent steel consumption of 27 to 30 million tons. The current capacity for pre-engineered steel buildings is 0.35 million tons per year. The industry is expanding at a compound annual rate of 25 to 30%. These factors are expected to boost the pre-engineered buildings market growth over the forecast period. The objective of the report is to present a comprehensive analysis of the global Pre-Engineered Buildings Market to the stakeholders in the industry. The past and current status of the industry with the forecasted market size and trends are presented in the report with the analysis of complicated data in simple language. The report covers all the aspects of the industry with a dedicated study of key players that include market leaders, followers, and new entrants. PORTER, PESTEL analysis with the potential impact of micro-economic factors of the market have been presented in the report. External as well as internal factors that are supposed to affect the business positively or negatively have been analyzed, which will give a clear futuristic view of the industry to the decision-makers. The reports also help in understanding the Pre-Engineered Buildings Market dynamic, structure by analyzing the market segments and projecting the Pre-Engineered Buildings Market size. Clear representation of competitive analysis of key players by Vehicle type, price, financial position, product portfolio, growth strategies, and regional presence in the Pre-Engineered Buildings Market make the report investor’s guide.

Pre-Engineered Buildings Market Scope: Inquiry Before Buying

Pre-Engineered Buildings Market
Report Coverage Details
Base Year: 2022 Forecast Period: 2023-2029
Historical Data: 2017 to 2022 Market Size in 2022: US $ 20140.25 Mn.
Forecast Period 2023 to 2029 CAGR: 11.5% Market Size in 2029: US $ 43150.8 Mn.
Segments Covered: by Structure • Single-Story • Multi-Story
by Application • Warehouses & Industrial • Infrastructure • Commercial • Others

Pre-Engineered Buildings Market, by Region

North America (United States, Canada and Mexico) • Europe (UK, France, Germany, Italy, Spain, Sweden, Austria and Rest of Europe) • Asia Pacific (China, South Korea, Japan, India, Australia, Indonesia, Malaysia, Vietnam, Taiwan, Bangladesh, Pakistan and Rest of APAC) • Middle East and Africa (South Africa, GCC, Egypt, Nigeria and Rest of ME&A) • South America (Brazil, Argentina Rest of South America)

Pre-Engineered Buildings Market Key Players:

Bluescope • Zamil Steel Holding Company • Kirby Building Systems • Nucor Corporation • NCI Building Systems • Lindab Group • Everest Industries • PEB Steel • PEBS Pennar • ATCO • Atad Steel Structure Corporation • Memaar Building Systems • Norsteel Buildings • John Reid & Sons (Strucsteel) • Rigid Global Buildings • Metal Building Manufacturers Inc. • Mabani Steel • Steelway Building Systems • Tiger Steel Engineering India (Tseil) • Emirates Building Systems • Phenix Construction Technologies • Allied Steel Buildings • SML Group • Octamec Group • Jindal Buildsys Frequently Asked Questions: 1. Which region has the largest share in Global Re-Engineered Buildings Market? Ans: Asia Pacific region held the highest share in 2022. 2. What is the growth rate of Global Re-Engineered Buildings Market? Ans: The Global Re-Engineered Buildings Market is growing at a CAGR of 11.5% during forecasting period 2023-2029. 3. What is scope of the Global Re-Engineered Buildings Market report? Ans: Global Re-Engineered Buildings Market report helps with the PESTEL, PORTER, COVID-19 Impact analysis, Recommendations for Investors & Leaders, and market estimation of the forecast period. 4. Who are the key players in Global Re-Engineered Buildings Market? Ans: The important key players in the Global Re-Engineered Buildings Market are – Bluescope, Zamil Steel Holding Company, Kirby Building Systems, Nucor Corporation, NCI Building Systems, Lindab Group, Everest Industries, PEB Steel, PEBS Pennar, ATCO, Atad Steel Structure Corporation, Memaar Building Systems, Norsteel Buildings, John Reid & Sons (Strucsteel), Rigid Global Buildings, Metal Building Manufacturers Inc., Mabani Steel, Steelway Building Systems, Tiger Steel Engineering India (Tseil), Emirates Building Systems, Phenix Construction Technologies, Allied Steel Buildings, SML Group, Octamec Group, and Jindal Buildsys 5. What is the study period of this Market? Ans: The Global Re-Engineered Buildings Market is studied from 2022 to 2029.
1. Pre-Engineered Buildings Market Introduction 1.1. Study Assumption and Market Definition 1.2. Scope of the Study 1.3. Executive Summary 2. Pre-Engineered Buildings Market: Dynamics 2.1. Pre-Engineered Buildings Market Trends by Region 2.1.1. North America Pre-Engineered Buildings Market Trends 2.1.2. Europe Pre-Engineered Buildings Market Trends 2.1.3. Asia Pacific Pre-Engineered Buildings Market Trends 2.1.4. Middle East and Africa Pre-Engineered Buildings Market Trends 2.1.5. South America Pre-Engineered Buildings Market Trends 2.2. Pre-Engineered Buildings Market Dynamics by Region 2.2.1. North America 2.2.1.1. North America Pre-Engineered Buildings Market Drivers 2.2.1.2. North America Pre-Engineered Buildings Market Restraints 2.2.1.3. North America Pre-Engineered Buildings Market Opportunities 2.2.1.4. North America Pre-Engineered Buildings Market Challenges 2.2.2. Europe 2.2.2.1. Europe Pre-Engineered Buildings Market Drivers 2.2.2.2. Europe Pre-Engineered Buildings Market Restraints 2.2.2.3. Europe Pre-Engineered Buildings Market Opportunities 2.2.2.4. Europe Pre-Engineered Buildings Market Challenges 2.2.3. Asia Pacific 2.2.3.1. Asia Pacific Pre-Engineered Buildings Market Drivers 2.2.3.2. Asia Pacific Pre-Engineered Buildings Market Restraints 2.2.3.3. Asia Pacific Pre-Engineered Buildings Market Opportunities 2.2.3.4. Asia Pacific Pre-Engineered Buildings Market Challenges 2.2.4. Middle East and Africa 2.2.4.1. Middle East and Africa Pre-Engineered Buildings Market Drivers 2.2.4.2. Middle East and Africa Pre-Engineered Buildings Market Restraints 2.2.4.3. Middle East and Africa Pre-Engineered Buildings Market Opportunities 2.2.4.4. Middle East and Africa Pre-Engineered Buildings Market Challenges 2.2.5. South America 2.2.5.1. South America Pre-Engineered Buildings Market Drivers 2.2.5.2. South America Pre-Engineered Buildings Market Restraints 2.2.5.3. South America Pre-Engineered Buildings Market Opportunities 2.2.5.4. South America Pre-Engineered Buildings Market Challenges 2.3. PORTER’s Five Forces Analysis 2.4. PESTLE Analysis 2.5. Technology Roadmap 2.6. Regulatory Landscape by Region 2.6.1. North America 2.6.2. Europe 2.6.3. Asia Pacific 2.6.4. Middle East and Africa 2.6.5. South America 2.7. Key Opinion Leader Analysis For Pre-Engineered Buildings Industry 2.8. Analysis of Government Schemes and Initiatives For Pre-Engineered Buildings Industry 2.9. Pre-Engineered Buildings Market Trade Analysis 2.10. The Global Pandemic Impact on Pre-Engineered Buildings Market 3. Pre-Engineered Buildings Market: Global Market Size and Forecast by Segmentation by Demand and Supply Side (by Value in USD Million) 2022-2029 3.1. Pre-Engineered Buildings Market Size and Forecast, by Structure (2022-2029) 3.1.1. Single-Story 3.1.2. Multi-Story 3.2. Pre-Engineered Buildings Market Size and Forecast, by Application (2022-2029) 3.2.1. Warehouses & Industrial 3.2.2. Infrastructure 3.2.3. Commercial 3.2.4. Others 3.3. Pre-Engineered Buildings Market Size and Forecast, by Region (2022-2029) 3.3.1. North America 3.3.2. Europe 3.3.3. Asia Pacific 3.3.4. Middle East and Africa 3.3.5. South America 4. North America Pre-Engineered Buildings Market Size and Forecast by Segmentation (by Value in USD Million) 2022-2029 4.1. North America Pre-Engineered Buildings Market Size and Forecast, by Structure (2022-2029) 4.1.1. Single-Story 4.1.2. Multi-Story 4.2. North America Pre-Engineered Buildings Market Size and Forecast, by Application (2022-2029) 4.2.1. Warehouses & Industrial 4.2.2. Infrastructure 4.2.3. Commercial 4.2.4. Others 4.3. North America Pre-Engineered Buildings Market Size and Forecast, by Country (2022-2029) 4.3.1. United States 4.3.1.1. United States Pre-Engineered Buildings Market Size and Forecast, by Structure (2022-2029) 4.3.1.1.1. Single-Story 4.3.1.1.2. Multi-Story 4.3.1.2. United States Pre-Engineered Buildings Market Size and Forecast, by Application (2022-2029) 4.3.1.2.1. Warehouses & Industrial 4.3.1.2.2. Infrastructure 4.3.1.2.3. Commercial 4.3.1.2.4. Others 4.3.2. Canada 4.3.2.1. Canada Pre-Engineered Buildings Market Size and Forecast, by Structure (2022-2029) 4.3.2.1.1. Single-Story 4.3.2.1.2. Multi-Story 4.3.2.2. Canada Pre-Engineered Buildings Market Size and Forecast, by Application (2022-2029) 4.3.2.2.1. Warehouses & Industrial 4.3.2.2.2. Infrastructure 4.3.2.2.3. Commercial 4.3.2.2.4. Others 4.3.3. Mexico 4.3.3.1. Mexico Pre-Engineered Buildings Market Size and Forecast, by Structure (2022-2029) 4.3.3.1.1. Single-Story 4.3.3.1.2. Multi-Story 4.3.3.2. Mexico Pre-Engineered Buildings Market Size and Forecast, by Application (2022-2029) 4.3.3.2.1. Warehouses & Industrial 4.3.3.2.2. Infrastructure 4.3.3.2.3. Commercial 4.3.3.2.4. Others 5. Europe Pre-Engineered Buildings Market Size and Forecast by Segmentation (by Value in USD Million) 2022-2029 5.1. Europe Pre-Engineered Buildings Market Size and Forecast, by Structure (2022-2029) 5.2. Europe Pre-Engineered Buildings Market Size and Forecast, by Application (2022-2029) 5.3. Europe Pre-Engineered Buildings Market Size and Forecast, by Country (2022-2029) 5.3.1. United Kingdom 5.3.1.1. United Kingdom Pre-Engineered Buildings Market Size and Forecast, by Structure (2022-2029) 5.3.1.2. United Kingdom Pre-Engineered Buildings Market Size and Forecast, by Application (2022-2029) 5.3.2. France 5.3.2.1. France Pre-Engineered Buildings Market Size and Forecast, by Structure (2022-2029) 5.3.2.2. France Pre-Engineered Buildings Market Size and Forecast, by Application (2022-2029) 5.3.3. Germany 5.3.3.1. Germany Pre-Engineered Buildings Market Size and Forecast, by Structure (2022-2029) 5.3.3.2. Germany Pre-Engineered Buildings Market Size and Forecast, by Application (2022-2029) 5.3.4. Italy 5.3.4.1. Italy Pre-Engineered Buildings Market Size and Forecast, by Structure (2022-2029) 5.3.4.2. Italy Pre-Engineered Buildings Market Size and Forecast, by Application (2022-2029) 5.3.5. Spain 5.3.5.1. Spain Pre-Engineered Buildings Market Size and Forecast, by Structure (2022-2029) 5.3.5.2. Spain Pre-Engineered Buildings Market Size and Forecast, by Application (2022-2029) 5.3.6. Sweden 5.3.6.1. Sweden Pre-Engineered Buildings Market Size and Forecast, by Structure (2022-2029) 5.3.6.2. Sweden Pre-Engineered Buildings Market Size and Forecast, by Application (2022-2029) 5.3.7. Austria 5.3.7.1. Austria Pre-Engineered Buildings Market Size and Forecast, by Structure (2022-2029) 5.3.7.2. Austria Pre-Engineered Buildings Market Size and Forecast, by Application (2022-2029) 5.3.8. Rest of Europe 5.3.8.1. Rest of Europe Pre-Engineered Buildings Market Size and Forecast, by Structure (2022-2029) 5.3.8.2. Rest of Europe Pre-Engineered Buildings Market Size and Forecast, by Application (2022-2029) 6. Asia Pacific Pre-Engineered Buildings Market Size and Forecast by Segmentation (by Value in USD Million) 2022-2029 6.1. Asia Pacific Pre-Engineered Buildings Market Size and Forecast, by Structure (2022-2029) 6.2. Asia Pacific Pre-Engineered Buildings Market Size and Forecast, by Application (2022-2029) 6.3. Asia Pacific Pre-Engineered Buildings Market Size and Forecast, by Country (2022-2029) 6.3.1. China 6.3.1.1. China Pre-Engineered Buildings Market Size and Forecast, by Structure (2022-2029) 6.3.1.2. China Pre-Engineered Buildings Market Size and Forecast, by Application (2022-2029) 6.3.2. S Korea 6.3.2.1. S Korea Pre-Engineered Buildings Market Size and Forecast, by Structure (2022-2029) 6.3.2.2. S Korea Pre-Engineered Buildings Market Size and Forecast, by Application (2022-2029) 6.3.3. Japan 6.3.3.1. Japan Pre-Engineered Buildings Market Size and Forecast, by Structure (2022-2029) 6.3.3.2. Japan Pre-Engineered Buildings Market Size and Forecast, by Application (2022-2029) 6.3.4. India 6.3.4.1. India Pre-Engineered Buildings Market Size and Forecast, by Structure (2022-2029) 6.3.4.2. India Pre-Engineered Buildings Market Size and Forecast, by Application (2022-2029) 6.3.5. Australia 6.3.5.1. Australia Pre-Engineered Buildings Market Size and Forecast, by Structure (2022-2029) 6.3.5.2. Australia Pre-Engineered Buildings Market Size and Forecast, by Application (2022-2029) 6.3.6. Indonesia 6.3.6.1. Indonesia Pre-Engineered Buildings Market Size and Forecast, by Structure (2022-2029) 6.3.6.2. Indonesia Pre-Engineered Buildings Market Size and Forecast, by Application (2022-2029) 6.3.7. Malaysia 6.3.7.1. Malaysia Pre-Engineered Buildings Market Size and Forecast, by Structure (2022-2029) 6.3.7.2. Malaysia Pre-Engineered Buildings Market Size and Forecast, by Application (2022-2029) 6.3.8. Vietnam 6.3.8.1. Vietnam Pre-Engineered Buildings Market Size and Forecast, by Structure (2022-2029) 6.3.8.2. Vietnam Pre-Engineered Buildings Market Size and Forecast, by Application (2022-2029) 6.3.9. Taiwan 6.3.9.1. Taiwan Pre-Engineered Buildings Market Size and Forecast, by Structure (2022-2029) 6.3.9.2. Taiwan Pre-Engineered Buildings Market Size and Forecast, by Application (2022-2029) 6.3.10. Rest of Asia Pacific 6.3.10.1. Rest of Asia Pacific Pre-Engineered Buildings Market Size and Forecast, by Structure (2022-2029) 6.3.10.2. Rest of Asia Pacific Pre-Engineered Buildings Market Size and Forecast, by Application (2022-2029) 7. Middle East and Africa Pre-Engineered Buildings Market Size and Forecast by Segmentation (by Value in USD Million) 2022-2029 7.1. Middle East and Africa Pre-Engineered Buildings Market Size and Forecast, by Structure (2022-2029) 7.2. Middle East and Africa Pre-Engineered Buildings Market Size and Forecast, by Application (2022-2029) 7.3. Middle East and Africa Pre-Engineered Buildings Market Size and Forecast, by Country (2022-2029) 7.3.1. South Africa 7.3.1.1. South Africa Pre-Engineered Buildings Market Size and Forecast, by Structure (2022-2029) 7.3.1.2. South Africa Pre-Engineered Buildings Market Size and Forecast, by Application (2022-2029) 7.3.2. GCC 7.3.2.1. GCC Pre-Engineered Buildings Market Size and Forecast, by Structure (2022-2029) 7.3.2.2. GCC Pre-Engineered Buildings Market Size and Forecast, by Application (2022-2029) 7.3.3. Nigeria 7.3.3.1. Nigeria Pre-Engineered Buildings Market Size and Forecast, by Structure (2022-2029) 7.3.3.2. Nigeria Pre-Engineered Buildings Market Size and Forecast, by Application (2022-2029) 7.3.4. Rest of ME&A 7.3.4.1. Rest of ME&A Pre-Engineered Buildings Market Size and Forecast, by Structure (2022-2029) 7.3.4.2. Rest of ME&A Pre-Engineered Buildings Market Size and Forecast, by Application (2022-2029) 8. South America Pre-Engineered Buildings Market Size and Forecast by Segmentation (by Value in USD Million) 2022-2029 8.1. South America Pre-Engineered Buildings Market Size and Forecast, by Structure (2022-2029) 8.2. South America Pre-Engineered Buildings Market Size and Forecast, by Application (2022-2029) 8.3. South America Pre-Engineered Buildings Market Size and Forecast, by Country (2022-2029) 8.3.1. Brazil 8.3.1.1. Brazil Pre-Engineered Buildings Market Size and Forecast, by Structure (2022-2029) 8.3.1.2. Brazil Pre-Engineered Buildings Market Size and Forecast, by Application (2022-2029) 8.3.2. Argentina 8.3.2.1. Argentina Pre-Engineered Buildings Market Size and Forecast, by Structure (2022-2029) 8.3.2.2. Argentina Pre-Engineered Buildings Market Size and Forecast, by Application (2022-2029) 8.3.3. Rest Of South America 8.3.3.1. Rest Of South America Pre-Engineered Buildings Market Size and Forecast, by Structure (2022-2029) 8.3.3.2. Rest Of South America Pre-Engineered Buildings Market Size and Forecast, by Application (2022-2029) 9. Global Pre-Engineered Buildings Market: Competitive Landscape 9.1. MMR Competition Matrix 9.2. Competitive Landscape 9.3. Key Players Benchmarking 9.3.1. Company Name 9.3.2. Business Segment 9.3.3. End-user Segment 9.3.4. Revenue (2022) 9.3.5. Company Locations 9.4. Leading Pre-Engineered Buildings Market Companies, by market capitalization 9.5. Market Structure 9.5.1. Market Leaders 9.5.2. Market Followers 9.5.3. Emerging Players 9.6. Mergers and Acquisitions Details 10. Company Profile: Key Players 10.1. Bluescope 10.1.1. Company Overview 10.1.2. Business Portfolio 10.1.3. Financial Overview 10.1.4. SWOT Analysis 10.1.5. Strategic Analysis 10.1.6. Scale of Operation (small, medium, and large) 10.1.7. Details on Partnership 10.1.8. Regulatory Accreditations and Certifications Received by Them 10.1.9. Awards Received by the Firm 10.1.10. Recent Developments 10.2. Zamil Steel Holding Company 10.3. Kirby Building Systems 10.4. Nucor Corporation 10.5. NCI Building Systems 10.6. Lindab Group 10.7. Everest Industries 10.8. PEB Steel 10.9. PEBS Pennar 10.10. ATCO 10.11. Atad Steel Structure Corporation 10.12. Memaar Building Systems 10.13. Norsteel Buildings 10.14. John Reid & Sons (Strucsteel) 10.15. Rigid Global Buildings 10.16. Metal Building Manufacturers Inc. 10.17. Mabani Steel 10.18. Steelway Building Systems 10.19. Tiger Steel Engineering India (Tseil) 10.20. Emirates Building Systems 10.21. Phenix Construction Technologies 10.22. Allied Steel Buildings 10.23. SML Group 10.24. Octamec Group 10.25. Jindal Buildsys 11. Key Findings 12. Industry Recommendations 13. Pre-Engineered Buildings Market: Research Methodology 14. Terms and Glossary
  • INQUIRE BEFORE BUYING