
Point of Sale (PoS) Software Market Size by Component, Deployment Mode, Application, Organization Size, End User, Region – Revenue Pool Analysis, Margin Structure Assessment, Capital Flow Trends, Competitive Benchmarking & Forecast to 2032
Overview
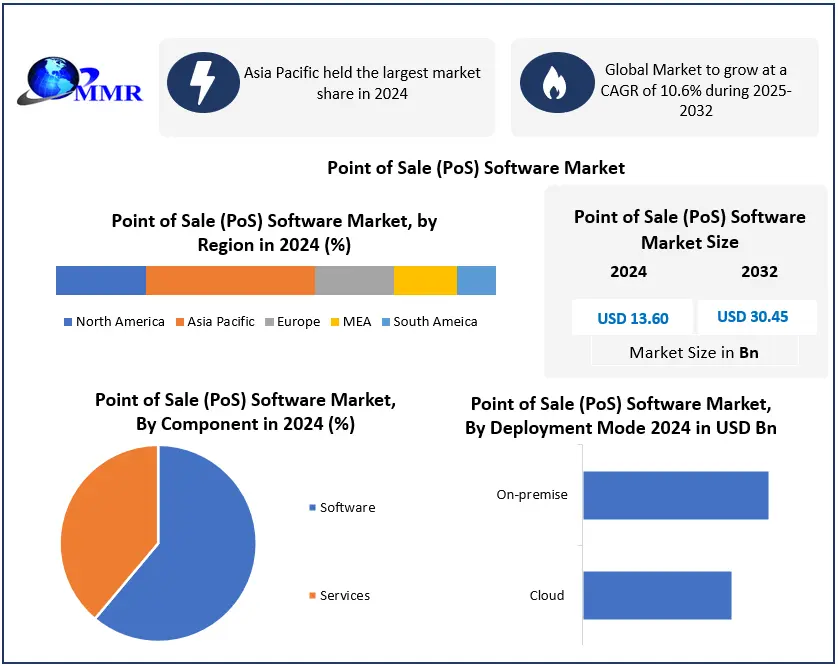
Point of Sale (PoS) Software Market was valued at USD 13.60 Bn in 2024, and the total Point of Sale (PoS) Software Market revenue is expected to grow at a CAGR of 10.6% and reach nearly USD 30.45 Bn from 2025 to 2032.
Global Point of Sale (PoS) Software Market
The evolving retail landscape has witnessed a significant transformation, with traditional transactions confined to checkout counters giving way to the dynamic features of modern Point of Sale (POS) systems. Unlike the fixed approach of the past, today's POS systems, are an important component of the Point of Sale (PoS) Software Market, empower employees with handheld devices, enabling them to move freely within the store, engage with customers, access product information, and complete sales on the spot. The introduction of mobile POS (mPOS) systems takes this flexibility even further, liberating businesses from the constraints of physical store locations. Employees now conduct transactions at trade shows, pop-ups, and curbside, seamlessly synchronizing sales and inventory data with the main store. This transformative shift not only enhances the customer experience by providing more dynamic and personalized interactions but also reflects the broader trends in the Point of Sale (PoS) Software market. The adaptability and mobility offered by modern POS systems, including mPOS, are integral to meeting the evolving needs of businesses in a changing retail landscape.
 To know about the Research Methodology :- Request Free Sample Report
According to the MMR study report, the global mPOS transaction value reached $3.30 trillion by 2023, underscoring the widespread adoption of this innovative method. Even in the post-COVID era, mPOS and online sales continue to redefine the customer experience. Consumers now value the convenience of ordering for delivery or opting to order online and pick up in-store, spanning various items from restaurant meals to luxury goods and even vehicles. The adoption of pickup options in the US saw a 37% increase from 2021 to 2022, and this trend is expected to persist beyond 2023 as customers increasingly prefer such convenient choices. Looking ahead, the US is expected to have 94.7 million mPOS users by 2027, highlighting the lasting popularity of untethered shopping experiences. The projected average mobile transaction value exceeding $10,000 in 2024 underscores the continued and growing prevalence of this transformative retail trend. This shift emphasizes the crucial role of Point of Sale (POS) systems, including the Point of Sale (PoS) Software Market, in not only enhancing in-store experiences but also revolutionizing the entire retail ecosystem.

• Cashless Transactions Via Mobile POS Systems
For individuals who were accustomed to shopping at traditional brick-and-mortar establishments, the onset of the COVID-19 pandemic raised heightened concerns regarding health and hygiene. Presently, many consumers exercise increased caution when it comes to interacting with surfaces, particularly those situated behind checkout counters. In response to this, the adoption of cashless transactions surged as a means to minimize physical contact and mitigate the use of cash. As the preference for contactless payments grows due to their perceived hygienic advantages, the shift towards cashless transactions seems poised to extend beyond the pandemic, solidifying itself as the new norm in future consumer behavior. A recent report on POS trends during the pandemic by Mastercard underscores this shift, revealing that 74% of consumers express the intention to persist with contactless payments even after the pandemic subsides.
Beyond offering a cleaner transaction method, many shoppers are drawn to the expediency of tap-and-pay as a more convenient way to conclude transactions in retail establishments. This trend has boosted the increased adoption of mobile point-of-sale (mPOS) systems among retailers, facilitating their ability to cater to a larger clientele engaging in touchless payments and utilizing mobile wallets.In the contemporary landscape, mPOS systems have transcended their initial role of processing customer payments. Numerous mobile POS solutions now encompass features such as product catalogs, inventory management, and advanced sales reporting, among other functionalities. Through these comprehensive mobile POS systems, retailers gain the capability to seamlessly handle tasks ranging from ordering and managing inventory to scheduling and tracking deliveries, all consolidated within a singular mobile solution. This transformative shift underscores the significance of the Point of Sale (PoS) Software Market in shaping the future of retail operations.
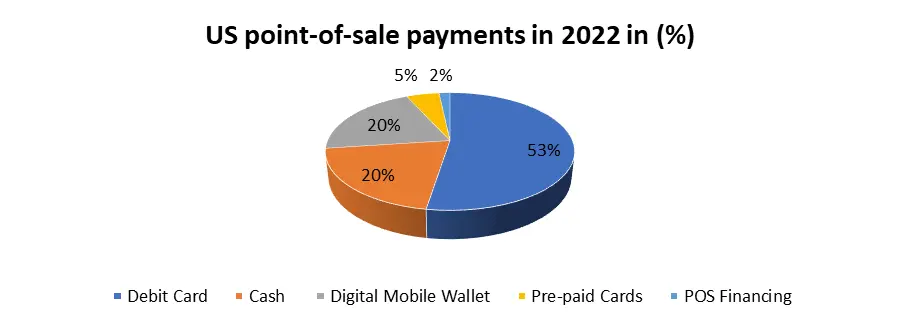
For Instance, transitioning away from a predominantly cash-driven economy, credit cards represented 40% of US point-of-sale payments in 2023, while debit cards constituted 31%. Cash transactions comprised a mere 12% of POS transactions. The rise of digital/mobile wallets is notable, with their share expected to increase from 6% in 2019 to 15.5% by 2024. Popular payment options in this category encompass Google Wallet, Apple Pay, PayPal, Venmo, CashApp, and various other applications and services.
Point of Sale (PoS) Software Market Dynamics
Rising Demand for Streamlined Operations Boost the Point of Sale (PoS) Software Market Growth
The growing demand for streamlined operations reflects a widespread business need to boost efficiency and productivity. In a fiercely competitive environment, companies are increasingly turning to Point of Sale (PoS) software solutions that seamlessly integrate with their existing workflows. These solutions offer real-time inventory management, sales analytics, and employee performance tracking, enabling organizations to optimize daily processes. This optimization not only reduces manual errors but also expedites transaction processing, translating to time and cost savings. The emphasis on streamlined operations is not solely a cost-cutting measure; it's a strategic move to enhance customer service through quicker and more accurate transactions.
Efficient operations empower businesses to swiftly adapt to market changes, ensuring competitiveness and enabling a focus on strategic initiatives. In a dynamic commercial landscape, where agility is paramount, streamlined operations foster growth and sustainability. Businesses utilizing advanced PoS solutions position themselves to navigate challenges effectively and meet evolving consumer expectations. Ultimately, the pursuit of operational efficiency becomes a cornerstone for businesses aiming to thrive in a dynamic and ever-evolving Point of Sale (PoS) Software market.
High Implementation Costs Limit the Point of Sale (PoS) Software Market Growth
The Point of Sale (PoS) Software market poses a significant challenge for businesses, particularly small and medium-sized enterprises (SMEs), due to substantial expenses associated with implementation. The initial financial commitment required to embrace PoS solutions encompasses elements such as software permits, hardware investments, and staff training expenditures. For SMEs operating within constrained financial limits, these upfront costs act as a deterrent, hindering their ability to modernize and digitize their point-of-sale operations. Beyond the direct financial consequences, there are secondary costs linked to potential disruptions during the implementation phase. Transitioning from traditional systems to PoS solutions necessitates temporary shutdowns, staff retraining, and adjustments to workflow, leading to productivity setbacks and operational difficulties. Continuous maintenance expenses and subscription charges further contribute to the overall financial burden, transforming it into a prolonged fiscal obligation.
While larger enterprises might have the financial capacity to absorb these costs, smaller businesses face challenges in justifying such investments, especially if they perceive their existing systems as adequate for their current requirements. As businesses carefully weigh the advantages of PoS software against these considerable implementation costs, it becomes imperative for software providers to present adaptable pricing structures, illustrate discernible returns on investment, and furnish support mechanisms to address the financial barriers inhibiting widespread adoption in the Point of Sale (PoS) Software market.
For Instance, A Point of Sale (POS) system typically ranges from $3,000 to $10,000 in cost. However, the precise price is contingent upon the specific type of POS hardware, software, and the extent of customization you opt for. The choice of POS software influences compatibility, with certain systems restricted to running exclusively on devices from their brand. On the other hand, open-source POS systems offer greater flexibility, capable of operating on a wide range of popular devices available in the market. Therefore, the overall expense of implementing a POS system is subject to variations based on these factors, emphasizing the importance of considering hardware and software specifications, brand restrictions, and customization preferences when assessing the total cost of adopting a POS solution.
Average POS prices by industry
| Industry | Installation costs | Hardware costs | Software costs | Payment processing fees |
| Retail | $0–2,000 | $1,000–5,000 | $0–250 per month, $0–60 per additional register | 2–3% |
| Restaurant | $500–10,000 | $2,000–10,000 | $0–250 per month, $0–60 per additional register | 2–3% |
| Cafe | $0–2,000 | $1,000–5,000 | $0–200 per month | 2–3% |
| Food truck | $0–1,000 | $500–1,000 per truck | $0–150 per month | 2–3% |
| Health and wellness | $0–5,000 | $2,000–10,000 | $0–200 per month | 2–3% |
Analytics And Business Intelligence Creates Lucrative Growth Opportunities for The Point of Sale (PoS) Software Market Growth
The integration of advanced analytics and business intelligence within Point of Sale (PoS) software is creating lucrative growth opportunities for the Point of Sale (PoS) Software Market. By offering real-time data insights and comprehensive reporting features, PoS solutions empower businesses to make informed decisions, optimize operations, and enhance customer experiences. This functionality enables retailers to identify trends, manage inventory effectively, and tailor marketing strategies, fostering increased efficiency and profitability. As businesses increasingly prioritize data-driven decision-making, PoS software providers that deliver strong analytics capabilities position themselves at the forefront of the market. The demand for sophisticated, analytics-driven PoS solutions is expected to grow, presenting a significant avenue for market growth as businesses seek to gain a competitive edge and extract actionable insights from their transaction data.
Point of Sale (PoS) Software Market Segment Analysis:
Based on Components, the global Point of Sale (PoS) Software Market is segmented Software and Services. In this Software dominated the market in 2024 and is expected to dominate in the forecasted period as Core software platforms are essential to PoS operation, while services are supplementary and high demand for feature-rich platforms with billing, CRM, and inventory integration.
Based on Deployment Mode, the global Point of Sale (PoS) Software Market is segmented into Cloud and On-premise. In this On-premises segment dominated the deployment segment of the Point of Sale (PoS) Software Market in the year 2024. This deployment approach involves implementing the PoS software directly within a business's physical location rather than relying on external servers or cloud-based solutions. The prevalence of on-premises deployment is attributed to its perceived advantages, including localized control, heightened security, and the ability to operate without continuous reliance on external network connectivity. Businesses favor on-premises solutions for their perceived reliability and the assurance of having direct oversight over their systems. Despite the emergence of alternative deployment methods, the on-premises segment continues to lead, driven by the inherent trust placed in self-contained, localized PoS implementations by a diverse array of businesses seeking stability and control over their point-of-sale operations.
Point of Sale (PoS) Software Market Regional Analysis:
Asia Pacific Region Dominated the Point of Sale (PoS) Software Market in the year 2023.
The dominance of the Point of Sale (PoS) Software Market is evident in the Asia Pacific region, where it has experienced significant growth and influence. Due to strong economic growth in key countries such as India China, rapid urbanization, and a thriving retail sector. As businesses in different industries increasingly acknowledge the crucial role of PoS software in improving operational efficiency and customer experience, there is a notable surge in demand for such solutions in the Asia Pacific region. The proactive adoption of advanced technologies and a growing preference for digital payment methods contribute to the heightened need for sophisticated PoS software.
Local Point of Sale (PoS) Software Market intricacies, cultural preferences, and regulatory frameworks also play a role, emphasizing the importance of solutions tailored to the region. Domestic and international PoS software providers in the Asia Pacific region are well-positioned to provide to diverse consumer needs and contribute to the ongoing innovation of the Point of Sale (PoS) Software Market.
Point of Sale (PoS) Software Market Scope : Inquire before buying
| Global Point of Sale (PoS) Software Market | |||
|---|---|---|---|
| Report Coverage | Details | ||
| Base Year: | 2024 | Forecast Period: | 2025-2032 |
| Historical Data: | 2019 to 2024 | Market Size in 2024: | USD 13.60 Bn. |
| Forecast Period 2025 to 2032 CAGR: | 10.6% | Market Size in 2032: | USD 30.45 Bn. |
| Segments Covered: | by Component | Software Services |
|
| by Deployment Mode | Cloud On-premise |
||
| by Application | Inventory Management Sales Reporting Customer Management (CRM) Employee Management Billing & Order Management Loyalty Programs Returns, Exchanges, & Discounts Analytics & Reporting |
||
| by Organization Size | Large Enterprise Small and Medium Enterprise (SME) |
||
| by End User | Retail Hospitality Healthcare Entertainment & Sports Venues E-commerce Others |
||
Point of Sale (PoS) Software Market, by Region
North America (United States, Canada and Mexico)
Europe (UK, France, Germany, Italy, Spain, Sweden, Austria and Rest of Europe)
Asia Pacific (China, South Korea, Japan, India, Australia, Indonesia, Malaysia, Vietnam, Taiwan, Bangladesh, Pakistan and Rest of APAC)
Middle East and Africa (South Africa, GCC, Egypt, Nigeria and Rest of ME&A)
South America (Brazil, Argentina and Rest of South America)
Point of Sale (PoS) Software Market, Key Players
North America
1. Square (United States)
2. Toast (United States)
3. Lightspeed (Canada)
4. Revel Systems (United States)
5. NCR Corporation (United States)
6. ShopKeep (United States)
7. Clover (United States)
8. Heartland Payment Systems (United States)
9. Poynt (United States)
10. Upserve (United States, acquired by Lightspeed)
11.Square for Restaurants (United States)
Asia Pacific
1. MobiPOS (Singapore)
Europe
1. Epos Now (United Kingdom)
2. Loyverse (United Kingdom)
3. Ingenico Group (France)
Frequently Asked Questions:
1] What segments are covered in the Global Point of Sale (PoS) Software Market report?
Ans. The segments covered in the Point of Sale (PoS) Software Market report are based on, Component, Deployment Mode, Application, Organisation Size, End-Users, and Regions.
2] Which region is expected to hold the highest share in the Global Point of Sale (PoS) Software Market?
Ans. The Asia Pacific region is expected to hold the largest share of the Point of Sale (PoS) Software Market.
3] What is the market size of the Global Point of Sale (PoS) Software Market by 2032?
Ans. The market size of the Point of Sale (PoS) Software Market by 2032 is expected to reach USD 30.45 Bn.
4] What is the forecast period for the Global Point of Sale (PoS) Software Market?
Ans. The forecast period for the Point of Sale (PoS) Software Market is 2025-2032.
5] What was the market size of the Global Point of Sale (PoS) Software Market in 2024?
Ans. The market size of the Point of Sale (PoS) Software Market in 2024 was valued at USD 13.60 Bn.