
Networking Ports Market Size by Port Shipment, Infrastructure, Region – Segment-Level Market Assessment, Growth Opportunity Analysis, Competitive Mapping & Forecast to 2032
Overview
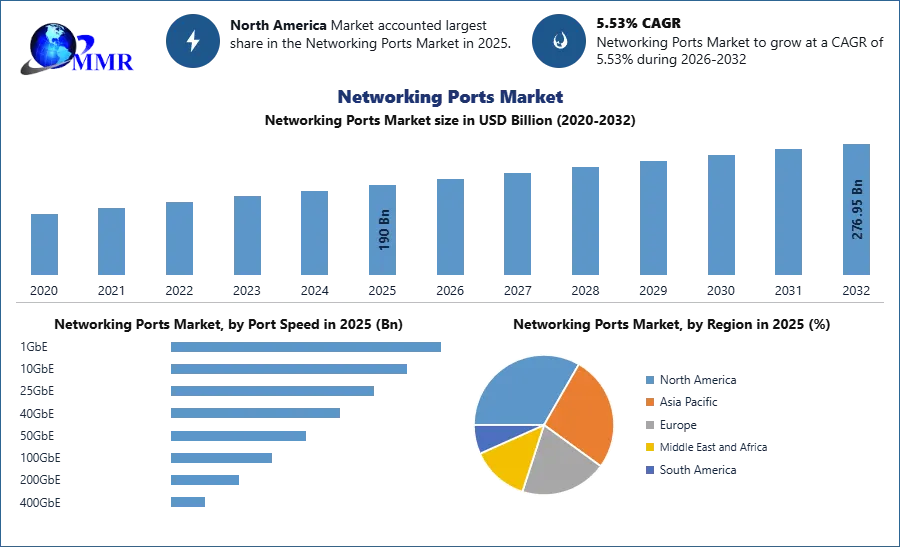
Networking Ports Market was valued USD 190 Bn in 2025 and the total revenue is expected to grow at CAGR of 5.53 % from 2025 to 2032, reaching USD 276.95 Bn.
Networking Ports Market Overview:
High-speed data transfer in this new era is a must. Whether it is the service or manufacturing industry, software and related networks have become an important part of business. Essentially, all electronic devices need network ports. In order to connect with peripherals and computer networks, these ports provide input and output interfaces for computers. Many data centers are in constant need of routers that are strong in nature in order to accommodate heavy data traffic. The protection of the routers also plays a critical role for deployment alongside software frameworks which makes for improved security for routed data traffic.
 To know about the Research Methodology :- Request Free Sample Report
This is a comprehensive global report targeted on present and future prospects of the Global Networking Ports Market. The report presents a consolidation of primary and secondary analysis that provides market size, share, dynamics and forecast for numerous segments and sub-segments considering the macro and small environment factors. The report also covers an in-depth analysis of COVID 19 pandemic impact on the sales revenue of Global Networking Ports Market by year-wise and region and on the key players revenue affected and expected short term and long-term impact on the market.
Networking Ports Market – Dynamics
The global networking ports market is majorly driven by growing virtualization of network infrastructure. Extensive use of network mapping by companies to increase productivity and performance and reduce cost. The key factor in the growth of the router segment is the emergence of router solutions that are ideal for different environment. Many data centers are in constant need of routers that are strong in nature in order to accommodate heavy data traffic.
Privacy and Security are the main concerns of the market which will hamper the growth of the product. Many data centers are in constant need of routers that are strong in nature in order to accommodate heavy data traffic. The protection of the routers also plays a key role for deployment together with software frameworks, which allows better security for routed data traffic.
Based on port shipment, 10GbE port segment has led the networking ports market in 2025 and is estimated to generate more than USD xx Bn market revenue by 2032 with a CAGR of xx% greater in comparison to the 1GbE segment. As most of the latest data centers being designed using 10GbE switch ports in the Top of Rack switches, the shipping of 1GbE ports experiencing a decrease. When a vast number of data operators are implementing white box switches manufacturers such as Dell and HP have been required to present open networking switches to deal with white box switches on the market.
Networking Ports Market Regional Analysis
The Global Networking Ports Market has been segmented into North America, South America, Asia Pacific, and the Middle East and Africa. North America leads with the market share of 5.53% in 2025 and is expected to reach USD 235.6 Bn by the end of 2032 with a CAGR of 5.53%. Factors such as massive data center acquisitions by US firms can be attributed to the growth of this area. The bulk of data centers in the US are operated by multinational content protection policies, telecommunication companies and controlled hosting service providers. The data centers are becoming network function virtualization enabled facilities and software defined with a rapid pace of data center development in the US and introduction of high performance networks will lead the high revenue generation.
The objective of the report is to present a comprehensive analysis of the Global Networking Ports Market including all the stakeholders of the industry. The past and current status of the industry with forecasted market size and trends are presented in the report with the analysis of complicated data in simple language. The report covers all the aspects of the industry with a dedicated study of key players that includes market leaders, followers and new entrants. PORTER, SVOR, PESTEL analysis with the potential impact of micro-economic factors of the market have been presented in the report. External as well as internal factors that are supposed to affect the business positively or negatively have been analyzed, which will give a clear futuristic view of the industry to the decision-makers.
The report also helps in understanding Global Networking Ports Market dynamics, structure by analyzing the market segments and project of the Global Networking Ports Market size. Clear representation of competitive analysis of key players By Port Shipment, Price, Financial position, Product portfolio, Growth strategies, and Regional Presence in the Global Networking Ports Market make the report investor’s guide.
Recent Industry Developments
| Exact Date | Company | Development | Impact |
|---|---|---|---|
| 16 March 2026 | Nokia | Nokia launched a suite of application-optimized optical solutions and PON-based out-of-band management for AI-era data centers. | This development significantly reduces power consumption and physical space requirements for high-density networking port deployments. |
| 02 March 2026 | NVIDIA & TIM Brasil | NVIDIA expanded its partnership with TIM Brasil to deliver a next-generation AI-Ready 5G network infrastructure. | The collaboration accelerates the demand for high-bandwidth Ethernet ports capable of handling AI-native mobile traffic. |
| 17 February 2026 | Ericsson | Ericsson introduced ten AI-ready radios and AI RAN software featuring neural network accelerators ahead of MWC 2026. | The rollout drives the transition toward 800 GbE port architectures to support massive MIMO and low-latency AI applications. |
| 16 January 2026 | Arista Networks | Arista announced the full commercial availability of its Ethernet-AI switching fabric designed for large-scale GPU clusters. | The product launch solidifies the shift from InfiniBand to standardized Ethernet ports in hyperscale AI data centers. |
| 28 October 2025 | NVIDIA & Nokia | NVIDIA and Nokia established a strategic partnership to develop AI-RAN innovation and the Aerial RAN Computer platform. | This partnership integrates optical networking technologies into AI infrastructure, increasing the efficiency of edge computing ports. |
| 14 May 2025 | Cisco Systems | Cisco completed the integration of Splunk's telemetry data into its Silicon One networking port architecture. | The integration enhances real-time port-level security and predictive maintenance capabilities for enterprise networks. |
Scope of Global Networking Ports Market: Inquire before buying
| Networking Ports Market | |||
|---|---|---|---|
| Report Coverage | Details | ||
| Base Year: | 2025 | Forecast Period: | 2026-2032 |
| Historical Data: | 2020 to 2025 | Market Size in 2025: | 190 USD Billion |
| Forecast Period 2026-2032 CAGR: | 5.53% | Market Size in 2032: | 276.95 USD Billion |
| Segments Covered: | by Port Speed | 1GbE 10GbE 25GbE 40GbE 50GbE 100GbE 200GbE 400GbE |
|
| by Infrastructure | Ethernet Switches Routers Storage Networking Data Centers |
||
| by End User | Enterprises Cloud Service Providers Telecommunications Service Providers |
||
Networking Ports Market, By Region
• North America
• Europe
• Asia-Pacific
• MEA & Africa
• Latin America
Networking Ports Market key players
- Cisco Systems, Inc.
- Huawei Technologies
- Juniper Networks, Inc.
- Hewlett Packard Enterprise
- Arista Networks, Inc.
- Nokia Corporation
- Dell Technologies
- Broadcom Inc.
- Intel Corporation
- D-Link Corporation
- TP-Link Technologies Co., Ltd.
- Extreme Networks
- Netgear Inc.
- Mellanox Technologies (NVIDIA Corporation)
- ALCATEL-LUCENT Enterprise
- TE Connectivity
- Amphenol Corporation
- Molex LLC
- Belkin International
- Allied Telesis, Inc.
- PLANET Technology Corporation
- Brocade Communications Systems, Inc.
- Fujitsu Ltd.
- ZTE Corporation
- Lantronix, Inc.