
Inventory Tags Market – Global Market Size, Strategic Growth Drivers, Risk Assessment Framework, Regulatory Landscape Review, Competitive Intensity Mapping & Long-Term Industry Outlook to 2029
Overview
Inventory Tags Market was valued at US$ 5.87 Bn. in 2022. Global Inventory Tags Market size is estimated to grow at a CAGR of 4.71%.
Inventory Tags Market Overview:
An inventory tag is referred to as a form of a label, which is attached to the inventory items to provide the requisite insights about the finished products, raw materials, and other stored elements. It helps in the easy identification of products including type, specification, and quantity. Inventory tags are critical for inventory management, streamlining production, and maintaining and planning raw material procurement. As a result of the advent of many modern technologies in inventory management, these tags serve as cost-effective solutions for tracking goods, controlling inventory flow, identifying the owner, and tracking the timeline connected with inventory goods. With the usage of inventory tags in the system, the inventory management software allows easy access to reports. The tags also are used to generate complete reports, saving time and money.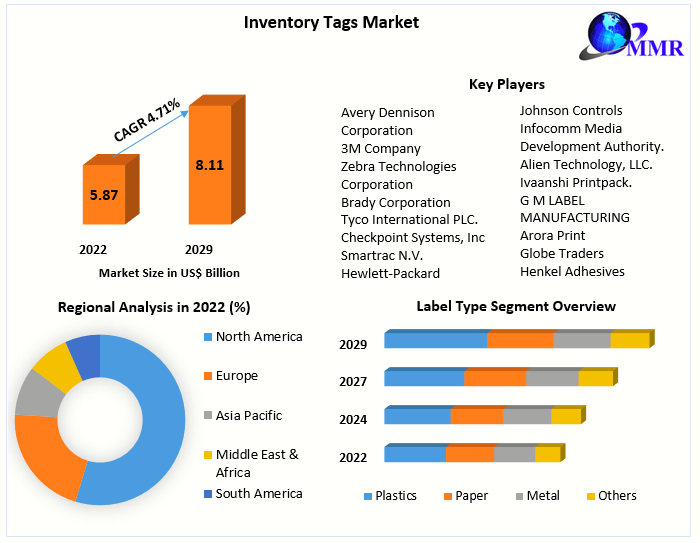 To know about the Research Methodology :- Request Free Sample Report
Inventory Tags Market Dynamics:
An Inventory tags that are attached to products assist in safe identification and tracking, along with reducing human error and therefore assisting ineffective supply chain management. Inventory tags provide specific information on products, which is expected to be used later and even enable stock to be tracked, allowing warehousing and logistics to stock their inventory just in time, leading to the growing adoption of products across the globe.
When inventory levels are consistently inaccurate, managing replenishment schedules becomes practically difficult, resulting in stockouts. It also results in a poor customer experience as customers should either wait longer for their products to arrive or consider getting their orders canceled once the error is detected. The average retail operation in the United States has a 63 % inventory accuracy. Business owners and Marketers have failed to implement proper inventory management, which might lead to errors, missed opportunities, and higher expenses. Inventory, along with accounts receivable and payments, has tied up USD 1100 billion in cash, equal to 7% of US GDP. This is in response to the region's inventory tag market penetration.
Hospitals utilize inventory tags to construct smart cabinets where all medications and other products which are delivered into the hospital are stored. These smart cabinets are linked to the hospitals' inventory management systems, making it easier for authorized workers to find supplies when they are needed. These smart cabinets have the potential to have a significant financial impact. For instance, after deploying an RFID monitoring system, Adventist Health White Memorial in Los Angeles was able to save manual inventory counting time by 67 % and save US$ 120,000 per year by using products before their expiration.
Inventory tags have also become a branding and displaying tool for retail products due to the convenience of printing. The growing internet shopping and the e-commerce business have pushed brand owners to establish warehouses to keep track of inventory and order flow data. The aforementioned considerations, inventory tags are being used more frequently, which is expected to boost the inventory tags market growth. In addition, the growing rising disposable incomes in developing countries have boosted demand for the retail product which in turn, boosted the market growth. However, high initial cost and lack of awareness about the product along with lack of skilled labor are expected to hamper the inventory market growth during the forecast period.
Inventory Tags Market Segment Analysis:
Based on the Technology, the Inventory Tags Market is segmented into RFID, Barcode, and Others. The RFID segment held the largest market share, accounting for xx% in 2022. The segment growth is attributed to the growing adoption of RFID in the automotive, pharmaceutical, and healthcare industries. The use of RFID technology can save labor costs up to 50-80% of total charges in a distribution center. Processes that need a large number of workers can be accomplished with a smaller workforce.
The retail business has been using RFID technology for a long time, and it accounts for the majority of the industry's tag volumes today. In addition, more than 72 % of all retailers intend to reinvent their supply chains by utilizing real-time inventory visibility offered by automation, sensors, and analytics. The global market for RFID tags was valued at US$ 24.5 billion in 2022 and is expected to grow significantly throughout the forecast period.
Regional Insights:
Asia Pacific region held the largest market share accounted for 34.12% in 2022. The Inventory Tags market of the Asia Pacific region is showing northward direction growth, thanks to the growing efforts towards standardization, increasing application segments, rising awareness of the benefits of employing inventory tags, and technological convergence of inventory tags. In addition, an increase in per capita disposable income, particularly in developing economies, such as India and China is a major driver of the inventory tags market in the region. According to the China National Light Industry Council (CNLIC), more than 80% of light industrial products, require packaging and tags. In China's industrial supply chain, transportation and logistics tags are also among the fastest-growing categories.
The implementation of strict packaging laws along with growing industrialization is expected to boost the inventory tags market during the forecast period. In addition, the increasing significance given to package security along with increased security measures against theft and counterfeiting is expected to boost the inventory tags market growth in the region.
North America region is expected to witness significant growth at a CAGR of 4.38% during the forecast period. The growing adoption of inventory tags particularly in retail and wholesale stores and industry is driving the inventory tags market growth in the region.
The objective of the report is to present a comprehensive analysis of the global Inventory Tags Market to the stakeholders in the industry. The past and current status of the industry with the forecasted market size and trends are presented in the report with the analysis of complicated data in simple language. The report covers all the aspects of the industry with a dedicated study of key players that include market leaders, followers, and new entrants.
PORTER, PESTEL analysis with the potential impact of micro-economic factors of the market have been presented in the report. External as well as internal factors that are supposed to affect the business positively or negatively have been analyzed, which will give a clear futuristic view of the industry to the decision-makers.
The reports also help in understanding the Inventory Tags Market dynamic, structure by analyzing the market segments and projecting the Inventory Tags Market size. Clear representation of competitive analysis of key players by Technology, price, financial position, product portfolio, growth strategies, and regional presence in the Inventory Tags Market make the report investor’s guide.
Inventory Tags Market Scope: Inquiry Before Buying
| Inventory Tags Market | |||
|---|---|---|---|
| Report Coverage | Details | ||
| Base Year: | 2022 | Forecast Period: | 2023-2029 |
| Historical Data: | 2018 to 2022 | Market Size in 2022: | US $ 5.87 Bn. |
| Forecast Period 2023 to 2029 CAGR: | 4.71% | Market Size in 2029: | US $ 8.11 Bn. |
| Segments Covered: | by Label Type | Plastics Paper Metal Others |
|
| by Technology | RFID Barcodes Others |
||
| by End-User | Industrial Commercial Retail Others |
||
Inventory Tags Market by Region
North America (United States, Canada and Mexico)
Europe (UK, France, Germany, Italy, Spain, Sweden, Austria and Rest of Europe)
Asia Pacific (China, South Korea, Japan, India, Australia, Indonesia, Malaysia, Vietnam, Taiwan, Bangladesh, Pakistan and Rest of APAC)
Middle East and Africa (South Africa, GCC, Egypt, Nigeria and Rest)
Key Players are:
1.Avery Dennison Corporation
2.3M Company
3.Zebra Technologies Corporation
4.Brady Corporation
5.Tyco International PLC.
6.Checkpoint Systems, Inc
7.Smartrac N.V.
8.Hewlett-Packard Company
9.Cenveo Inc.
10.Alien Technology, Inc.
11.Johnson Controls
12.Infocomm Media Development Authority.
13.Alien Technology, LLC.
14.Ivaanshi Printpack.
15.G M LABEL MANUFACTURING
16.Arora Print
17.Globe Traders
18.Henkel Adhesives Technologies India Private Limited
19.IMDA
Frequently Asked Questions:
1] What segments are covered in the Inventory Tags Market report?
Ans. The segments covered in the Inventory Tags Market report are based on Label Type, Technology, and End-User.
2] Which region is expected to hold the highest share in the Inventory Tags Market?
Ans. The Asia Pacific region is expected to hold the highest share in the Inventory Tags Market.
3] What is the market size of the Inventory Tags Market by 2029?
Ans. The market size of the Inventory Tags Market by 2029 is US$ 8.11 Bn.
4] What is the forecast period for the Inventory Tags Market?
Ans. The forecast period for the Inventory Tags Market is 2023-2029.
5] What was the market size of the Inventory Tags Market in 2022?
Ans. The market size of the Inventory Tags Market in 2022 was US$ 5.87 Bn.