
Industrial Valves Market- Industry Structure Evaluation, Demand Drivers Analysis, Regional Growth Analysis and Identification, Competitive Positioning Review & Global Market Size Forecast to 2032
Overview
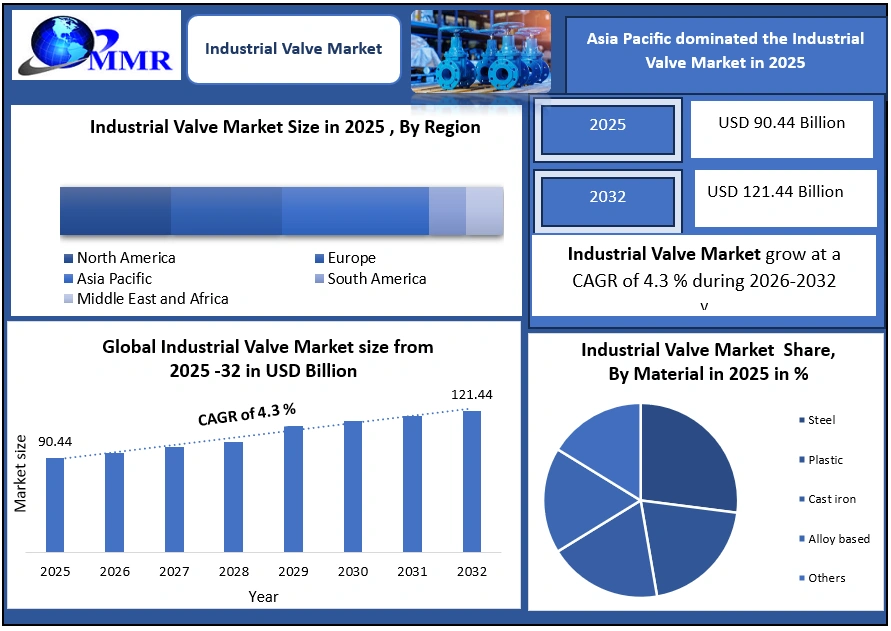
Global Industrial Valve Market to reach USD 121.44 Bn by 2032 from USD 90.44 Bn in 2025 at 4.3 % CAGR from 2026 to 2032.
Industrial Valve Market Overview
Industrial valves are essential flow-control components for oil & gas, power, water treatment, chemicals, mining, and manufacturing. The US, China, India, Germany, Japan, South Korea, Saudi Arabia, UAE, and Canada host some of the world’s most valve-intensive infrastructures. These include over 1.9 million km of oil & gas pipelines, thousands of refineries, power plants, desalination facilities, and chemical plants.
 To know about the Research Methodology:-Request Free Sample Report
In 2024-25, global oil demand averaged over 103 million barrels per day, while electricity generation capacity continued to expand across Asia-Pacific and the Middle East. These energy-intensive systems rely heavily on industrial valves, to ensure safe, continuous, and efficient fluid regulation. At the same time, water utilities worldwide lose nearly 30% of supplied water due to leakage, significantly increasing demand for reliable industrial valves in water distribution and wastewater treatment networks.
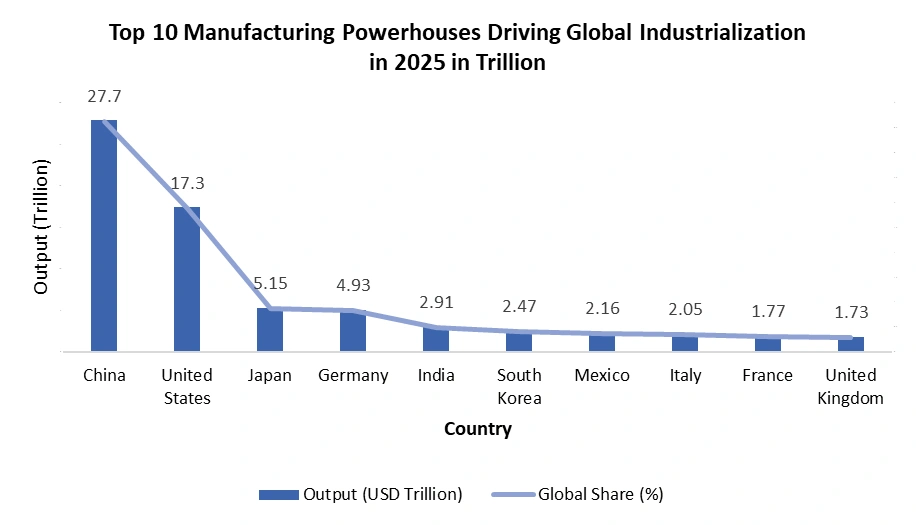
As of 2024, China accounts for 27.7% of global manufacturing output, followed by the United States (17.3%), Japan, Germany, and India. Industrial valve demand closely tracks industrialization, infrastructure expansion, and automation adoption across these countries. Large-scale projects in refineries, pipelines, water treatment, and power plants continue to drive multi-year valve requirements.
Market Highlights 2025
• Oil & gas operations consume nearly 30% of all industrial valves globally, driven by upstream wellheads, midstream pipelines, and downstream refineries.
• Over 80% of refineries worldwide use automated or semi-automated control valves for flow, pressure, and temperature regulation.
• Water & wastewater utilities lose 25–30% of treated water annually due to leakage pushing municipalities to replace aging gate and butterfly valves.
• Industrial automation penetration crossed 75% in large manufacturing facilities, accelerating demand for actuated and smart valves.
• More than 60% of new industrial projects now specify valves with low-emission packing or fire-safe certification to comply with environmental and safety standards.
These indicators show that industrial valve demand is structurally linked to infrastructure expansion, asset aging, and regulatory tightening, not short-term cycles.
Industrial Valve Market: Dynamics
Industrialization and Infrastructure Development to drive the Industrial Valve Market
Rapid expansion of oil & gas pipelines, chemical plants, and power units is boosting valve demand. China, India, the US, and the Middle East lead this growth. Large-scale projects require thousands of valves across varied pressure and temperature ranges. For Instance, in 2024-25 China operated over 40% of global chemical capacity and continues expanding LNG terminals and refineries. India is currently adding 50+ city gas distribution networks and new water treatment plants. Saudi Arabia, UAE, and Qatar produce 30%+ of global desalinated water, while the US and Canada manage 2.15 million km of pipelines, ensuring sustained valve demand across projects.
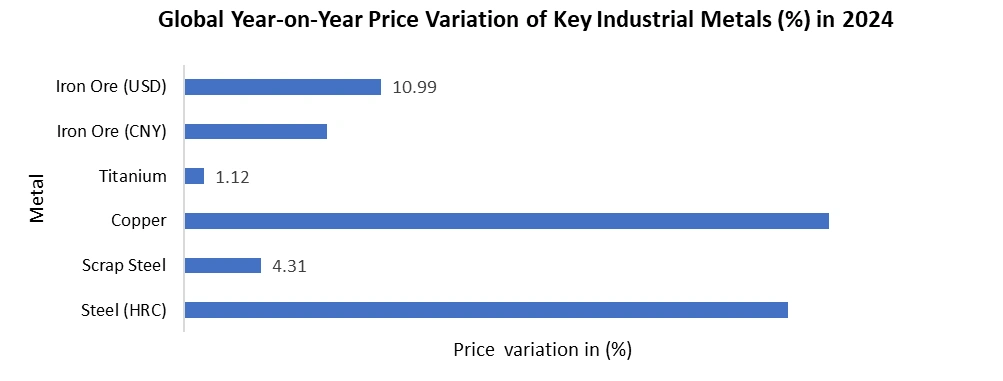
Volatile Raw Material Prices limits the growth of industrial valve market
Despite strong demand fundamentals, the industrial valve market faces challenges from volatile raw material prices. Industrial valves are manufactured using carbon steel, stainless steel, alloy steel, and specialty metals, whose prices fluctuate due to energy costs, geopolitical disruptions, and supply chain imbalances. These fluctuations increase production costs, impact profit margins for valve manufacturers, and delay procurement cycles for large industrial projects.
 Smart & IoT-Enabled Valve Solutions create lucrative growth opportunities to the market growth
The shift toward smart factories, digital oilfields, and intelligent water networks is accelerating demand for smart industrial valves. Sensor-enabled valves with real-time monitoring reduce leakage by up to 15% and maintenance costs by 20%. Countries such as Germany, the US, China, and South Korea are rapidly deploying IIoT-integrated valves with SCADA systems, driving adoption of smart actuators and AI-based diagnostics.
Industrial Valve Market Segment Analysis
Ball valves dominated the industrial valve market in 2025 due to their simple design, tight shut-off capability, low maintenance requirements, and suitability for automation. They are widely used in oil & gas pipelines, power plants, water treatment facilities, and chemical processing units. Their ability to handle high pressure and temperature makes them the preferred choice for critical applications. Control valves and smart industrial valves represent the fastest-growing segment. Increasing adoption of process automation, digital twins, and predictive analytics has elevated demand for valves capable of precise flow modulation and real-time diagnostics.
Asia-Pacific: Global Hub for Industrial Valve Demand
Asia-Pacific led the industrial valve landscape in 2025, driven by the world’s largest manufacturing and infrastructure base. China contributed over 30% of global manufacturing output in 2025, with industrial production exceeding USD 4.6 trillion, sustaining strong demand for control, ball, gate, and butterfly valves across chemicals, power, refining, and LNG. India, with manufacturing output near USD 490 billion, continues expanding refineries, gas pipelines, and water infrastructure, boosting demand for automated and mid-pressure valves. Japan and South Korea add high-value demand through precision and automation-ready valves used in LNG, electronics, hydrogen, and clean energy projects, supported by government-backed smart manufacturing initiatives.
• More than 45% of global industrial capital expenditure concentrated in the region in 2025
• Over 60% of new chemical plants and refineries commissioned since 2020
• Fastest adoption of electric actuators and smart control valves
• Expanding water, wastewater, and gas pipeline networks across China and India
Emerging Growth Regions
• Middle East: More than USD 1 trillion energy and water investments by 2030
• Latin America: Large-scale pipeline modernization across Brazil and Argentina
• Africa: Rising oil, gas, and urban water infrastructure in Nigeria and Egypt
Competitive Landscape and Strategic Performance
As of 2024–2025, the industrial valve market is moderately consolidated, driven by digitalization, automation, and aftermarket services. Emerson Electric deployed digital valve controllers across 1,200+ plants, launching AVENTICS Series 625 & XV (<0.5% control deviation). Flowserve’s aftermarket now exceeds 40% of revenue. KSB SE & Co. cut energy losses by 10–15%, while IMI plc reduced unplanned shutdowns up to 20%, targeting smart, IoT-enabled, and hydrogen/LNG valve applications.
Top Industrial Valve Manufacturers – Strategic Highlights (2024–2025)
| Company | Country | Key Developments | Numerical Impact |
| Emerson Electric | US | Digital controllers, AVENTICS Series 625 & XV | 1,200+ plants, ~25% efficiency gain |
| Flowserve Corporation | US | Severe-service valves, aftermarket growth | Aftermarket >40% revenue |
| KSB SE & Co. | Germany | Energy-efficient, hydrogen-ready valves | 10–15% lifecycle energy reduction |
| KITZ Corporation | Japan | High-precision LNG & chemical valves | Zero-tolerance failure, smart factory adoption |
| IMI plc | UK | Smart diagnostics, predictive maintenance | Up to 20% reduction in shutdowns |
Industrial Valves Market Scope : Inquire before buying
| Global Industrial Valves Market | |||
|---|---|---|---|
| Report Coverage | Details | ||
| Base Year: | 2025 | Forecast Period: | 2026-2032 |
| Historical Data: | 2020 to 2025 | Market Size in 2025: | USD 90.44 Bn. |
| Forecast Period 2026 to 2032 CAGR: | 4.3% | Market Size in 2032: | USD 121.44 Bn. |
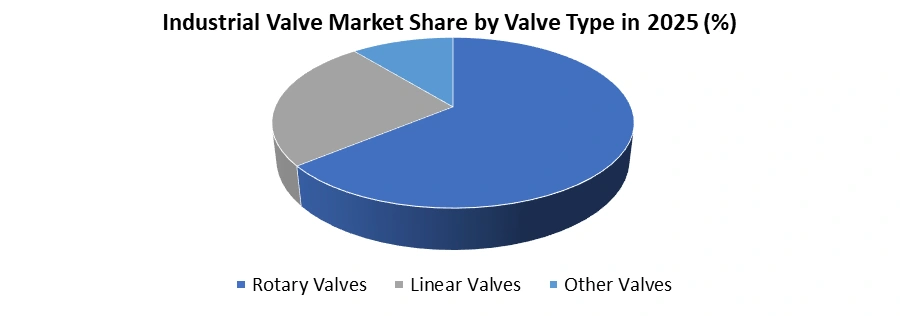
| Segments Covered: | by Type | Rotary Valves Ball valves Butterfly valves Plug valves Linear Valves Gate valves Globe valves Diaphragm valves Other Valves Check valves Safety & relief valves Needle valves |
|
| by Fluid Type | Liquid Gas Others |
||
| by Material | Steel Plastic Cast iron Alloy based Others |
||
| by Component | Actuators Valve body Others |
||
| by Size | Up to 1” 1”–6” 7”–25” 26”–50” Above 50” |
||
| by Actuation Type | Manual Electric Pneumatic Hydraulic |
||
| by End Use Industry | Solenoid Chemical Energy & utilities Construction Metal & Mining Agriculture Pharmaceutical Food & beverages Pulp & paper Others |
||
| by Distribution Channel | Direct sales Indirect sales |
||
Industrial Valve Market, by Region:
North America (United States, Canada, and Mexico)
Europe (UK, France, Germany, Italy, Spain, Sweden, Austria, and the Rest of Europe)
Asia Pacific (China, South Korea, Japan, India, Australia, Indonesia, Malaysia, Vietnam, Taiwan, Bangladesh, Pakistan, and the Rest of APAC)
Middle East and Africa (South Africa, GCC, Egypt, Nigeria, and the Rest of ME&A)
South America (Brazil, Argentina Rest of South America)
Industrial Valve Key Players
1. Emerson Electric Co.
2. Flowserve Corporation
3. Schlumberger / Cameron
4. IMI plc
5. Kitz Corporation
6. Crane Co.
7. Weir Group
8. Alfa Laval
9. AVK Holding A/S
10. Velan Inc.
11. KSB SE & Co. KGaA
12. Spirax-Sarco Engineering plc
13. Bray International
14. Neway Valve (Suzhou) Co., Ltd.
15. Samson AG
16. BEL Valves Limited
17. Larsen & Toubro (L&T) Valves Limited
18. Kirloskar Brothers Ltd (KBL)
19. Forbes Marshall
20. Mankenberg GmbH
21. Georg Fischer AG
22. KLINGER Group
23. LESER GmbH & Co. KG
24. Parker Hannifin Corporation
25. Others
Frequently Asked Questions:
1. What are industrial valves and their main applications?
Industrial valves are devices controlling fluid flow in pipelines and systems. Key applications include oil & gas, power generation, chemical processing, water treatment, mining, and manufacturing.
2. Which types of industrial valves are most used?
Popular types are gate, globe, ball, butterfly, plug, diaphragm, and control valves, each tailored for specific pressure, temperature, and flow conditions.
3. Which regions drive industrial valve demand?
Asia-Pacific dominates, led by China, India, Japan, and South Korea, with North America and the Middle East also seeing strong demand from pipeline, refinery, and water infrastructure projects.
4. How are smart valves transforming the market?
IIoT-enabled valves with sensors and actuators enable predictive maintenance, leak detection, and remote monitoring, reducing maintenance costs by up to 20% and leakage by 15%.
5. Who are the leading industrial valve manufacturers?
Top global players include Emerson Electric, Flowserve Corporation, KSB SE & Co., KITZ Corporation, and IMI plc, focusing on automation-ready solutions, digitalization, and aftermarket services.