Graph Analytics Market: Global Industry Analysis and Forecast (2024-2030)

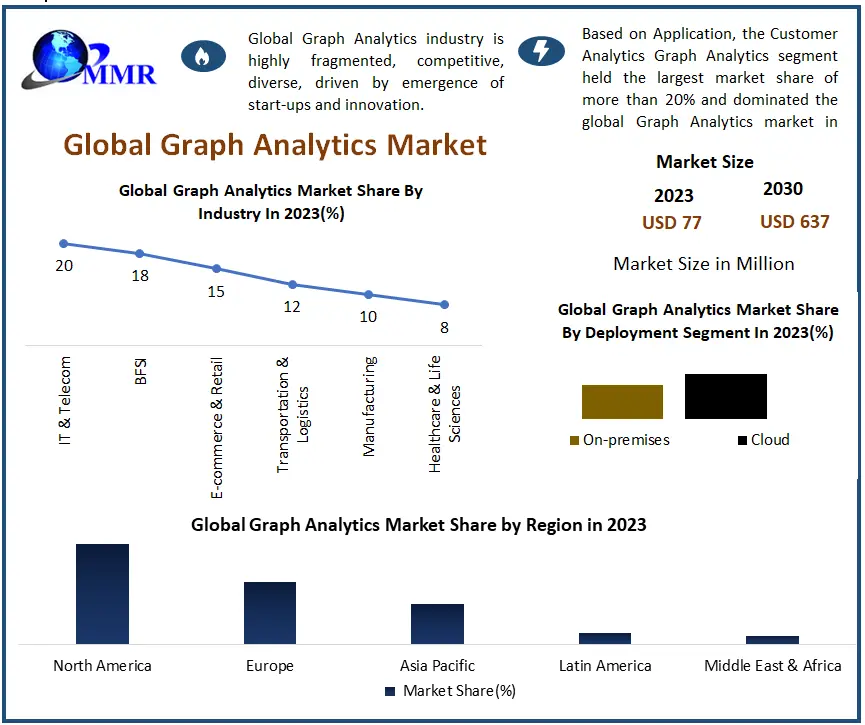
The Graph Analytics Market size was valued at USD 77 Million in 2023 and the total Graph Analytics revenue is expected to grow at a CAGR of 35% from 2024 to 2030, reaching nearly USD 637 Million. Graph Analytics is an analytical tool used to determine the strength and direction of relationships between objects in a graph. The major focus of graph analytics is on the pair-wise relationship between two objects at a time and structural characteristics of the graph, completely. Most organizations leverage graph models to gain insights, which are used in marketing or as an example for analyzing social networks. Also, graph Analytics finds its applications in various domains such as clustering, searching, shortest path solution, partitioning, widest path solution, page ranking, and finding connected components, among many others. For every type of graph analytics, there are various numbers of algorithms, including simple heuristics and computationally intensive algorithms, for finding perfect solutions. Therefore, depending on the value of the solution, various algorithms can be implemented significantly. The rapid growth of the graph analytics market is driven by various factors including the rise of specialized graph databases and improved graph algorithms, facilitating more efficient data management and deeper network analysis. Also, integration with AI and ML broadens applications, particularly in predictive analytics and fraud detection and cloud-based solutions improve accessibility. The increased data generation across industries a quest for deeper insights, and specific needs in sectors such as social media drive demand. The economic and social factors such as data value realization, privacy concerns, and personalized experiences contribute. Additionally, factors such as big data analytics adoption, government initiatives, M&A activity, and open-source solutions collectively fuel the market's robust growth, presenting substantial opportunities for technology providers. Graph Analytics MarketTo know about the Research Methodology :- Request Free Sample Report

Graph Analytics Market Dynamics

Increasing Demand for Real-time Insights The Increasing Demand for Real-time Insights in businesses across the globe is expected to be the major factor driving the global Graph Analytics market growth. As organizations recognize the transformative potential of digital technologies, they are investing heavily in Graph Analytics. The increasing demand for real-time insights is driven by the rapid growth of the graph analytics market. Businesses seek quicker decision-making to adapt to dynamic markets and customer behavior driving the market's increased adoption. Graph analytics excels in real-time responsiveness by analyzing complex, interconnected data, identifying anomalies immediately, and optimizing operations on the fly. The demand for scalable solutions leads to the development of high-performance tools capable of real-time analysis on massive datasets. Integration with data streaming platforms, real-time visualization tools, and a focus on performance optimization meet the needs of organizations requiring instantaneous insights. The cloud-based graph analytics services are gaining prominence, offering scalability and accessibility without significant upfront investments. This factor is further expected to boost the global Graph Analytics market during the forecast period. Increasingly Integrated With AI And ML Algorithms The integration of Artificial Intelligence (AI) and Machine Learning (ML) algorithms with graph analytics stands as a powerful catalyst driving the growth and evolution of the Graph Analytics market. This collaborative synergy offers substantial benefits across diverse industries. By employing AI and ML algorithms, organizations gain improved insights and predictive capabilities, allowing them to forestall customer behavior, manage risks, optimize operations, and make informed decisions. The integration facilitates automated anomaly detection and fraud prevention, empowering swift responses to suspicious activities. Additionally, AI analyzes customer relationships within graphs to personalize recommendations and improve general customer experience and loyalty. Automation of graph analytics tasks by AI and ML algorithms improves efficiency, freeing up resources for strategic analysis. The development of hybrid solutions combining the strengths of AI and ML paves the way for advanced data analysis and decision-making. This integration coupled with growing accessibility, advancements in graph database technologies, and a focus on security and privacy underscores the transformative potential of AI and ML in the graph analytics market. As collaboration intensifies additional innovations and applications are expected promising groundbreaking outcomes in the coming years. As a result, the demand for Integrated AI And ML Algorithms has been on the rise in recent years, driving the Graph Analytics market growth. Talent Gap and Skilled Workforce Shortage The rapid growth of the graph analytics market is encountering a significant impediment in the form of a talent gap and a shortage of skilled workers. This expertise deficiency poses a substantial challenge for organizations aiming to implement and harness the power of graph analytics for strategic advantages. The impacts of the talent gap on the graph analytics market are evident in various ways. The lack of skilled professionals hinders the adoption and implementation of graph analytics solutions, resulting in a slower rate of adoption and limiting the technology's potential impact across industries. The scarcity of skilled experts raises costs, leading to project delays and budget overruns, hindering the success of graph analytics initiatives. Additionally, the talent gap stifles innovation within the field and limits the development of tools, algorithms, and methodologies. Organizations struggle with limited expertise, facing challenges in effectively managing and utilizing graph analytics solutions, leading to suboptimal performance and ethical concerns. To address this strategies such as investing in talent development, promoting awareness, encouraging collaboration, increasing accessibility, developing talent pipelines, and focusing on diversity are crucial for unlocking the full potential of the graph analytics market. Implementing these strategies will ensure continued growth and a positive impact of this powerful technology.

Graph Analytics Market Segment Analysis:

Based on Application, the Customer Analytics Graph Analytics segment held the largest market share of more than 20 % and dominated the global Graph Analytics market in 2023. The segment is further expected to grow at a CAGR of 11.45% and maintain its dominance during the forecast period. The rising demand for various Graph Analytics applications designed to accelerate and streamline business processes using cutting-edge IoT technologies and cloud-based solutions are expected to be the major factors driving the segment growth. The customer analytics in graph analytics and segment analysis synergize to unveil profound insights into customer behavior-driven business growth. Customer analytics involves collecting and parsing data to discern behavior, preferences, and brand interactions, fostering predictive insights and increasing customer experience. Graph analytics, utilizing graph theory, unveils hidden connections, identifies communities, and empowers personalized recommendations. Segment analysis categorizes the customer base based on shared traits, refining marketing strategies and optimizing the customer experience. Integrating these approaches refines customer segmentation, offers nuanced behavioral insights, and tailors marketing strategies, amplifying engagement and loyalty. Applications range from identifying churn risk and predicting customer lifetime value to delivering personalized product recommendations and optimizing pricing strategies. Graph Analytics Market 
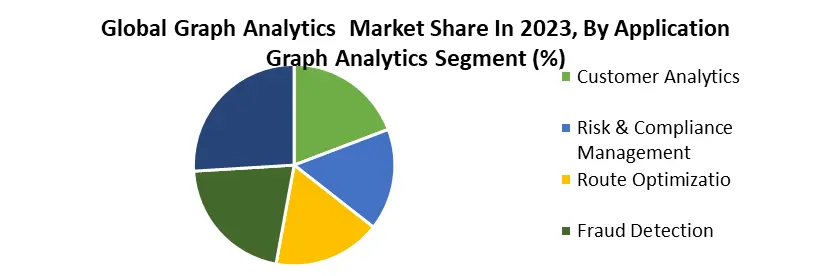
In addition, the Risk & Compliance Management Graph Analytics segment is expected to grow at a significant CAGR during the forecast period. It includes a wide range of Graph Analytics tools and solutions that are primarily intended to make the development, administration, and delivery of Graph Analytics applications and systems easier. Risk and Compliance Management is vital in navigating complex regulatory landscapes and mitigating potential risks. Leveraging Graph Analytics in Risk & Compliance Management offers a significant Graph Analytics market. It improves risk identification by unveiling hidden connections and patterns within vast datasets, allowing for the detection of potential risks missed by traditional methods. The analysis of relationships between entities facilitates anomaly detection, red flag identification, and visualization of interconnected risk networks enabling prioritized mitigation efforts. For regulatory compliance, Graph Analytics market requirements to processes, controls, and data points, automate workflows and generate compliance reports. The resource allocation is optimized by prioritizing efforts based on identified risks and potential impacts and reducing operational costs through data-driven insights. The specific applications include identifying financial crimes, managing third-party risk, and improving cybersecurity. Graph Analytics provides a 360-degree view of the risk landscape, enabling proactive risk mitigation, streamlined compliance processes, data-driven decision-making, and reduced operational costs in Risk and Compliance Management segment analysis.

Graph Analytics Market Regional Insights:

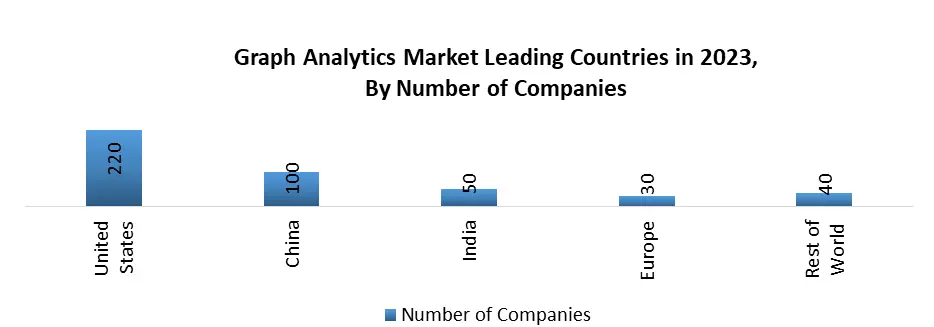
North America led the global Graph Analytics market with the highest market share of 42% in 2023. The region is further expected to grow at a CAGR of 12.4% and maintain its dominance throughout the forecast period. The strong adoption of various Graph Analytics across the business is expected to be the major factor driving the regional market growth. In addition, the region is further expected to continue to maintain its dominance throughout the forecast period due to the presence of a substantial number of small and medium-sized firms (SMEs), a high adoption rate for cutting-edge technology, and the High awareness and understanding of graph analytics solutions. Graph Analytics Market The United States is expected to be the lucrative region for the global Graph Analytics market vendors with a diverse landscape that includes established tech giants and a vibrant startup ecosystem. Significant investments in Graph Analytics solutions by major firms and SMEs in the country contributed extensively to Graph Analytics market revenue growth. As a result, the rising stringency of data privacy and security regulations and rules are further contributing factors to the North American Graph Analytics market growth. The US graph analytics market is evolving and driven by key factors. It's segmented by platform, services, cloud/on-premise deployment, and technology like graph databases. Cloud solutions are gaining prominence for their scalability and cost-effectiveness. The BFSI sector leads in adopting graph analytics, followed by IT & Telecom and healthcare. Growth catalysts include early tech adoption, high awareness, and the presence of major tech firms. Government initiatives fuel demand, addressing rising data complexity. Challenges include data security, a shortage of skilled professionals, and integration complexities. The market is set for substantial growth driven by increasing demand for real-time insights and advancing graph analytics technologies. These all factors are expected to contribute to regional revenue generation, thereby driving the Graph Analytics market growth. Graph Analytics Market Canada region is expected to experience steady growth, attributed to its innovation hubs and a strong emphasis on artificial intelligence (AI) and fintech. Canada's graph analytics market is categorized by component (platform, services), deployment (cloud, on-premise), end-user (BFSI, retail, IT & Telecom, healthcare, manufacturing, others), and technology (graph databases, graph algorithms). Cloud solutions are gaining popularity in Canada due to their scalability, flexibility, and cost-effectiveness. Leading adopters include the BFSI IT and telecom sectors, followed by healthcare and others. The growth drivers, mirroring the US, include early tech adoption, awareness, established tech companies, and government initiatives. Canada's prominence on innovation, rising demand for data-driven decisions, and specific needs contribute to graph analytics adoption. Challenges include data security, skilled workforce shortage, and integration issues, with Canadian-specific challenges such as market size and funding. The opportunities lie in collaboration, leveraging AI strengths, and increasing government support, positioning Canada as a promising graph analytics market with significant growth potential.

Scope of Global Graph Analytics Market: Inquire before buying

Global Graph Analytics Market
Report Coverage Details
Base Year: 2022 Forecast Period: 2023-2029
Historical Data: 2017 to 2022 Market Size in 2022: US $ 77 Mn.
Forecast Period 2023 to 2029 CAGR: 35% Market Size in 2029: US $ 637 Mn.
Segments Covered: by Component Solutions Services
by Deployment Type On Premises Cloud Based
by Application Customer Analytics Risk & Compliance Management Recommendation Engines Route Optimization Fraud Detection Others
by Vertical IT & Telecom BFSI Ecommerce & Retail Transportation & Logistics Manufacturing Healthcare & Life Sciences Others

Graph Analytics Market, by Region

North America (United States, Canada and Mexico) Europe (UK, France, Germany, Italy, Spain, Sweden, Austria and Rest of Europe) Asia Pacific (China, South Korea, Japan, India, Australia, Indonesia, Malaysia, Vietnam, Taiwan, Bangladesh, Pakistan and Rest of APAC) Middle East and Africa (South Africa, GCC, Egypt, Nigeria and Rest of ME&A) South America (Brazil, Argentina Rest of South America)

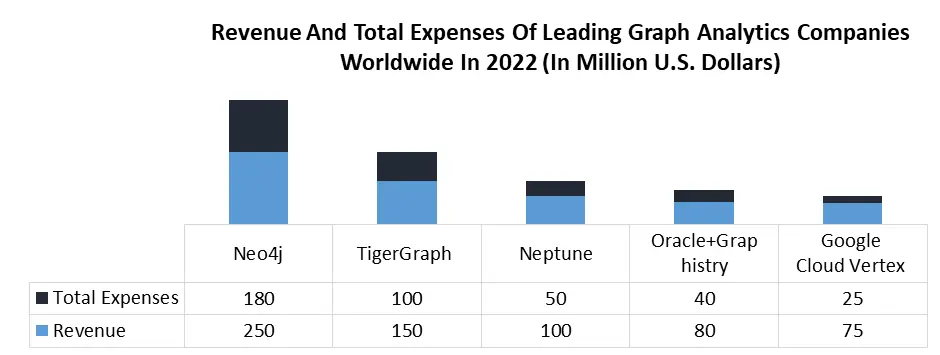
Graph Analytics Market, Key Players are

1. IBM (U.S.) 2. Microsoft (U.S.) 3. Amazon Web Services, Inc. (U.S.) 4. Oracle (U.S.) 5. Neo4j 6. TigerGraph Inc. 7. TigerGraph (U.S.) 8. Cray Inc. (U.S.) 9. DataStax (U.S.) 10. TIBCO Software 11. TIBCO Software Inc (U.S.) 12. Linkurious SAS (France) 13. Graphistry (U.S.) 14. Lynx Analytics Pte. Ltd. (Singapore) 15. Objectivity Inc. (U.S.) 16. Microsoft Corporation(U.S) 17. IBM Corporation Inc. (U.S.) 18. Oracle Inc. (U.S.) 19. Lynx Analytics Inc. 20. Cambridge Intelligence FAQs: 1. What are the growth drivers for the Graph Analytics market? Ans. Increasing Demand for Real-time Insights etc. is expected to be the major driver for the Graph Analytics market. 2. What is the major restraint on the Graph Analytics market growth? Ans. Talent Gap and Skilled Workforce Shortage are expected to be the major restraining factors for the Graph Analytics market growth. 3. Which region is expected to lead the global Graph Analytics market during the forecast period? Ans. North America is expected to lead the global Graph Analytics market during the forecast period. 4. What is the projected market size & and growth rate of the Graph Analytics Market? Ans. The Graph Analytics Market size was valued at USD 77 Million in 2022 and the total Graph Analytics revenue is expected to grow at a CAGR of 35% from 2024 to 2030, reaching nearly USD 637 Million. 5. What segments are covered in the Graph Analytics Market report? Ans. The segments covered in the Graph Analytics market report are Component, Deployment Type, Application, Vertical, and Region.
1. Graph Analytics Market: Research Methodology 2. Graph Analytics Market Introduction 2.1. Study Assumption and Market Definition 2.2. Scope of the Study 2.3. Executive Summary 3. Graph Analytics Market: Dynamics 3.1. Graph Analytics Market Trends by Region 3.1.1. North America Graph Analytics Market Trends 3.1.2. Europe Graph Analytics Market Trends 3.1.3. Asia Pacific Graph Analytics Market Trends 3.1.4. Middle East and Africa Graph Analytics Market Trends 3.1.5. South America Graph Analytics Market Trends 3.2. Graph Analytics Market Dynamics by Region 3.2.1. North America 3.2.1.1. North America Graph Analytics Market Drivers 3.2.1.2. North America Graph Analytics Market Restraints 3.2.1.3. North America Graph Analytics Market Opportunities 3.2.1.4. North America Graph Analytics Market Challenges 3.2.2. Europe 3.2.2.1. Europe Graph Analytics Market Drivers 3.2.2.2. Europe Graph Analytics Market Restraints 3.2.2.3. Europe Graph Analytics Market Opportunities 3.2.2.4. Europe Graph Analytics Market Challenges 3.2.3. Asia Pacific 3.2.3.1. Asia Pacific Graph Analytics Market Drivers 3.2.3.2. Asia Pacific Graph Analytics Market Restraints 3.2.3.3. Asia Pacific Graph Analytics Market Opportunities 3.2.3.4. Asia Pacific Graph Analytics Market Challenges 3.2.4. Middle East and Africa 3.2.4.1. Middle East and Africa Graph Analytics Market Drivers 3.2.4.2. Middle East and Africa Graph Analytics Market Restraints 3.2.4.3. Middle East and Africa Graph Analytics Market Opportunities 3.2.4.4. Middle East and Africa Graph Analytics Market Challenges 3.2.5. South America 3.2.5.1. South America Graph Analytics Market Drivers 3.2.5.2. South America Graph Analytics Market Restraints 3.2.5.3. South America Graph Analytics Market Opportunities 3.2.5.4. South America Graph Analytics Market Challenges 3.3. PORTER’s Five Forces Analysis 3.4. PESTLE Analysis 3.5. Technological Roadmap 3.6. Deployment Type Roadmap 3.7. Regulatory Landscape by Region 3.7.1. Global 3.7.2. North America 3.7.3. Europe 3.7.4. Asia Pacific 3.7.5. Middle East and Africa 3.7.6. South America 3.8. Key Opinion Leader Analysis for the Graph Analytics Industry 3.9. Analysis of Government Schemes and Initiatives for the Graph Analytics Industry 3.10. The Global Pandemic's Impact on Graph Analytics Market 4. Graph Analytics Market: Global Market Size and Forecast by Segmentation by Demand and Supply Side (by Value in USD Million) (2023-2030) 4.1. Graph Analytics Market Size and Forecast, by Component (2023-2030) 4.1.1. Solutions 4.1.2. Services 4.2. Graph Analytics Market Size and Forecast, by Deployment Type (2023-2030) 4.2.1. On-premises 4.2.2. Cloud 4.3. Graph Analytics Market Size and Forecast, by Application (2023-2030) 4.3.1. Customer Analytics 4.3.2. Risk & Compliance Management 4.3.3. Recommendation Engines 4.3.4. Route Optimization 4.3.5. Fraud Detection 4.3.6. Others 4.4. Graph Analytics Market Size and Forecast, by Vertical (2023-2030) 4.4.1. IT & Telecom 4.4.2. BFSI 4.4.3. Ecommerce & Retail 4.4.4. Transportation & Logistics 4.4.5. Manufacturing 4.4.6. Healthcare & Life Sciences 4.4.7. Others 4.5. Graph Analytics Market Size and Forecast, by Region (2023-2030) 4.5.1. North America 4.5.2. Europe 4.5.3. Asia Pacific 4.5.4. Middle East and Africa 4.5.5. South America 5. North America Graph Analytics Market Size and Forecast by Segmentation by Demand and Supply Side (by Value in USD Million) (2023-2030) 5.1. North America Graph Analytics Market Size and Forecast, by Component (2023-2030) 5.1.1. Solutions 5.1.2. Services 5.2. North America Graph Analytics Market Size and Forecast, by Deployment Type (2023-2030) 5.2.1. On-premises 5.2.2. Cloud 5.3. North America Graph Analytics Market Size and Forecast, by Application (2023-2030) 5.3.1. Customer Analytics 5.3.2. Risk & Compliance Management 5.3.3. Recommendation Engines 5.3.4. Route Optimization 5.3.5. Fraud Detection 5.3.6. Others 5.4. North America Graph Analytics Market Size and Forecast, by Vertical (2023-2030) 5.4.1. IT & Telecom 5.4.2. BFSI 5.4.3. Ecommerce & Retail 5.4.4. Transportation & Logistics 5.4.5. Manufacturing 5.4.6. Healthcare & Life Sciences 5.4.7. Others 5.5. North America Graph Analytics Market Size and Forecast, by Country (2023-2030) 5.5.1. United States 5.5.1.1. United States Graph Analytics Market Size and Forecast, by Component (2023-2030) 5.5.1.1.1. Solutions 5.5.1.1.2. Services 5.5.1.2. United States Graph Analytics Market Size and Forecast, by Deployment Type (2023-2030) 5.5.1.2.1. On-premises 5.5.1.2.2. Cloud 5.5.1.3. United States Graph Analytics Market Size and Forecast, by Application (2023-2030) 5.5.1.3.1. Customer Analytics 5.5.1.3.2. Risk & Compliance Management 5.5.1.3.3. Recommendation Engines 5.5.1.3.4. Route Optimization 5.5.1.3.5. Fraud Detection 5.5.1.3.6. Others 5.5.1.4. United States Graph Analytics Market Size and Forecast, by Vertical (2023-2030) 5.5.1.4.1. IT & Telecom 5.5.1.4.2. BFSI 5.5.1.4.3. E-commercece & Retail 5.5.1.4.4. Transportation & Logistics 5.5.1.4.5. Manufacturing 5.5.1.4.6. Healthcare & Life Sciences 5.5.1.4.7. Others 5.5.2. Canada 5.5.2.1. Canada Graph Analytics Market Size and Forecast, by Component (2023-2030) 5.5.2.1.1. Solutions 5.5.2.1.2. Services 5.5.2.2. Canada Graph Analytics Market Size and Forecast, by Deployment Type (2023-2030) 5.5.2.2.1. On-premises 5.5.2.2.2. Cloud 5.5.2.3. Canada Graph Analytics Market Size and Forecast, by Application (2023-2030) 5.5.2.3.1. Customer Analytics 5.5.2.3.2. Risk & Compliance Management 5.5.2.3.3. Recommendation Engines 5.5.2.3.4. Route Optimization 5.5.2.3.5. Fraud Detection 5.5.2.3.6. Others 5.5.2.4. Canada Graph Analytics Market Size and Forecast, by Application (2023-2030) 5.5.2.4.1. IT & Telecom 5.5.2.4.2. BFSI 5.5.2.4.3. E-commercece & Retail 5.5.2.4.4. Transportation & Logistics 5.5.2.4.5. Manufacturing 5.5.2.4.6. Healthcare & Life Sciences 5.5.2.4.7. Others 5.5.3. Mexico 5.5.3.1. Mexico Graph Analytics Market Size and Forecast, by Component (2023-2030) 5.5.3.1.1. Solutions 5.5.3.1.2. Services 5.5.3.2. Mexico Graph Analytics Market Size and Forecast, by Deployment Type (2023-2030) 5.5.3.2.1. On-premises 5.5.3.2.2. Cloud 5.5.3.3. Mexico Graph Analytics Market Size and Forecast, by Application (2023-2030) 5.5.3.3.1. Customer Analytics 5.5.3.3.2. Risk & Compliance Management 5.5.3.3.3. Recommendation Engines 5.5.3.3.4. Route Optimization 5.5.3.3.5. Fraud Detection 5.5.3.3.6. Others 5.5.3.4. Mexico Graph Analytics Market Size and Forecast, by Vertical (2023-2030) 5.5.3.4.1. IT & Telecom 5.5.3.4.2. BFSI 5.5.3.4.3. E-commercece & Retail 5.5.3.4.4. Transportation & Logistics 5.5.3.4.5. Manufacturing 5.5.3.4.6. Healthcare & Life Sciences 5.5.3.4.7. Others 6. Europe Graph Analytics Market Size and Forecast by Segmentation by Demand and Supply Side (by Value in USD Million) (2023-2030) 6.1. Europe Graph Analytics Market Size and Forecast, by Component (2023-2030) 6.2. Europe Graph Analytics Market Size and Forecast, by Deployment Type (2023-2030) 6.3. Europe Graph Analytics Market Size and Forecast, by Application (2023-2030) 6.4. Europe Graph Analytics Market Size and Forecast, by Vertical (2023-2030) 6.5. Europe Graph Analytics Market Size and Forecast, by Country (2023-2030) 6.5.1. United Kingdom 6.5.1.1. United Kingdom Graph Analytics Market Size and Forecast, by Component (2023-2030) 6.5.1.2. United Kingdom Graph Analytics Market Size and Forecast, by Deployment Type (2023-2030) 6.5.1.3. United Kingdom Graph Analytics Market Size and Forecast, by Application (2023-2030) 6.5.1.4. United Kingdom Graph Analytics Market Size and Forecast, by Vertical (2023-2030) 6.5.2. France 6.5.2.1. France Graph Analytics Market Size and Forecast, by Component (2022-2030) 6.5.2.2. France Graph Analytics Market Size and Forecast, by Deployment Type (2023-2030) 6.5.2.3. France Graph Analytics Market Size and Forecast, by Application (2023-2030) 6.5.2.4. France Graph Analytics Market Size and Forecast, by Vertical (2023-2030) 6.5.3. Germany 6.5.3.1. Germany Graph Analytics Market Size and Forecast, by Component (2023-2030) 6.5.3.2. Germany Graph Analytics Market Size and Forecast, by Deployment Type (2023-2030) 6.5.3.3. Germany Graph Analytics Market Size and Forecast, by Application (2023-2030) 6.5.3.4. Germany Graph Analytics Market Size and Forecast, by Vertical (2023-2030) 6.5.4. Italy 6.5.4.1. Italy Graph Analytics Market Size and Forecast, by Component (2023-2030) 6.5.4.2. Italy Graph Analytics Market Size and Forecast, by Deployment Type (2023-2030) 6.5.4.3. Italy Graph Analytics Market Size and Forecast, by Application (2023-2030) 6.5.4.4. Italy Graph Analytics Market Size and Forecast, by Vertical (2023-2030) 6.5.5. Spain 6.5.5.1. Spain Graph Analytics Market Size and Forecast, by Component (2023-2030) 6.5.5.2. Spain Graph Analytics Market Size and Forecast, by Deployment Type (2023-2030) 6.5.5.3. Spain Graph Analytics Market Size and Forecast, by Application (2023-2030) 6.5.5.4. Spain Graph Analytics Market Size and Forecast, by Vertical (2023-2030) 6.5.6. Sweden 6.5.6.1. Sweden Graph Analytics Market Size and Forecast, by Component (2023-2030) 6.5.6.2. Sweden Graph Analytics Market Size and Forecast, by Deployment Type (2023-2030) 6.5.6.3. Sweden Graph Analytics Market Size and Forecast, by Application (2023-2030) 6.5.6.4. Sweden Graph Analytics Market Size and Forecast, by Vertical (2023-2030) 6.5.7. Austria 6.5.7.1. Austria Graph Analytics Market Size and Forecast, by Component (2023-2030) 6.5.7.2. Austria Graph Analytics Market Size and Forecast, by Deployment Type (2023-2030) 6.5.7.3. Austria Graph Analytics Market Size and Forecast, by Application (2023-2030) 6.5.7.4. Austria Graph Analytics Market Size and Forecast, by Vertical (2023-2030) 6.5.8. Rest of Europe 6.5.8.1. Rest of Europe Graph Analytics Market Size and Forecast, by Component (2023-2030) 6.5.8.2. Rest of Europe Graph Analytics Market Size and Forecast, by Deployment Type (2023-2030) 6.5.8.3. Rest of Europe Graph Analytics Market Size and Forecast, by Application (2023-2030) 6.5.8.4. Rest of Europe Graph Analytics Market Size and Forecast, by Vertical (2023-2030) 7. Asia Pacific Graph Analytics Market Size and Forecast by Segmentation by Demand and Supply Side (by Value in USD Million) (2023-2030) 7.1. Asia Pacific Graph Analytics Market Size and Forecast, by Component (2023-2030) 7.2. Asia Pacific Graph Analytics Market Size and Forecast, by Deployment Type (2023-2030) 7.3. Asia Pacific Graph Analytics Market Size and Forecast, by Application (2023-2030) 7.4. Asia Pacific Graph Analytics Market Size and Forecast, by Vertical (2023-2030) 7.5. Asia Pacific Graph Analytics Market Size and Forecast, by Country (2023-2030) 7.5.1. China 7.5.1.1. China Graph Analytics Market Size and Forecast, by Component (2023-2030) 7.5.1.2. China Graph Analytics Market Size and Forecast, by Deployment Type (2023-2030) 7.5.1.3. China Graph Analytics Market Size and Forecast, by Application (2023-2030) 7.5.1.4. China Graph Analytics Market Size and Forecast, by Vertical (2023-2030) 7.5.2. S Korea 7.5.2.1. S Korea Graph Analytics Market Size and Forecast, by Component (2023-2030) 7.5.2.2. S Korea Graph Analytics Market Size and Forecast, by Deployment Type (2023-2030) 7.5.2.3. S Korea Graph Analytics Market Size and Forecast, by Application (2023-2030) 7.5.2.4. S Korea Graph Analytics Market Size and Forecast, by Vertical (2023-2030) 7.5.3. Japan 7.5.3.1. Japan Graph Analytics Market Size and Forecast, by Component (2023-2030) 7.5.3.2. Japan Graph Analytics Market Size and Forecast, by Deployment Type (2023-2030) 7.5.3.3. Japan Graph Analytics Market Size and Forecast, by Application (2023-2030) 7.5.3.4. Japan Graph Analytics Market Size and Forecast, by Vertical (2023-2030) 7.5.4. India 7.5.4.1. India Graph Analytics Market Size and Forecast, by Component (2023-2030) 7.5.4.2. India Graph Analytics Market Size and Forecast, by Deployment Type (2023-2030) 7.5.4.3. India Graph Analytics Market Size and Forecast, by Application (2023-2030) 7.5.4.4. India Graph Analytics Market Size and Forecast, by Vertical (2023-2030) 7.5.5. Australia 7.5.5.1. Australia Graph Analytics Market Size and Forecast, by Component (2023-2030) 7.5.5.2. Australia Graph Analytics Market Size and Forecast, by Deployment Type (2023-2030) 7.5.5.3. Australia Graph Analytics Market Size and Forecast, by Application (2023-2030) 7.5.5.4. Australia Graph Analytics Market Size and Forecast, by Vertical (2023-2030) 7.5.6. Indonesia 7.5.6.1. Indonesia Graph Analytics Market Size and Forecast, by Component (2023-2030) 7.5.6.2. Indonesia Graph Analytics Market Size and Forecast, by Deployment Type (2023-2030) 7.5.6.3. Indonesia Graph Analytics Market Size and Forecast, by Application (2023-2030) 7.5.6.4. Indonesia Graph Analytics Market Size and Forecast, by Vertical (2023-2030) 7.5.7. Malaysia 7.5.7.1. Malaysia Graph Analytics Market Size and Forecast, by Component (2023-2030) 7.5.7.2. Malaysia Graph Analytics Market Size and Forecast, by Deployment Type (2023-2030) 7.5.7.3. Malaysia Graph Analytics Market Size and Forecast, by Application (2023-2030) 7.5.7.4. Malaysia Graph Analytics Market Size and Forecast, by Vertical (2023-2030) 7.5.8. Vietnam 7.5.8.1. Vietnam Graph Analytics Market Size and Forecast, by Component (2023-2030) 7.5.8.2. Vietnam Graph Analytics Market Size and Forecast, by Deployment Type (2023-2030) 7.5.8.3. Vietnam Graph Analytics Market Size and Forecast, by Application (2023-2030) 7.5.8.4. Vietnam Graph Analytics Market Size and Forecast, by Vertical (2023-2030) 7.5.9. Taiwan 7.5.9.1. Taiwan Graph Analytics Market Size and Forecast, by Component (2023-2030) 7.5.9.2. Taiwan Graph Analytics Market Size and Forecast, by Deployment Type (2023-2030) 7.5.9.3. Taiwan Graph Analytics Market Size and Forecast, by Application (2023-2030) 7.5.9.4. Taiwan Graph Analytics Market Size and Forecast, by Vertical (2023-2030) 7.5.10. Rest of Asia Pacific 7.5.10.1. Rest of Asia Pacific Graph Analytics Market Size and Forecast, by Component (2023-2030) 7.5.10.2. Rest of Asia Pacific Graph Analytics Market Size and Forecast, by Deployment Type (2023-2030) 7.5.10.3. Rest of Asia Pacific Graph Analytics Market Size and Forecast, by Application (2023-2030) 7.5.10.4. Rest of Asia Pacific Graph Analytics Market Size and Forecast, by Vertical (2023-2030) 8. Middle East and Africa Graph Analytics Market Size and Forecast by Segmentation by Demand and Supply Side (by Value in USD Million) (2023-2030 8.1. Middle East and Africa Graph Analytics Market Size and Forecast, by Component (2023-2030) 8.2. Middle East and Africa Graph Analytics Market Size and Forecast, by Deployment Type (2023-2030) 8.3. Middle East and Africa Graph Analytics Market Size and Forecast, by Application (2023-2030) 8.4. Middle East and Africa Graph Analytics Market Size and Forecast, by Vertical (2023-2030) 8.5. Middle East and Africa Graph Analytics Market Size and Forecast, by Country (2023-2030) 8.5.1. South Africa 8.5.1.1. South Africa Graph Analytics Market Size and Forecast, by Component (2023-2030) 8.5.1.2. South Africa Graph Analytics Market Size and Forecast, by Deployment Type (2023-2030) 8.5.1.3. South Africa Graph Analytics Market Size and Forecast, by Application (2023-2030) 8.5.1.4. South Africa Graph Analytics Market Size and Forecast, by Vertical (2023-2030) 8.5.2. GCC 8.5.2.1. GCC Graph Analytics Market Size and Forecast, by Component (2023-2030) 8.5.2.2. GCC Graph Analytics Market Size and Forecast, by Deployment Type (2023-2030) 8.5.2.3. GCC Graph Analytics Market Size and Forecast, by Application (2023-2030) 8.5.2.4. GCC Graph Analytics Market Size and Forecast, by Vertical (2023-2030) 8.5.3. Nigeria 8.5.3.1. Nigeria Graph Analytics Market Size and Forecast, by Component (2023-2030) 8.5.3.2. Nigeria Graph Analytics Market Size and Forecast, by Deployment Type (2023-2030) 8.5.3.3. Nigeria Graph Analytics Market Size and Forecast, by Application (2023-2030) 8.5.3.4. Nigeria Graph Analytics Market Size and Forecast, by Vertical (2023-2030) 8.5.4. Rest of ME&A 8.5.4.1. Rest of ME&A Graph Analytics Market Size and Forecast, by Component (2023-2030) 8.5.4.2. Rest of ME&A Graph Analytics Market Size and Forecast, by Deployment Type (2023-2030) 8.5.4.3. Rest of ME&A Graph Analytics Market Size and Forecast, by Application (2023-2030) 8.5.4.4. Rest of ME&A Graph Analytics Market Size and Forecast, by Vertical (2023-2030) 9. South America Graph Analytics Market Size and Forecast by Segmentation by Demand and Supply Side (by Value in USD Million) (2023-2030 9.1. South America Graph Analytics Market Size and Forecast, by Component (2023-2030) 9.2. South America Graph Analytics Market Size and Forecast, by Deployment Type (2023-2030) 9.3. South America Graph Analytics Market Size and Forecast, by Application (2023-2030) 9.4. South America Graph Analytics Market Size and Forecast, by Vertical (2023-2030) 9.5. South America Graph Analytics Market Size and Forecast, by Country (2023-2030) 9.5.1. Brazil 9.5.1.1. Brazil Graph Analytics Market Size and Forecast, by Component (2023-2030) 9.5.1.2. Brazil Graph Analytics Market Size and Forecast, by Deployment Type (2023-2030) 9.5.1.3. Brazil Graph Analytics Market Size and Forecast, by Application (2023-2030) 9.5.1.4. Brazil Graph Analytics Market Size and Forecast, by Vertical (2023-2030) 9.5.2. Argentina 9.5.2.1. Argentina Graph Analytics Market Size and Forecast, by Component (2023-2030) 9.5.2.2. Argentina Graph Analytics Market Size and Forecast, by Deployment Type (2023-2030) 9.5.2.3. Argentina Graph Analytics Market Size and Forecast, by Application (2023-2030) 9.5.2.4. Brazil Graph Analytics Market Size and Forecast, by Vertical (2023-2030) 9.5.3. Rest Of South America 9.5.3.1. Rest Of South America Graph Analytics Market Size and Forecast, by Component (2023-2030) 9.5.3.2. Rest Of South America Graph Analytics Market Size and Forecast, by Deployment Type (2023-2030) 9.5.3.3. Rest Of South America Graph Analytics Market Size and Forecast, by Application (2023-2030) 9.5.3.4. Brazil Graph Analytics Market Size and Forecast, by Vertical (2023-2030) 10. Global Graph Analytics Market: Competitive Landscape 10.1. MMR Competition Matrix 10.2. Competitive Landscape 10.3. Key Players Benchmarking 10.3.1. Company Name 10.3.2. Service Segment 10.3.3. End-user Segment 10.3.4. Revenue (2023) 10.3.5. Company Locations 10.4. Leading Graph Analytics Market Companies, by market capitalization 10.5. Market Structure 10.5.1. Market Leaders 10.5.2. Market Followers 10.5.3. Emerging Players 10.6. Mergers and Acquisitions Details 11. Company Profile: Key Players 11.1. Microsoft Corporation 11.1.1. Company Overview 11.1.2. Business Portfolio 11.1.3. Financial Overview 11.1.4. SWOT Analysis 11.1.5. Strategic Analysis 11.1.6. Scale of Operation (small, medium, and large) 11.1.7. Details on Partnership 11.1.8. Regulatory Accreditations and Certifications Received by Them 11.1.9. Awards Received by the Firm 11.1.10. Recent Developments 11.2. IBM Corporation 11.3. Amazon Web Services 11.4. Oracle 11.5. Neo4j 11.6. TigerGraph 11.7. DataStax 11.8. TIBCO Software 11.9. Lynx Analytics 11.10. Cambridge Intelligence 11.11. Kineviz 11.12. Franz 11.13. Expero 11.14. Dataiku 11.15. Tom Sawyer Software 11.16. Teradata 11.17. Linkurious 11.18. Graphite 11.19. Objectivity 12. Key Findings 13. Industry Recommendations 14. Terms and Glossary
  • INQUIRE BEFORE BUYING