Gas Insulated Switchgear Market - Industry Structure Evaluation, Demand Drivers Analysis, Regional Growth Analysis and Identification, Competitive Positioning Review & Global Market Size Forecast to 2034

7.2%
CAGR (2026-2034)
34.34 USD Bn.
Forecast Market Size
321
Report Pages
137
Market Tables

Overview

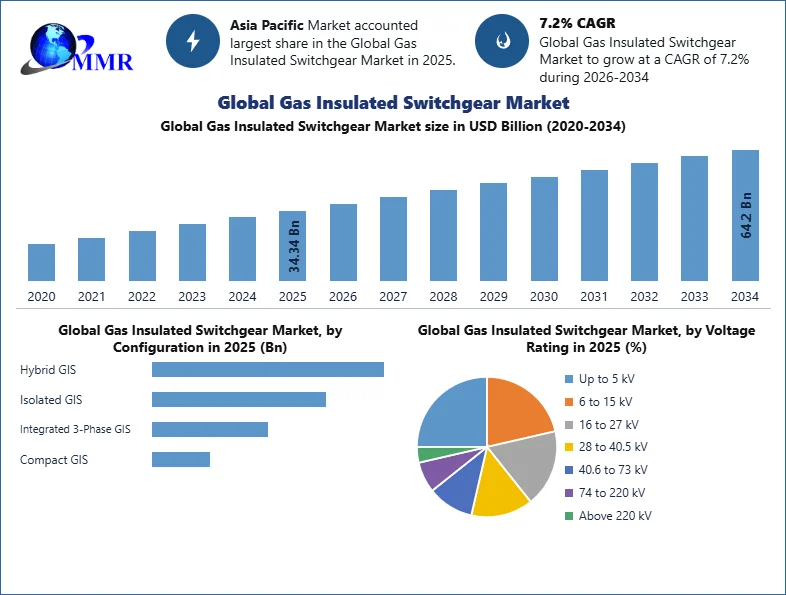
The Gas Insulated Switchgear Market size was valued at USD 34.34 billion in 2025, and the total Gas Insulated Switchgear revenue is expected to grow at a CAGR of 7.2% from 2025 to 2032, reaching nearly USD 64.2 billion by 2034.

Gas Insulated Switchgear Market Definition

A switchgear consists of a variety of electrical circuit breakers, fuses, and switches and is basically used to protect, isolate, and control various electrical equipment in an electric power industry. Gas insulated switchgear (GIS) is a metal switchgear that consists of high-voltage devices such as disconnectors and circuit-breakers to safely function in constricted spaces.


To know about the Research Methodology :- Request Free Sample Report

Gas Insulated Switchgear Market Dynamics

The gas insulated switchgear market is one of the fastest growing sectors, helping extensively in the growth of global power sector. In the forecasted period, the gas insulated switchgear industry is expected to show immense growth. The increasing demand for power and electricity in the emerging industries and the considerable electrification thrust in the rural areas is poised to maintain the gas insulated switchgear industry during the forecast period. A rising government initiatives and investments to reduce carbon emissions and to drive renewable energy projects, growing improvements in smart infrastructure and surge in the adoption of HVDC technology are expected to improve the growth of the market in the coming years.

However, rising competition from disjointed or unorganized switchgear markets, negative impacts of COVID-19 pandemic and thus postponement of grid development projects are major restraining factors that could hamper the growth of the market.

Gas Insulated Switchgear Market Segment Analysis

By insulation type, the SF₆ gas-insulated switchgear segment dominated the market in 2025 and is expected to maintain its dominance at a CAGR of xx% during the forecast period. SF₆ stands for sulphur hexafluoride, a non-toxic, inert, colourless, tasteless, non-flammable, and odourless gas consisting of one sulphur atom surrounded by six fluorine atoms. The dominance of the segment is attributed to the wide adoption of SF₆ as an insulation and arc-quenching medium in GIS for phase-to-ground and phase-to-phase insulation. Its high dielectric strength, operational reliability, compact equipment design, and suitability for high-voltage substations have made it the preferred insulation medium across transmission and distribution networks. However, the market is gradually witnessing a shift toward SF₆-free and low-GWP insulation technologies due to tightening environmental regulations and sustainability targets.

By installation type, the indoor GIS segment dominated the market in 2025 and is expected to maintain its dominance at a CAGR of xx% during the forecast period. Indoor GIS is preferred in urban substations, commercial infrastructure, data centers, metro rail networks, industrial facilities, and areas where land availability is limited. The segment growth is driven by the compact footprint, enhanced safety, lower exposure to harsh environmental conditions, and reduced maintenance requirements of indoor GIS systems. Rising demand for reliable power infrastructure in dense cities and critical facilities is further strengthening the adoption of indoor GIS installations.

 

By voltage rating, the 74 kV to 220 kV segment dominated the Gas Insulated Switchgear Market in 2025, holding nearly 23% of the market share. The dominance of this segment is attributed to its wide application in transmission substations, grid interconnection projects, renewable power evacuation systems, and utility network strengthening. GIS systems in this voltage range provide high reliability, compact installation, and efficient power control for medium- to high-voltage applications. The 28 kV to 40.5 kV and 16 kV to 27 kV segments also held significant shares due to their usage in industrial power systems, distribution substations, commercial infrastructure, and renewable-energy projects. Additionally, the above 220 kV segment is expected to gain traction with increasing investments in extra-high-voltage transmission networks and long-distance power evacuation projects.

By configuration, the integrated 3-phase GIS segment dominated the market in 2025, accounting for nearly 38% of the market share. The segment’s dominance is driven by its compact structure, reduced space requirement, simplified installation, improved reliability, and suitability for high-density substations. Integrated 3-phase GIS is widely used in urban transmission and distribution networks, industrial substations, and utility applications where space optimization and operational efficiency are critical. The compact GIS segment is expected to witness strong growth during the forecast period due to rising demand from data centers, commercial infrastructure, metro rail projects, and renewable-energy substations. Hybrid GIS is also gaining adoption as utilities modernize existing substations while balancing cost, space, and performance requirements.

By end user, the power utilities segment dominated the Gas Insulated Switchgear Market in 2025 with around 48% market share and is expected to remain the leading end-user segment during the forecast period. Power utilities are the major consumers of GIS due to continuous investments in transmission and distribution expansion, grid modernization, substation upgrades, and renewable-energy integration. The increasing need for reliable electricity supply, reduction of transmission losses, and replacement of aging grid infrastructure is driving GIS adoption among utilities. The industrial segment also holds a significant share, supported by demand from oil & gas, mining, steel & metal, and chemical & petrochemical industries. Meanwhile, the renewable energy sector is expected to grow rapidly due to rising solar PV substations, wind farms, and battery energy storage system projects requiring compact and reliable switchgear solutions.

Regional Insights

Region-wise, Asia pacific held the largest market share in 2025 and is expected to maintain its dominance at CAGR of xx% during the forecast period. The economies such as China, Japan, South Korea, and India are the major key contributors behind the growth of the market. The growth is attributed to the increasing demand of electricity and power in developing economies. China is an extremely engaging market for gas insulation switchgears and its components.

Growing number of gas insulation substations, rising power necessity, need for developments in aged electrical infrastructure, rising government investments in hydroelectric power projects and increasing applications of gas insulation switchgears in city buildings, on offshore platforms, on roofs, hydropower plants and industrial plants are driving the growth of the market in the APAC region. In addition, surge in the adoption of GIS up to 36 kV voltage rating, in Indian railway system is propelling the growth of the market.

The objective of the report is to present a comprehensive analysis of the Global Gas Insulated Switchgear Market including all the stakeholders of the industry. The past and current status of the industry with forecasted market size and trends are presented in the report with the analysis of complicated data in simple language.

The report covers all the aspects of the industry with a dedicated study of key players that includes market leaders, followers and new entrants. PORTER, SVOR, PESTEL analysis with the potential impact of micro-economic factors of the market have been presented in the report. External as well as internal factors that are supposed to affect the business positively or negatively have been analyzed, which will give a clear futuristic view of the industry to the decision-makers.

The report also helps in understanding Global Gas Insulated Switchgear Market dynamics, structure by analyzing the market segments and projects the Global Gas Insulated Switchgear Market. Clear representation of competitive analysis of key players by Application, price, financial position, Product portfolio, growth strategies, and regional presence in the Global Gas Insulated Switchgear Market make the report investor’s guide.

Recent Development

In February 2025, GE Vernova announced that it was selected by Sterlite Grid 32 Limited to supply 765 kV gas-insulated switchgear (GIS), 765 kV power transformers, and shunt reactors for the Khavda Phase-IV Part C renewable transmission project in India. This is authentic and core GIS news because the company page clearly states that GE Vernova will provide 765 kV GIS along with installation, testing, and commissioning support. The impact is strong demand for extra-high-voltage GIS in renewable-energy transmission and grid strengthening projects.

In February 2025, GE Vernova announced its intent to invest in expanding the GESAT facility in Dammam, Saudi Arabia, to enable local production of high-voltage gas-insulated switchgears. This is authentic and directly relevant as an investment news item because the company website specifically mentions local production of high-voltage GIS. The impact is improved regional GIS manufacturing capacity, shorter delivery timelines, and stronger localization for Middle East grid modernization projects.

In May 2025, Hitachi Energy announced that it would deliver the world’s first SF₆-free 550 kV gas-insulated switchgear to the Central China Branch of State Grid Corporation of China. This is authentic and highly core to the GIS market because the company source directly confirms SF₆-free 550 kV GIS and positions it as a pilot application for high-voltage substations. The impact is acceleration of the shift from conventional SF₆-based GIS toward eco-efficient GIS technologies.

In May 2025, GE Vernova announced the deployment of two SF₆-free 420 kV gas-insulated substations (GIS) in Norway for Statnett and Equinor, using its g³ technology. This is authentic and core because the company release clearly states two high-voltage 420 kV SF₆-free GIS substations. The impact is rising adoption of low-emission GIS in transmission networks and industrial electrification projects.

In May 2025, Siemens Energy announced that it was developing an F-gas-free 420 kV gas-insulated switchgear with Elia for a pilot installation at the Vilvoorde substation in Belgium. This is authentic and core because Siemens Energy’s own press release specifically mentions 420 kV GIS and clean-air insulation. The impact is technology validation for SF₆-free GIS at transmission voltage level in Europe.

In March 2026, Hitachi announced that it received an order from Chubu Electric Power Grid for Hitachi Energy’s EconiQ 550 kV SF₆-free gas-insulated switchgear. This is authentic and core because the company source directly states that it is a 550 kV GIS project in which the entire equipment is SF₆-free. The impact is commercial-scale adoption of SF₆-free GIS in Japan’s backbone transmission network.

In April 2026, Lucy Group announced that it completed the acquisition of 100% of Nuventura GmbH, a German company focused on primary SF₆-free switchgear. This is authentic M&A news and core to the GIS market because Lucy Group’s company website says Nuventura launched the world’s first 36 kV dry-air gas-insulated switchgear and developed a 24 kV version for medium-voltage applications. The impact is consolidation in the SF₆-free GIS segment and stronger commercialization of medium-voltage dry-air GIS technology.

In May 2026, GE Vernova announced that it is expected to supply a 420 kV SF₆-free g³ gas-insulated switchgear system for Campus AI’s large AI campus in France. This is authentic and core, but phrase it carefully as “expected to supply” because that is how GE Vernova states it. The impact is growing GIS demand from large data center and AI infrastructure projects, not only utilities.

Gas Insulated Switchgear Industry Ecosystem

Gas Insulated Switchgear Market

Gas Insulated Switchgear Market Scope: Inquire before buying

Gas Insulated Switchgear Market
Report Coverage Details
Base Year: 2025 Forecast Period: 2026-2034
Historical Data: 2020 to 2025 Market Size in 2025: USD 34.34 Bn.
Forecast Period 2026 to 2034 CAGR: 7.2 % Market Size in 2032: USD 64.2 Bn.
Segments Covered: by Insulation Type SF6
SF6-Free
by Installation Indoor
Outdoor
by Voltage Rating Up to 5 kV
6 to 15 kV
16 to 27 kV
28 to 40.5 kV
40.6 to 73 kV
74 to 220 kV
Above 220 kV
by End-User Power Utilities
Industrial
Commercial Infrastructure
Renewable Energy Sector
Onshore
Offshore
by Configuration Hybrid GIS
Isolated GIS
Integrated 3-Phase GIS
Compact GIS

Gas Insulated Switchgear Market, by Region

North America (United States, Canada and Mexico)
Europe (UK, France, Germany, Italy, Spain, Sweden, Austria and Rest of Europe)
Asia Pacific (China, South Korea, Japan, India, Australia, Indonesia, Malaysia, Vietnam, Taiwan, Bangladesh, Pakistan and Rest of APAC)
Middle East and Africa (South Africa, GCC, Egypt, Nigeria and Rest of ME&A)
South America (Brazil, Argentina Rest of South America)

Gas Insulated Switchgear Market, Key Players

  1. Siemens AG
  2. ABB ltd
  3. General Electric
  4. Schneider Electric
  5. Mitsubishi Electric
  6. Eaton Corporation
  7. Hitachi Ltd.
  8. Hyundai Electric
  9. Fuji Electric
  10. Toshiba Energy Systems & Solutions Corporation
  11. Hyosung Heavy Industries
  12. ELEKTROBUDOWA S.A.
  13. Yueqing Liyond Electric Co. Ltd.
  14. CG Power and Industrial Solutions Nissin Electric
  15. Meidensha Corporation
  16. Powell Industries
  17. Lucy Electric
  18. Xi’an XD Switchgear Electric Co., Ltd.
  19. Sieyuan Electric Co., Ltd.
  20. Switchgear Company
  21. Henan Pinggao Electric Co., Ltd.
  22. SEL S.p.A.
  23. ILJIN Electric
  24. Bharat Heavy Electricals Limited
  25. CHINT Group Co., Ltd.
  26. Chung-Hsin Electric and Machinery Manufacturing Corp.
  27. Xiamen Huadian Switchgear Co., Ltd
  28. Kexun Electric Co., Ltd
  29. SYHF (Jiangsu) Electric Co., Ltd.
  30. KDM Switchgear (KDM Steel)
  31. Ningbo Tianan (Group) Co., Ltd.
  32. Beijing Banner Electric Co., Ltd
  33. CNC Electric
  34. Guangdong Mingyang Electric Co., Ltd.
  35. Sunten Electric Equipment Co., Ltd.

Others

Frequently Asked Questions:

1. Which region has the largest share in Global Gas Insulated Switchgear Market?
Ans: Asia pacific region held the highest share in 2025.

2. What is the growth rate of Global Gas Insulated Switchgear Market?
Ans: The Global Gas Insulated Switchgear Market is growing at a CAGR of 7.2% during forecasting period 2026-2032.

3. What is scope of the Global Gas Insulated Switchgear market report?
Ans: Global Gas Insulated Switchgear Market report helps with the PESTEL, PORTER, Recommendations for Investors & Leaders, and market estimation of the forecast period.

4. Who are the key players in Global Gas Insulated Switchgear market?
Ans: The important key players in the Global Gas Insulated Switchgear Market are – ABB, Schneider Electric, Eaton Corporation, Hitachi, Mitsubishi Electric, Larsen &Toubro, Industrial Solutions Limited, Hyosung, Toshiba, CG Power, Tenaga Switchgear Sdn. Bhd, and Orecco.

5. What is the study period of this market?
Ans: The Global Gas Insulated Switchgear Market is studied from 2025 to 2034.

Table of Contents

1. Executive Market Landscape and Industry Overview 1.1 Global Gas Insulated Switchgear market size estimation and growth outlook (2025–2034) 1.2 Comprehensive definition of GIS market and product classification (MV, HV, UHV) 1.3 Scope boundaries covering transmission, distribution, and industrial installations 1.4 Inclusion criteria and assumptions used in market estimation 1.5 Overview of insulation technologies, including SF₆ and SF₆-free GIS systems 1.6 Industry value chain structure from component manufacturing to EPC deployment 1.7 Standard units, metrics, and reporting methodologies used globally 1.8 Business potential overview across global and China GIS markets with revenue opportunity assessment by voltage segment and end-user industry 1.9 Long-term market forecast outlook highlighting future investment pockets and high-growth application areas 1.10 Techno-commercial overview of GIS solutions including cost-performance benchmarking and commercial feasibility assessment 2. Global Gas Insulated Switchgear Market Dynamics 2.1 Gas Insulated Switchgear Market Trends 2.2 Gas Insulated Switchgear Market Drivers 2.3 Gas Insulated Switchgear Market Restraints 2.4 Gas Insulated Switchgear Market Opportunities 2.5 Gas Insulated Switchgear Market Challenges 2.6 PORTER’s Five Forces Analysis 2.6.1 Supplier Power 2.6.2 Buyer Power 2.6.3 Threat of Substitutes 2.6.4 Threat of New Entrants 2.6.5 Competitive Rivalry 2.7 PESTLE Analysis 3. Global GIS Market Size and Volume Analysis (2020–2034) 3.1 Total market size (USD Billion) by year (2020–2025) 3.2 Forecast market size (2026–2034) 3.3 Total installed units (No. of GIS systems) 3.4 Year-on-year growth (%) 3.5 Market share (%) by region 3.6 China vs global market contribution (%) 3.7 Forecast opportunity analysis by region, voltage category, and application sector (2025–2034) 3.8 Revenue potential assessment for OEMs, EPC contractors, and component suppliers 4. China GIS Market Size and Volume Analysis (2020–2034) 4.1 China GIS market size and installed base analysis 4.2 China GIS market size (USD Billion) 4.3 Installed base (No. of substations / GIS units) 4.4 Growth rate (%) (2020–2025, 2026–2034) 4.5 Share (%) of global market 4.6 UHV installed capacity (GW/substations) 4.7 Domestic vs export volume (%) 5. Supply Chain Analysis and Value Chain Mapping 5.1 Upstream raw material sourcing, including copper, aluminum, steel, and SF₆ gas 5.2 Midstream GIS component manufacturing and assembly operations 5.3 Downstream EPC contractors and utility deployment channels 5.4 Role of logistics and storage infrastructure in equipment delivery 5.5 Integration levels across global and China-based value chain participants 5.6 Bottlenecks and inefficiencies affecting supply chain performance 6. Gas Insulated Switchgear Market Ecosystem Analysis 6.1 Overview of GIS market ecosystem and value chain participants 6.2 GIS manufacturers (OEMs) 6.2.1 Global OEMs, including Siemens, ABB, GE, and Eaton 6.2.2 China OEMs, including China XD, Pinggao, and Sieyuan 6.2.3 Role in design, engineering, and system integration 6.2.4 Product innovation and technology leadership 6.2.5 Role of Product Lifecycle Management (PLM) in GIS product design, engineering optimization, and lifecycle efficiency 6.2.6 Integration of digital PLM platforms for product development, testing, compliance, and maintenance management 6.3 Component providers 6.3.1 Electrical component suppliers, including relays, sensors, and control systems 6.3.2 Insulation and SF₆ gas system providers 6.3.3 Automation and digital monitoring solution providers 6.3.4 Role in enhancing performance, safety, and reliability 6.4 Distributors and resellers 6.5 Regional distributors and system integrators 6.5.1 Role in market penetration and last-mile delivery 6.5.2 Aftermarket services and maintenance support 6.5.3 Local partnerships in emerging markets, including China, Asia, and MEA 6.6 End users 6.6.1 Utility companies, including power transmission and distribution 6.6.2 Industrial users, including oil & gas, manufacturing, and mining 6.6.3 Infrastructure sector, including railways, airports, and metro 6.6.4 Energy companies, including renewable and conventional power 7. Pricing Analysis and Cost Structure Evaluation (2020–2025) 7.1 Historical pricing trends across MV, HV, and UHV GIS systems 7.2 Cost components including circuit breakers, enclosures, and insulation systems 7.3 Impact of raw material price volatility on GIS pricing 7.4 Pricing strategies across global vs China manufacturers 7.5 Techno-commercial comparison of SF₆ and SF₆-free GIS technologies based on lifecycle cost, operational efficiency, and ROI 7.6 Margin analysis across manufacturing and EPC stages 7.7 Future pricing outlook considering demand-supply equilibrium 8. Raw Material Analysis and Input Cost Trends 8.1 Overview of key raw materials used in GIS manufacturing 8.2 Availability and sourcing trends of SF₆ gas and alternatives 8.3 Dependence on global supply chains for critical components 8.4 Cost trends of metals, including copper and aluminum, impacting GIS systems 8.5 Sustainability trends in raw material sourcing and usage 8.6 Future outlook for eco-friendly materials and insulation gases 9. Technology Trends and Product Innovation Insights 9.1 Advancements in SF₆-free and eco-efficient GIS technologies 9.2 Development of compact GIS for urban substations 9.3 Digital monitoring systems for GIS condition tracking 9.4 Integration of IoT and AI in GIS performance optimization 9.5 R&D focus areas in next-generation GIS technologies including eco-efficient insulation systems and digital substations 9.6 Innovation pipeline analysis covering prototype development, pilot projects, and commercialization trends 9.7 Technology readiness assessment and commercialization potential of emerging GIS technologies 9.8 Innovation in arc interruption and insulation technologies 9.9 Future technology roadmap shaping next-generation GIS systems 10. Demand-Supply Analysis and Market Balance 10.1 Current demand levels across utility and industrial installations 10.2 Supply capacity trends across global and China manufacturing hubs 10.3 Demand-supply gap analysis across regions 10.4 Inventory and stock management practices across OEMs 10.5 Commercial opportunity assessment for future GIS deployment projects across utility and industrial sectors 10.6 Seasonal demand variations linked to infrastructure projects 10.7 Forecast demand-supply balance over coming years 11. Trade Analysis and Import-Export Trends (2020–2025) 11.1 Export performance of GIS equipment across global markets 11.2 China’s role as a major exporter of GIS systems 11.3 Trade flows across Asia, Middle East, and Africa 11.4 Tariff structures impacting international trade competitiveness 11.5 Trade agreements influencing GIS supply chain dynamics 11.6 Future outlook on global trade and export growth opportunities 12. End-Use Industry Consumption Patterns Analysis (2020–2025) 12.1 Utility sector dominance in GIS consumption globally 12.2 Industrial sector demand, including oil & gas, manufacturing, and mining 12.3 Infrastructure sector demand, including metro, airports, and railways 12.4 Data center expansion driving medium voltage GIS demand 12.5 Renewable energy sector contributing to GIS deployment 12.6 Construction and urban projects requiring compact GIS solutions 13. China Market Overview and Strategic Importance 13.1 China’s share in global GIS market demand and production 13.2 Role of State Grid Corporation in market dominance 13.3 Growth of UHV transmission projects in China 13.4 Rapid urbanization driving compact GIS demand 13.5 Domestic manufacturing strength and export capabilities 13.6 Strategic importance of China in global GIS supply chain 14. Infrastructure Development Impact on GIS Demand (2020–2034) 14.1 Expansion of power transmission and distribution networks 14.2 Urban infrastructure projects driving GIS adoption 14.3 Government investments in smart grid and digital substations 14.4 Industrial corridor development influencing GIS demand 14.5 Renewable energy integration projects requiring advanced substations 14.6 Business opportunity analysis linked to smart grid expansion, renewable integration, and urban infrastructure modernization projects 14.7 Future infrastructure pipeline supporting long-term GIS growth 15. Digital Substation and Smart Grid Adoption Analysis 15.1 Adoption of digital substations across developed and emerging markets 15.2 Integration of IoT, AI, and cloud-based monitoring in GIS 15.3 Smart grid investments in China and Asia-Pacific 15.4 Techno-commercial viability of digital substations and smart GIS deployment models 15.5 Automation trends in grid infrastructure 15.6 Benefits of predictive maintenance and remote monitoring 15.7 Future outlook of fully automated substations 16. Aftermarket Services and Maintenance Strategy Analysis (2020–2034) 16.1 Maintenance models, including preventive and predictive maintenance 16.2 Service contracts with utilities and industrial clients 16.3 Lifecycle management strategies of GIS systems 16.4 PLM-driven maintenance optimization and lifecycle extension strategies for GIS systems 16.5 Spare parts and replacement demand trends 16.6 Digital monitoring reducing maintenance costs 16.7 Aftermarket revenue contribution to OEMs 17. Customer Decision-Making and Procurement Criteria Analysis 17.1 Key decision factors, including price, reliability, and lifecycle cost 17.2 Utility procurement evaluation models 17.3 China State Grid tender criteria 17.4 Importance of after-sales service and support 17.5 Vendor selection benchmarking 17.6 Future evolution of procurement strategies 18. China UHV Transmission Network Expansion Analysis (2020–2034) 18.1 Growth of Ultra High Voltage (UHV) transmission projects in China 18.2 Government investments in long-distance power transmission 18.3 Role of GIS in UHV substations 18.4 Key provinces leading UHV infrastructure deployment 18.5 Integration of renewable energy through UHV networks 18.6 Future roadmap for China’s national grid expansion 19. Country-Level Demand Analysis (Top Markets) 19.1 United States GIS demand trends 19.2 Germany and Europe grid modernization demand 19.3 China as dominant demand and production hub 19.4 India and Southeast Asia emerging demand 19.5 Middle East infrastructure-driven GIS demand 19.6 Country-level demand outlook and growth hotspots 20. China Regional Market Analysis (Province-Level) 20.1 Key provinces driving GIS demand, including Guangdong, Jiangsu, and Zhejiang 20.2 Regional industrial clusters influencing demand 20.3 Infrastructure development differences across provinces 20.4 UHV projects concentration by region 20.5 Provincial government investment trends 20.6 Regional growth outlook within China 21. China Domestic Demand vs Export Consumption Analysis 21.1 Share of domestic consumption vs export volume 21.2 Growth of domestic grid demand 21.3 Export reliance in manufacturing capacity utilization 21.4 Regional export dependency trends 21.5 Government policies influencing domestic consumption 21.6 Future demand balance outlook 22. Circular Economy and Lifecycle Management Analysis 22.1 Recycling and reuse of GIS components 22.2 Lifecycle management practices for substations 22.3 Product Lifecycle Management (PLM) strategies supporting recycling, refurbishment, maintenance, and end-of-life optimization 22.4 End-of-life disposal regulations 22.5 Role of circular economy in power infrastructure 22.6 Sustainability initiatives by OEMs 22.7 Future outlook for circular GIS systems 23. Environmental Impact and Sustainability Trends (2020–2034) 23.1 Growing focus on reducing SF₆ emissions in GIS systems 23.2 Adoption of eco-efficient GIS technologies 23.3 Lifecycle environmental impact assessment of GIS systems 23.4 Recycling and disposal practices for GIS components 23.5 Industry initiatives promoting sustainability in grid infrastructure 23.6 Future outlook for green GIS technologies 24. Substation Modernization and Retrofit Market Analysis 24.1 Replacement of aging substations with GIS systems 24.2 Retrofit demand in developed markets, including Europe and North America 24.3 China’s substation upgrade initiatives 24.4 Cost-benefit analysis of retrofitting vs new installations 24.5 Key challenges in retrofit projects 24.6 Future retrofit demand outlook 25. Investment Landscape and Funding Trends 25.1 Investment trends in GIS manufacturing and technology 25.2 Private equity and infrastructure fund participation 25.3 Business potential assessment for investors across manufacturing, digital GIS technologies, and eco-efficient infrastructure projects 25.4 Forecast investment opportunities by region and technology segment through 2034 25.5 Government funding in grid modernization 25.6 Venture investments in digital grid technologies 25.7 Expansion funding for manufacturing capacity 25.8 Future investment outlook 26. Project Pipeline and Order Book Analysis 26.1 Total project pipeline (USD Billion) 26.2 Number of ongoing GIS projects 26.3 Order backlog (USD / Units) 26.4 UHV project pipeline in China 26.5 Project completion timelines (months) 26.6 EPC contract values 27. Standardization and Certification Landscape 27.1 Global standards, including IEC and IEEE compliance requirements 27.2 China GB/T certification standards 27.3 Product testing and validation procedures 27.4 Certification challenges in international markets 27.5 Standard harmonization across regions 27.6 Future outlook for global standard alignment 28. China Government Policies and Five-Year Plan Impact 28.1 Role of China’s Five-Year Plans in grid expansion 28.2 Policy support for UHV transmission infrastructure 28.3 Investment in renewable integration infrastructure 28.4 Incentives for domestic manufacturing 28.5 Environmental policies impacting GIS technologies 28.6 Future policy outlook 29. Regulatory Framework and Compliance Landscape 29.1 Overview of global regulations governing GIS deployment 29.2 SF₆ emission norms and environmental compliance requirements 29.3 China GB standards and grid-specific compliance frameworks 29.4 Safety regulations for high voltage equipment 29.5 Government initiatives promoting eco-friendly GIS adoption 29.6 Future regulatory outlook shaping GIS industry 30. Risk Analysis and Market Sensitivity Assessment 30.1 Impact of raw material price volatility on GIS costs 30.2 Techno-commercial risk assessment associated with SF₆-free technology adoption and digital grid transition 30.3 Regulatory risks related to SF₆ gas restrictions 30.4 Supply chain disruptions and geopolitical risks 30.5 Technology substitution risks, including AIS and hybrid systems 30.6 Demand fluctuations due to economic cycles 30.7 Risk mitigation strategies for OEMs and investors 31. Global Gas Insulated Switchgear Market Size and Forecast by Segmentation, by Value USD Billion and Volume in 000’ Units (2025–2034) 31.1 Global Gas Insulated Switchgear Market Size and Forecast, By Insulation Type 31.1.1 SF₆ 31.1.2 SF₆-Free 31.2 Global Gas Insulated Switchgear Market Size and Forecast, By Installation 31.2.1 Indoor 31.2.2 Outdoor 31.3 Global Gas Insulated Switchgear Market Size and Forecast, By Voltage Rating 31.3.1 Up to 5 kV 31.3.2 6 to 15 kV 31.3.3 16 to 27 kV 31.3.4 28 to 40.5 kV 31.3.5 40.6 to 73 kV 31.3.6 74 to 220 kV 31.3.7 Above 220 kV 31.4 Global Gas Insulated Switchgear Market Size and Forecast, By Configuration 31.4.1 Hybrid GIS 31.4.2 Isolated GIS 31.4.3 Integrated 3-Phase GIS 31.4.4 Compact GIS 31.5 Global Gas Insulated Switchgear Market Size and Forecast, By End User 31.5.1 Power Utilities 31.5.2 Industrial 31.5.2.1 Oil & Gas 31.5.2.2 Mining 31.5.2.3 Chemical & Petrochemical 31.5.2.4 Steel & Metal 31.5.2.5 Others, including cement 31.5.3 Commercial Infrastructure 31.5.3.1 Airports & Metros 31.5.3.2 Data Centers 31.5.3.3 Hospitals & Commercial Complexes 31.5.4 Renewable Energy Sector 31.5.4.1 Solar PV Substations 31.5.4.2 Wind Farms 31.5.4.2.1 Onshore 31.5.4.2.2 Offshore 31.5.4.3 Battery Energy Storage Systems (BESS) 32. Key Findings 33. Strategic Moves and Industry Outlook 34. Research Methodology 35. Competitive Landscape 35.1 MMR Competition Matrix 35.2 Competitive positioning of leading key players by revenue and market share (%) 35.3 Key players benchmarking 35.3.1 Company Name 35.3.2 Headquarter 35.3.3 Product Portfolio 35.3.4 End-User Segments 35.3.5 Revenue (2025) 35.3.6 Growth Rate (Y-o-Y %) 35.3.7 R&D Investment (%) 35.3.8 Profit Margin (%) 35.3.9 Innovation Capability 35.3.10 OEM & Strategic Partnerships 35.3.11 Sustainability Certifications 35.3.12 Geographic Presence 35.4 Market Structure 35.4.1 Market Leaders 35.4.2 Market Followers 35.4.3 Emerging Players 35.5 Mergers and Acquisitions Details 35.6 Recent Key Developments 36. Company Profiles: Key Players 36.1 Overview 36.2 Business Portfolio 36.3 Financial Overview 36.4 SWOT Analysis 36.5 Strategic Analysis 36.6 Recent Developments 36.7 Key Companies Covered 36.7.1 Siemens AG 36.7.2 ABB Ltd. 36.7.3 General Electric 36.7.4 Schneider Electric 36.7.5 Mitsubishi Electric 36.7.6 Eaton Corporation 36.7.7 Hitachi Ltd. 36.7.8 Hyundai Electric 36.7.9 Fuji Electric 36.7.10 Toshiba Energy Systems & Solutions Corporation 36.7.11 Hyosung Heavy Industries 36.7.12 ELEKTROBUDOWA S.A. 36.7.13 Yueqing Livond Electric Co. Ltd. 36.7.14 CG Power and Industrial Solutions Nissin Electric 36.7.15 Meidensha Corporation 36.7.16 Powell Industries 36.7.17 Lucy Electric 36.7.18 Xi’an XD Switchgear Electric Co., Ltd. 36.7.19 Sieyuan Electric Co., Ltd. 36.7.20 Switchgear Company 36.7.21 Henan Pinggao Electric Co., Ltd. 36.7.22 SEL S.p.A. 36.7.23 ILJIN Electric 36.7.24 Bharat Heavy Electricals Limited 36.7.25 CHINT Group Co., Ltd. 36.7.26 Chung-Hsin Electric and Machinery Manufacturing Corp. 36.7.27 Xiamen Huadian Switchgear Co., Ltd. 36.7.28 Kexun Electric Co., Ltd. 36.7.29 SYHF (Jiangsu) Electric Co., Ltd. 36.7.30 KDM Switchgear (KDM Steel) 36.7.31 Ningbo Tianan (Group) Co., Ltd. 36.7.32 Beijing Banner Electric Co., Ltd. 36.7.33 CNC Electric 36.7.34 Guangdong Mingwang Electric Co., Ltd. 36.7.35 Sunten Electric Equipment Co., Ltd. 37. Global Market Concentration and Herfindahl-Hirschman Index (HHI) Analysis in Gas Insulated Switchgear Market 37.1 Global market concentration ratios by voltage category, including medium voltage, high voltage, and ultra-high voltage 37.2 Regional Herfindahl-Hirschman Index (HHI) comparison across North America, Europe, Asia-Pacific, and China 37.3 Market fragmentation vs consolidation trends among Tier-1 global OEMs and Tier-2 regional GIS manufacturers 37.4 Impact of mergers, acquisitions, and strategic partnerships on market share shifts and competitive positioning 37.5 Evaluation of vertical integration strategies, including components, insulation systems, assembly, and EPC capabilities 37.6 Assessment of horizontal integration among leading gas-insulated switchgear manufacturers 38. Top OEM and Tier-1/Tier-2 Supplier Market Share Analysis 38.1 Global and regional revenue share by voltage category and installation type 38.2 Top Tier-1 gas-insulated switchgear manufacturers’ contribution to global market share 38.3 Ranking of Tier-2 and Tier-3 component suppliers, enclosure manufacturers, relay and control system providers 38.4 Comparative analysis of OEM supplier dependency and sourcing diversification 38.5 Role of long-term utility contracts, framework agreements, and approved vendor lists in market share distribution 38.6 Regional dominance of key suppliers across the major power infrastructure market 39. Emerging Entrants and Niche Specialists in the Gas Insulated Switchgear Market 39.1 Analysis of new market participants, specialized technology providers, and innovation-driven GIS players shaping competitive dynamics 39.2 Growth of eco-GIS and SF₆-free technology developers entering the market 39.3 Emergence of specialists in digital substations, smart monitoring systems, and IoT-enabled GIS solutions 39.4 Role of Tier-3 innovators in component manufacturing, control systems, and insulation technologies 39.5 Regional SME participation driven by localization requirements and cost competitiveness, with China focus 39.6 Strategic acquisitions of niche technology firms by Tier-1 GIS OEMs 39.7 Entry of startups focusing on AI-based monitoring, predictive maintenance, and grid digitalization 40. Market Share and Competitive Positioning Analysis (2025) 40.1 Evaluation of competitive landscape, leadership positioning, and segment-wise dominance among GIS manufacturers 40.2 Market share distribution by voltage category and end-user segment 40.3 Leadership in high-voltage and ultra-high voltage GIS segment by key global and China players 40.4 Competitive positioning in eco-GIS and digital substation solutions 40.5 Regional leadership across North America, Europe, and Asia-Pacific, including China dominance 40.6 Positioning of integrated OEMs versus specialized component and system providers 40.7 Competitive benchmarking based on quality, certification, pricing, and technology capabilities 41. Detailed Manufacturer Benchmarking and Company Profiling 41.1 In-depth comparison of leading GIS manufacturers based on product portfolio, production capabilities, and market positioning 41.2 Benchmarking across voltage coverage, including MV, HV, and UHV, and application segments 41.3 Analysis of manufacturing capacity, geographic presence, and supply chain integration 41.4 Evaluation of R&D capabilities, digital integration, and sustainability initiatives 41.5 Comparison of pricing strategies, cost competitiveness, and service offerings 41.6 Assessment of partnerships, EPC capabilities, and project execution strength 42. China Market Competitive Landscape and Localization Strategy (2020–2025) 42.1 Competitive positioning of domestic versus global gas insulated switchgear manufacturers in China 42.2 Localization strategies adopted by global OEMs to strengthen market penetration in China 42.3 Role of state-owned enterprises in shaping market leadership and procurement dominance 42.4 Pricing competition between domestic manufacturers and international OEMs 42.5 Competitive intensity analysis across medium-voltage, high-voltage, and ultra-high-voltage GIS segments 43. Company Business Strategies and Growth Approaches (2020–2034) 43.1 Expansion strategies focusing on UHV and smart grid infrastructure 43.2 Product diversification into digital GIS and compact substations 43.3 Strategic collaborations with utilities and EPC contractors 43.4 Investment in R&D for eco-friendly insulation technologies 43.5 Geographic expansion strategies across Asia, Middle East, and Africa 44. Product Portfolio Analysis of Leading Companies (2025) 44.1 Overview of GIS product offerings across MV, HV, and UHV segments 44.2 Industrial vs utility GIS application mapping 44.3 Specialty GIS solutions for urban underground substations 44.4 Product differentiation based on compactness, safety, and reliability 44.5 New product launches in SF₆-free and hybrid GIS systems 44.6 Future product development aligned with grid modernization 45. Production Capacity and Manufacturing Footprint Analysis (2020–2025) 45.1 Overview of manufacturing facilities and geographic footprint 45.2 Production capacity utilization trends across major OEMs 45.3 Expansion of GIS manufacturing plants across China, Europe, and India 45.4 Investment in advanced manufacturing technologies 45.5 Supply chain integration enhancing production efficiency 46. Research and Development and Innovation Strategies (2020–2034) 46.1 Investment in SF₆-free, eco-efficient, and alternative insulation GIS technologies 46.2 Development of digital substations, smart monitoring, and automation systems 46.3 Collaboration with research institutions, universities, and grid operators 46.4 Patent filings and innovation in insulation, switching, and arc interruption technologies 46.5 Development of compact and modular GIS for space-constrained urban environments 46.6 Integration of AI, IoT, and predictive maintenance technologies 46.7 Innovation in hybrid GIS and digital twin-based substation solutions 47. Branding and Market Positioning Strategy Analysis (2020–2025) 47.1 Brand positioning strategies focusing on premium versus cost-effective GIS solutions 47.2 Marketing campaigns highlighting reliability, safety, and lifecycle performance benefits 47.3 Digital marketing initiatives promoting smart grid and digital substation capabilities 47.4 Strategic positioning across developed and emerging markets 47.5 Customer engagement strategies targeting utilities, EPC contractors, and industrial clients 47.6 Competitive positioning of global OEMs versus China-based manufacturers 47.7 Brand differentiation based on sustainability and eco-GIS offerings 47.8 Future branding focus aligned with green grid and decarbonization trends 48. Export Strategy and International Market Presence (2020–2025) 48.1 Export performance analysis of global and China-based GIS manufacturers 48.2 Key export destinations across Asia, Middle East, Africa, and Latin America 48.3 Competitive advantages in international tenders, including cost, technology, and EPC capabilities 48.4 Trade dynamics, tariffs, and regional demand variations influencing exports 48.5 Expansion strategies in emerging infrastructure markets 48.6 Future export growth strategies driven by global grid modernization 49. Mergers, Acquisitions and Strategic Partnerships Analysis (2020–2025) 49.1 Overview of recent mergers and acquisitions in the GIS and power equipment industry 49.2 Strategic alliances enhancing technological capabilities and market expansion 49.3 Joint ventures supporting entry into new regional and high-growth markets 49.4 Partnerships with renewable energy developers and infrastructure companies 49.5 Collaboration between global OEMs and China-based manufacturers 49.6 Acquisitions of niche technology firms, including eco-GIS and digital substations 49.7 Integration strategies post-M&A for operational and market synergies 49.8 Impact of partnerships on competitive positioning and market share 50. Recent Strategic Developments (2024–2025) 50.1 Expansion of ultra-high voltage transmission projects across China and Asia-Pacific 50.2 Deployment of SF₆-free and eco-efficient GIS technologies aligned with environmental regulations 50.3 Implementation of digital substations and smart grid infrastructure projects 50.4 New GIS manufacturing facility expansions and capacity additions globally 50.5 Strategic partnerships and EPC contract wins in utility-scale transmission projects 50.6 Product launches focused on compact GIS and urban substation applications 50.7 Investments in digital monitoring, automation, and predictive maintenance solutions 50.8 Expansion into emerging markets through infrastructure and grid modernization projects

Custom Market Research Services

We Will Customise The Research For You, In Case The Report Listed Above Does Not Meet With Your Requirements