
Dairy Alternatives Market Size by Source, Application, Distribution Channel, Region – Segment-Level Market Assessment, Growth Opportunity Analysis, Competitive Mapping & Forecast to 2032
Overview
The Dairy Alternatives Market size was valued at USD 30.13 Billion in 2024 and the total Dairy Alternatives revenue is expected to grow at a CAGR of 12.62% from 2025 to 2032, reaching nearly USD 77.98 Billion.
Numerous factors contribute to the rise in popularity and growth of dairy alternatives market, including the need to avoid dairy allergies, the demand for clean-label goods, compatibility with vegetarian, vegan, and flexitarian diets, and concerns about sustainability and animal welfare.
 To know about the Research Methodology :- Request Free Sample Report
Dairy Alternatives Market MMR Key Findings:
1. Milk alternative sales rose by 14.5% showing significant growth compared to cow milk sales which decreased by 1.2% in 2024.
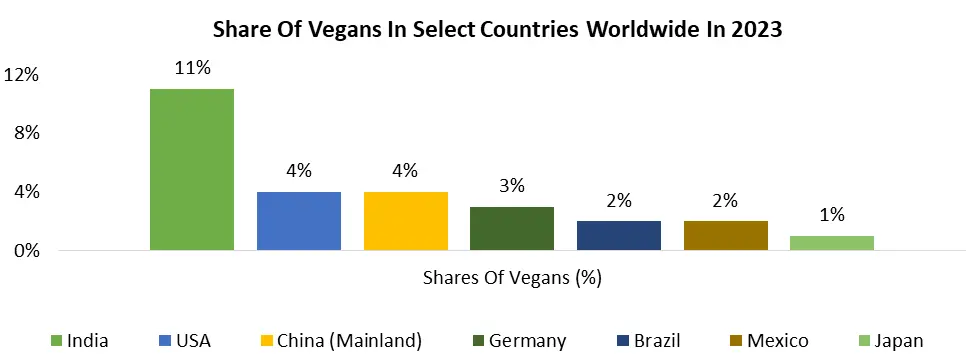
2. APAC is a leading region in the global dairy alternatives market. India, China, Japan, and South Korea collectively held the maximum market share of more than 70%, exhibiting significant consumption of dairy alternatives in recent years, compared to other Asian countries.
3. U.S. American households spent an average of 6.3% more on milk alternatives, showing consumers have made the switch to non-dairy lifestyles.
4. Oat milk sales increased by 117.9% indicating that consumers are interested in buying new, alternative forms of milk beyond cow and nut-based milk.
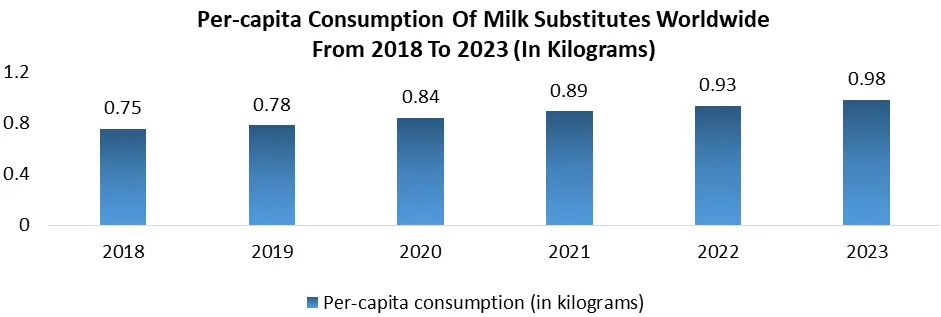
According to the MMR analysis, consumption of milk alternatives such as soy and almond milk is increasing at the same rate as dairy milk is decreasing in the milk market. Plant-based milk alternatives, like soy, almond, oat, and coconut milk, are popular for health, ethical, and environmental reasons. While their taste varies, they offer diverse nutrition profiles. Dairy milk provides essential micronutrients like phosphorus, selenium, and zinc. Understanding the nutritional variances among plant-based options is crucial for consumers seeking to maintain a balanced diet. Thus, dairy alternatives are gaining popularity among consumers, supporting the dairy alternatives market growth.
While almond, coconut, and soy milk remain the most popular types of non-dairy milk, other nut and plant bases are gaining traction, including pecan, quinoa, hazelnut, and flax milk. Both established and emerging firms are taking advantage of the burgeoning non-dairy milk category by developing different non-dairy substrates. These initiatives boosting the global dairy alternatives market growth rapidly.
Innovation is expected to be a catalyst to drive the segment, as both mainstream bases like almond and alternative plant bases offer added functional benefits and unique flavors.
India stands out as a prominent player in the global dairy alternatives market thanks to the substantial shift toward plant-based living. The country held the highest market share in the global dairy alternatives market in 2024 and is expected to offer lucrative growth potential for dairy alternatives manufacturers during the forecast period. With a significant percentage of vegetarians in Asia-Pacific, India's need for plant-based proteins is gradually rising. In 2021, a large proportion of the Indian people stated a desire to enhance their general health and immunity through dietary modifications. The food and beverage category leads India's plant-based protein market. As of 2022, around 24% of Indians were strictly vegetarian, 9% were vegan, and 8% were classified as pescatarians. Rising health consciousness and rising income levels, resulting in increased protein affordability, have propelled the rise of India's dairy alternatives market.
Dairy Alternatives Market Key Dynamics:
Increasing Consumer Preferences For Vegan Foods
The global shift towards plant-based and flexitarian diets is driving the dairy alternatives market significantly. These dietary choices have grown in popularity due to a variety of considerations, including concerns about the well-being of animals, environmental challenges, and personal health. Veganism has arisen as a lifestyle choice that avoids eating animal-derived products, including dairy. The growing global awareness of animal cruelty has increased demand for dairy alternatives at a rapid pace. Many customers consider a vegan diet to be a healthy choice, preferring dairy substitutes such as soy milk, almond milk, rice milk, and other plant-based options to regular dairy milk.
Veganism has grown dramatically during the last several years across the world. The Economist called 2019 "The Year of the Vegan," highlighting the rising popularity of this dietary choice. The COVID-19 pandemic, which caused lifestyle changes and increased worries about the environmental effects of animal production, has exacerbated this tendency. In 2020, the number of vegans in the United Kingdom increased by 40%, reaching more than 1.5 million. The Veganuary movement, in which people promised to go vegan for the month of January, drew over 500,000 people in the same year.
Between 2014 and 2017, the number of vegan customers in the United States increased by 600%, from 1% to 6%, while sales of plant-based alternatives to animal-based meals increased by more than USD 3.7 billion. India, too, has seen a booming vegan food sector, thanks to its varied population and cultural habits. As of 2020, India had over 500 million vegetarians and 5 million severe vegans. According to the MMR analysis, Veganism in India is anticipated to grow at a Compound Annual Growth Rate (CAGR) of 13.32% between 2023 and 2032.
Veganism's popularity originates from its tremendous environmental benefits. A United Kingdom survey of 55,000 individuals discovered that vegan diets produce 75% less emissions, water pollution, and land use than meat-heavy diets, as well as a 66% reduction in wildlife devastation and a 54% drop in water consumption. A study of 38,000 farms in 119 countries found that beef production generates 25kg CO2 per 100g protein, but plant-based alternatives release just 0.36kg. Meat and dairy production causes greenhouse gas emissions, water shortages, and deforestation. The US EPA identified animal husbandry as the world's top methane emitter, aggravating climate change. Veganism addresses these concerns by limiting meat and dairy intake.
In addition to their environmental benefits, vegan diets have several health benefits. According to studies, vegans ingest more fiber, antioxidants, potassium, magnesium, folate, and vitamins A, C, and E, which reduces their risk of chronic illnesses. According to research, vegans have lower blood sugar levels and a 78% lower incidence of type 2 diabetes, which reduces related hazards such as obesity. While vegan diets often contain less protein per gram than animal diets, this may be addressed by protein fortification with plant-based sources in a variety of food and beverage applications. As a result, growing numbers of vegans are considerably boosting the global dairy alternatives market size.
Dairy Alternatives Market Potential Opportunities and Challenges:
The burgeoning popularity of plant-based milk alternatives presents a dual-edged scenario, encapsulating both opportunities and challenges for various stakeholders within the dairy alternatives industry and the broader food system. At the forefront lie dairy farmers and end consumers, both susceptible to the ramifications of this shifting landscape. Dairy United Kingdom underscores the magnitude of this impact, with approximately 50,000 jobs supported by dairy production across 14,000 farms, and an additional 27,000 jobs in milk processing. This substantial contribution, amounting to nearly 15% of the United Kingdom’s agricultural output, underscores the economic significance of the dairy sector. However, reduced demand stemming from the ascendance of plant-based alternatives threatens jobs and livelihoods, potentially triggering negative repercussions at local and national economic levels. Moreover, dairy farming's pivotal role in land management necessitates adaptation strategies in light of diminished grazing demands, emphasizing the interconnectedness of agricultural practices with broader environmental concerns.
Conversely, the rise of plant-based milk alternatives offers a pathway to a more environmentally sustainable food system. Thus, this factor is expected to offer lucrative growth opportunities in the dairy alternatives market. The environmental footprint of dairy production, characterized by significantly higher greenhouse gas emissions and land usage compared to plant-based counterparts, underscores the imperative for transitioning towards more sustainable practices. However, not all plant-based alternatives are created equal in terms of environmental impact, with variations in resource consumption across different varieties. While almond and rice milk demand substantial water inputs, options like soy and oat milk emerge as more sustainable alternatives, with oats particularly promising due to their compatibility with the climate and existing agricultural infrastructure.
Navigating this landscape necessitates multifaceted policy interventions to support economic diversification within the dairy industry and ensure consumer welfare. Agricultural subsidies are expected to be redirected to incentivize transitions towards sustainable land use practices, such as renewable energy initiatives or the cultivation of crops like oats. Exemplars like Standhill Farm demonstrate the potential for diversification, intertwining dairy production with renewable energy generation and crop cultivation. Government subsidies could alleviate the financial barriers associated with infrastructure investments, fostering resilience and innovation within the sector. Furthermore, regulatory measures mandating micronutrient fortification in plant-based alternatives can safeguard consumers against potential nutritional deficiencies, ensuring parity with traditional dairy products. These all factors are expected to impact the dairy alternatives market significantly.
Dairy Alternatives Market Segment Overview:
Oats And almonds Are Expected To Be The Hot Industry Segment
Based on the Source, the Soy segment held the maximum market share of more than 40% in 2024 and dominated the global dairy alternatives market. The segment is expected to grow at a CAGR of 9.42% and offer lucrative growth opportunities for the dairy alternatives manufacturers during the forecast period. The key factors boosting soy milk demand are shifting consumer preferences toward vegan meals and an increase in incidences of lactose intolerance. The rising frequency of milk allergies is fuelling demand for milk alternatives including soy milk and almond milk. Soy milk has more vitamins, proteins, and potassium than cow's milk while having less calories. Because of its high vitamin content, it is regarded as a great dairy alternative. An additional factor fueling the segment's growth is the rising popularity of tofu in Asia Pacific, which is formed from condensed soy milk and serves as a substitute for cottage cheese and beef.
Top 5 Regions For Drinking Non-Dairy Milk
According to MMR analysis, oat and almond sales are getting much closer in volume, with oats growing the fastest in particular due to an increase in food service usage. Almond milk alternatives are the most frequently consumed in the U.S., with 2 in 5 shoppers purchasing it in 2024. Oat, coconut, and soya milk are all relatively equal, with 15-20% of consumers purchasing these plant-based milk products in 2024.
Functional Components Of Plant-Based Milk Alternatives And Their Health Benefits
| Type of milk | Functional or bioactive component | Health benefits |
| Soy milk | Isoflavones | Protective effect against cancer, cardiovascular disease, and osteoporosis |
| Phytosterols | Cholesterol-lowering properties | |
| Peanut milk | Phenolic compounds | Protective role against oxidative damage and diseases like coronary heart disease, stroke, and various cancers |
| Rice milk | Phytosterols, especially -sitosterol and y-oryzanol | Lowers cholesterol, hypertension, anti-diabetic, anti-inflammatory, and anti-oxidative effects |
| Oat milk | 3-Glucan | Increases in solution viscosity can delay gastric emptying time and increase gastrointestinal transit time which is associated with their reduced blood glucose level. hypocholesterolemic effect by reducing total and LDL cholesterol |
| Sesame milk | lignans such as sesamin, sesamolin, sesaminol | Neutraceutical properties such as antioxidative, hypocholesterolemic, anticarcinogenic, antitumor, and antiviral activities |
| Almond milk | Alpha-tocopherol Arabinose | Powerful antioxidant which plays a critical role in protecting against free-radical reactions Prebiotic properties |
| Coconut milk | Lauric acid | Lycopene |
| Vitamin E | Omega 3 |
Based on the distribution channel, the Supermarket & Hypermarkets segment led the global dairy alternatives market with the highest revenue share in 2024. The segment is expected to grow at a significant CAGR during the forecast period. This is expected to be attributed to factors such as the easy availability of dairy alternatives in these retail outlets and consumer preference for physically inspecting and evaluating products before making a purchase. Supermarkets/hypermarkets are characterized as large-sized retail establishments that are conveniently accessible to consumers. The online segment is expected to hold the maximum market share by 2032 and present lucrative growth potential during the forecast period. The expansion of the e-commerce sector in developing countries is a major factor driving the growth of the segment due to factors such as cost efficiency and quick accessibility.
Dairy Alternatives Market Regional Insights:
Dairy Alternatives Market Is On The Rise In The United States
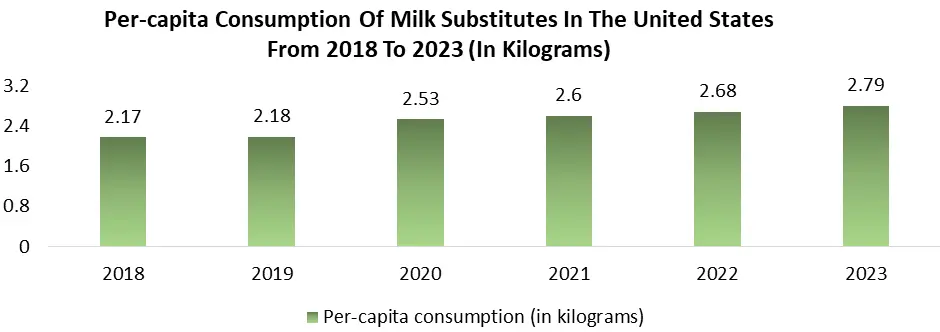
The United States dominated the North America dairy alternatives market with the highest revenue in 2024. Sales of milk alternatives such as almond milk, soy milk, and oat milk increased 22.5% in 2024 compared to the previous year. Health is the major factor that consumers are choosing milk alternatives. This includes people with dietary restrictions such as lactose intolerance as well as those who are seeking lower amounts of saturated fat and cholesterol. This has seen some traditional dairy players jumping on board. Environmental concerns about dairy production are also driving the uptake of milk alternatives among some U.S. consumers, although sustainability concerns are also being aimed at some of the popular plant-based alternatives such as the water-intensive nature of growing almonds in dry regions of the U.S.
The U.S. Food and Drug Administration (FDA) is set to release formal industry guidance on consumer labeling for alternative milk within the next year, following a recent public consultation period. This guidance will specifically address the use of "standards of identity" for dairy products, such as milk, yogurt, or cheese, in the labeling of plant-based alternatives. Stakeholders in the U.S. dairy industry have emphasized that milk, under these standards, is defined as "the lacteal secretion, practically free from colostrum, obtained by the complete milking of one or more healthy cows." This highlights a concern regarding the labeling of plant-based products using terms traditionally associated with dairy.
Former FDA Commissioner Scott Gottlieb famously remarked in 2018 that "An almond doesn’t lactate," underscoring the distinction between traditional dairy and plant-based alternatives. While the FDA aims to support innovation and consumer choice, it also expresses concerns that labeling certain plant-based products with terms like "milk" may mislead consumers about their nutritional attributes compared to dairy products. This regulatory scrutiny and impending guidance is expected to impact the U.S. dairy alternatives market by requiring clearer differentiation in labeling between traditional dairy and plant-based alternatives. It may also prompt manufacturers to reconsider their marketing strategies and product formulations to better align with FDA regulations and consumer expectations.
U.S. Dairy Alternatives Market MMR Findings:
1. Plant-based milk, yogurt, cheese, and ice cream are rapidly increasing in the U.S. consumer market. Additionally, animal-free and cell-cultured dairy are gaining interest and investment in the dairy alternatives market.
2. Due to temporary stay-at-home lockdowns and dairy supply chain concerns, the coronavirus pandemic has increased consumer awareness of these products in the United States.
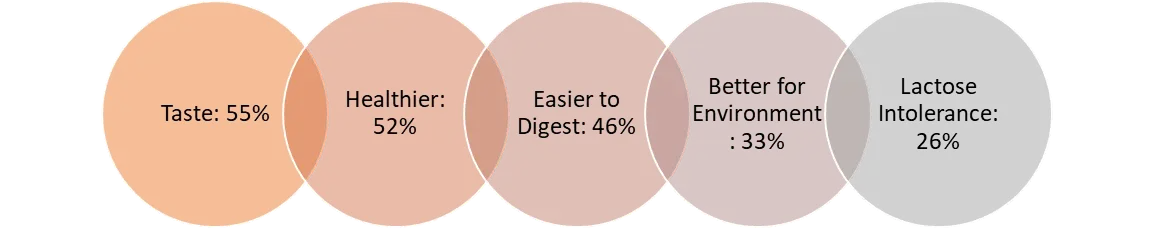
3. Consumers choose milk substitutes due to flavor, health, and environmental concerns over traditional dairy products.
4. In the U.S., almond milk is the most popular milk substitution, followed by oat milk. Alternatives include pistachio, pecan, and hemp milk.
5. Some companies aim to reproduce the qualities of cow's milk as precisely as possible.
6. New Zealand Company Avocadomilk is one company that has entered the U.S. market in the past two years and is now in 1,000 stores and has deals with the country's two biggest natural food distributors.
Dairy Alternatives Industry Ecosystem:
Dairy Alternatives Market Scope: Inquire before buying
| Global Dairy Alternatives Market | |||
|---|---|---|---|
| Report Coverage | Details | ||
| Base Year: | 2024 | Forecast Period: | 2025-2032 |
| Historical Data: | 2019 to 2024 | Market Size in 2024: | USD 30.13 Bn. |
| Forecast Period 2025 to 2032 CAGR: | 12.62% | Market Size in 2032: | USD 77.98 Bn. |
| Segments Covered: | By Source | Soy Almond Coconut Rice Oats Others |
|
| By Application | Milk Ice Cream Yogurt Cheese Creamers Butter Other |
||
| By Distribution Channel | Supermarket & Hypermarkets Convenience Stores Online retail Others |
||
Dairy Alternatives Market, by Region:
North America (United States, Canada, and Mexico)
Europe (United Kingdom, France, Germany, Italy, Spain, Sweden, Austria, and the Rest of Europe)
Asia Pacific (China, South Korea, Japan, India, Australia, ASEAN, and the Rest of APAC)
Middle East and Africa (South Africa, GCC, and the Rest of ME&A)
South America (Brazil, Argentina Rest of South America)
Leading Companies in the Dairy Alternatives Industry
North America’s Leading Dairy Alternatives Food Providers:
1. Danone North America Public Benefit Corporation (US)
2. Elmhurst Milked Direct LLC (US)
3. The Hain Celestial Group, Inc. (US)
4. Blue Diamond Growers (US)
5. Eden Foods, Inc. (US)
6. Hiland Dairy (US)
7. Ripple Foods (US)
8. Kite Hill (US)
9. Califia Farms, LLC (US)
10. Rude Health (US)
11. Miyoko's Creamery (US)
12. PANOS Brand (US)
13. Daiya Foods Inc. (Canada)
14. Earth's Own Food Company Inc. (Canada)
15. SunOpta (Canada)
Major Dairy Alternatives Manufacturers in Europe:
16. Vly (Germany)
17. Valsoia S.p.A (Italy)
18. Qatly Group AB (Sweden)
19. Triballat Noyal (France)
20. Nutriops, S.L. (Spain)
21. Nestlé SA (Switzerland)
Key Dairy Alternatives Providers in Asia-Pacific:
22. PureHarvest (Australia)
23. One Good (India)
24. Freedom Foods Group Limited (Australia)
25. Sanitarium (New Zealand)
26. Green Spot Co., Ltd. (Thailand)
27. Coconut Palm Group Co. Ltd. (China)
28. Hebei Yangyuan Zhihui Beverage Co. Ltd. (China)
29. Kikkoman Corporation (Tokyo, Japan)
30. Vitasoy International Holdings Ltd. (Hong Kong)
FAQs:
1. What are the growth drivers for the Dairy Alternatives market?
Ans. Increased Consumer Preferences for Vegan Foods is expected to be the major drivers for the Dairy Alternatives market.
2. Which region is expected to lead the global Dairy Alternatives market during the forecast period?
Ans. North America is expected to lead the global Dairy Alternatives market during the forecast period.
3. What is the projected market size and growth rate of the Dairy Alternatives Market?
Ans. The Dairy Alternatives Market size was valued at USD 30.13 Billion in 2024 and the total Dairy Alternatives revenue is expected to grow at a CAGR of 12.62% from 2025 to 2032, reaching nearly USD 77.98 Billion.
4. What segments are covered in the Dairy Alternatives Market report?
Ans. The segments covered in the Dairy Alternatives market report are Source, Application, Distribution Channel and Region.