
Global Cocoa Butter Equivalent Market By Source, By Application, By Product Form, By Manufacturing Technology, By End-User Industry, By Distribution Channel, by Region and Forecast 2034
Overview
The Global Cocoa Butter Equivalent Market was valued at USD 1.62 Billion in 2025 and is projected to reach USD 2.76 Billion by 2034, growing at a CAGR of 6.10% during 2026-2034.
Global Cocoa Butter Equivalent Market Overview
The Global Cocoa Butter Equivalent (CBE) Market covers specialty vegetable fats that are compatible with natural cocoa butter and can replace part of it in chocolate and other fat-based products. CBEs are non-lauric fats with a triglyceride profile close to cocoa butter, built mainly on POP, POS and SOS triglycerides, which gives them similar melting behavior, snap, gloss and fat crystallization. They are made from palm oil fractions (mainly palm mid-fraction), shea, sal, illipe, kokum and mango kernel fats through fractionation, blending and, in some cases, enzymatic interesterification. CBEs differ from cocoa butter replacers (CBR) and cocoa butter substitutes (CBS), which are only partly compatible or are lauric-based and do not need tempering.
The Global Cocoa Butter Equivalent Market was valued at USD 1.62 Billion in 2025 and is projected to reach USD 2.76 Billion by 2034, growing at a CAGR of 6.10% during 2026-2034. In volume terms, the market is estimated at XX Kilotons in 2025 and is expected to reach XX Kilotons by 2034. Growth is supported by volatile cocoa and cocoa butter prices, chocolate makers’ efforts to protect margins through reformulation, rising demand for compound coatings, fillings and bakery products, and capacity additions in palm fractionation and specialty fat processing. Cocoa futures traded above USD 12,000 per metric ton in late 2024 and, although they have eased since, remained far above the historical range through 2026, which keeps cost-saving fats on the agenda of confectioners.
The value chain starts with the cultivation and collection of palm, shea, sal, illipe, kokum and mango kernel raw materials, followed by extraction, refining and fractionation into stearin and mid-fraction streams. Blending, interesterification and quality testing then produce CBE grades that are packed in blocks, pellets, flakes or liquid form for chocolate, confectionery, bakery and personal care manufacturers. Raw material quality, triglyceride consistency, regulatory inclusion limits, sustainability certification and the price gap against cocoa butter determine project economics and customer adoption.
The Maximize Market Research (MMR) report provides a comprehensive assessment of the Global Cocoa Butter Equivalent Market, covering market size, historical performance, growth forecasts, sources, applications, product forms, manufacturing technologies, end-user industries, distribution channels and regional opportunities from 2020 to 2034. It also examines industry developments, manufacturing capacity, pricing, regulation and the competitive landscape. With detailed profiles of 16 key industry participants, SWOT analysis, PESTLE analysis and Porter’s Five Forces analysis, the report helps clients understand market dynamics, evaluate competitors, identify emerging opportunities and make informed business, investment and market-entry decisions.
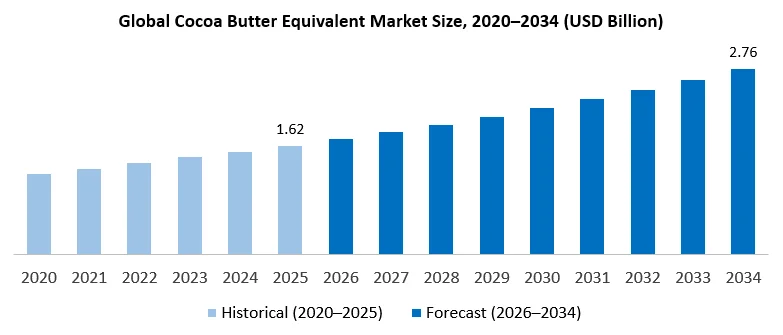
The Global Cocoa Butter Equivalent Market grew from USD 1.21 Billion in 2020 to USD 1.62 Billion in 2025 as chocolate makers raised CBE inclusion and specialty fat capacity expanded in Southeast Asia and Europe. The market is projected to reach USD 2.76 Billion by 2034, a CAGR of 6.10% during 2026-2034. Revenue added each year increases through the forecast period as higher-inclusion formulations, new fractionation capacity and growth in emerging chocolate markets lift volumes.
|
Parameter |
Value |
|
Market Size (2025) |
USD 1.62 Billion |
|
Market Size (2034) |
USD 2.76 Billion |
|
CAGR (2026-2034) |
6.10% |
|
Historical Period |
2020 to 2025 |
|
Forecast Period |
2026 to 2034 |
Global Cocoa Butter Equivalent Market Key Highlights
• Market Growth: The Global Cocoa Butter Equivalent Market was valued at USD 1.62 Billion in 2025 and is projected to reach USD 2.76 Billion by 2034, growing at a CAGR of 6.10% during 2026-2034.
• Cocoa Price Volatility: Cocoa futures peaked above USD 12,000 per metric ton in late 2024 and stayed volatile in 2026, with cocoa trading at USD 5,700 per metric ton on 6 October 2026 after a late-August spike to USD 6,771. Cost pressure keeps chocolate makers looking at higher CBE inclusion.
• Regulatory Framework: EU Directive 2000/36/EC allows up to 5% of specified vegetable fats, including palm, shea, sal, illipe, kokum and mango kernel fats, in chocolate, which anchors CBE demand in the largest consuming region and requires clear labeling.
• Technology Investment: AAK announced on 5 October 2026 that its patented dry fractionation technology will run commercially for the first time at NURA Speciality Oils & Fats in Malaysia, aimed at palm mid-fractions for CBE and at lower capital cost, operating cost and emissions.
• Leading Source: Palm oil fractions hold the largest source share at 44% in 2025, supported by secure supply, consistent triglyceride composition and established fractionation capacity.
• Leading Technology: Fractionation holds the largest manufacturing technology share at 38% in 2025, while enzymatic interesterification is gaining attention for tailored triglyceride profiles.
• Leading Application: Chocolate and confectionery holds the largest application share at 52% in 2025, followed by bakery products and chocolate coatings and fillings.
• Regional Outlook: Europe holds the largest regional share at 37% in 2025, and Asia Pacific is expected to be the fastest-growing region during 2026-2034.
• Competitive Landscape: AAK, Cargill, Bunge, Fuji Oil, Wilmar, Musim Mas, Mewah, 3F Industries, Intercontinental Specialty Fats, FGV and Kuala Lumpur Kepong are among the leading participants.
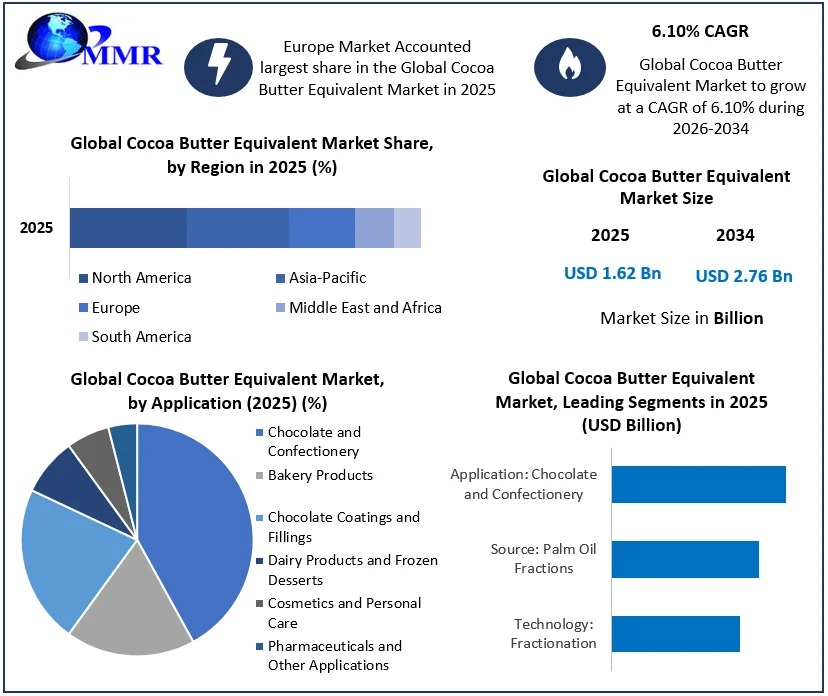
The snapshot summarizes the Global Cocoa Butter Equivalent Market at a glance. Europe leads the regional ranking with a 37% share in 2025, and chocolate and confectionery, palm oil fractions and fractionation are the leading application, source and technology segments. The market is projected to rise from USD 1.62 Billion in 2025 to USD 2.76 Billion in 2034, a CAGR of 6.10% during 2026-2034.
To know about the Research Methodology :- Request Free Sample Report
Cocoa Price Volatility and Reformulation Pressure to Drive Global Cocoa Butter Equivalent Market Growth
Cocoa futures climbed to a record close to USD 13,000 per metric ton in late 2024 after poor harvests in West Africa, then fell sharply in 2026. Prices were still around USD 5,700 per metric ton on 6 October 2026 after a spike to USD 6,771 in late August, well above the USD 2,000 to 3,000 range that held for much of the past two decades. Chocolate makers that bought at peak prices raised retail prices, and consumer volumes weakened, so reformulation has stayed on the agenda even as cocoa eased.
Because CBEs are compatible with cocoa butter, they let manufacturers replace part of the cocoa butter without a change in tempering practice, which keeps taste, snap and gloss close to the original. Suppliers are launching grades for higher inclusion. AAK’s ILLEXAO EN 10, launched on 28 May 2026, is designed to keep enrobing performance stable at high CBE levels, reflecting what customers now ask for.
Growth in Compound Coatings, Fillings, Bakery and Personal Care Applications to Create Opportunities in the Global Cocoa Butter Equivalent Market
Beyond chocolate bars, CBEs are used in chocolate coatings and fillings, bakery inclusions, frozen dessert coatings and confectionery centers where heat stability and cost matter. Rising confectionery and bakery output in India, China, Southeast Asia, the Middle East and Africa widens the customer base, especially where warm climates favor fats with higher thermal stability.
Shea, mango kernel and kokum-based fats are also used in cosmetics, personal care and pharmaceutical products such as lotions, lip care and suppositories. These applications are smaller than chocolate but add value, support supply of non-palm fats and give processors a way to balance seasonal raw material streams.
Dry Fractionation, Enzymatic Interesterification and Digital Manufacturing to Support Global Cocoa Butter Equivalent Market Expansion
Fractionation separates palm and other fats into stearin and mid-fraction streams by controlled cooling and filtration. On 5 October 2026, AAK said it will run its patented dry fractionation technology in commercial production for the first time at NURA Speciality Oils & Fats, a plant it is building with Kuala Lumpur Kepong in Pasir Gudang, Johor. The process makes palm mid-fractions, the base for AAK’s CBE range, without the solvents used in some routes, and AAK expects lower capital and operating cost and lower CO2e emissions. The joint venture was formed in October 2025 with an AAK commitment of about SEK 300 million over three years, and the plant is scheduled to start ramping up in 2028 and reach full production in 2029.
Enzymatic interesterification allows precise rearrangement of triglycerides to match cocoa butter more closely, although in EU chocolate the permitted fats may not be modified this way, so such grades mainly serve coatings, compound products and other markets. Process monitoring, AI-based quality control and predictive maintenance are improving yield and consistency in specialty fat plants.
Regulation, Labeling and Sustainable Sourcing Requirements Influencing Global Cocoa Butter Equivalent Market Growth
In the European Union, Directive 2000/36/EC allows chocolate to contain up to 5% of the finished product as vegetable fats other than cocoa butter. The permitted fats are illipe, palm oil, sal, shea, kokum gurgi and mango kernel, and they must be obtained only by refining or fractionation, without chemical or enzymatic modification of the triglyceride structure. Use must be declared on the label. Rules differ in other markets: some allow a similar limit, while the United States restricts vegetable fats in products sold as chocolate, which pushes CBE use towards coatings and compound products.
Sustainability rules also matter. The EU Deforestation Regulation covers palm oil and cocoa and, after two postponements, applies from 30 December 2026 to large and medium-sized companies and from 30 June 2027 to micro and small enterprises, following a Commission simplification package published on 4 May 2026. Suppliers of palm-based CBE need traceable, deforestation-free sourcing, and shea and other non-palm fats gain relevance as buyers diversify.
Raw Material Supply Risk, Regulatory Limits and Cocoa Price Easing as Challenges for the Global Cocoa Butter Equivalent Market
Palm mid-fractions are available at scale, but shea, sal, illipe, kokum and mango kernel fats depend on seasonal collection in West Africa, India and Southeast Asia, so volumes and quality vary with weather and logistics. Climate change affects both cocoa and tropical fat crops, and palm oil sourcing faces scrutiny over deforestation. Chocolate makers must also manage consumer perception, as lower-cocoa recipes in some markets have led to products losing the word chocolate from their labels.
Price direction is a further variable. If cocoa and cocoa butter prices keep easing, the cost incentive to raise CBE inclusion weakens in markets with a fixed legal cap, although processors expect structural demand from compound and coating applications to continue. Cocoa-free and cultured-cocoa ingredients, such as the fava bean platform of Nukoko acquired by Döhler in June 2026, are an emerging competing route.
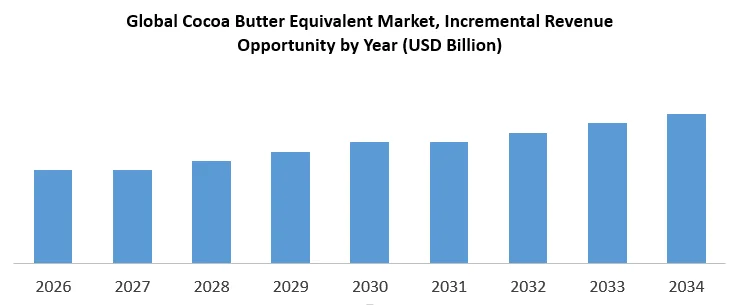
Incremental revenue in the Global Cocoa Butter Equivalent Market rises from USD 0.10 Billion in 2026 to USD 0.16 Billion in 2034. Over 2026-2034 the market adds USD 1.14 Billion, taking it from USD 1.62 Billion to USD 2.76 Billion. Each forecast year adds more revenue than the year before, as higher-inclusion formulations, new fractionation capacity and growth in compound coatings and bakery applications lift volumes.
Global Cocoa Butter Equivalent Market, CBE vs Cocoa Butter Replacer and Substitute Comparison
Cocoa butter equivalents, replacers and substitutes are often confused but differ in composition, compatibility with cocoa butter and regulatory treatment. The comparison below summarizes these differences and shows where CBE fits against natural cocoa butter and the other fat alternatives.
|
Product Type |
Source / |
Compatibility |
Typical Use |
Regulatory |
|
Natural Cocoa |
Fat pressed from cocoa beans; POP, POS and SOS |
Reference standard |
Chocolate, confectionery, premium products |
Required in chocolate; no limits |
|
CBE |
Non-lauric fats from palm mid-fraction, shea, sal, |
Compatible in all proportions; needs tempering |
Chocolate, coatings, fillings, bakery |
Up to 5% in EU chocolate; labeling required |
|
CBR |
Fractionated or hydrogenated non-lauric fats such as |
Partly compatible; limited blending |
Coatings and fillings |
Not permitted in chocolate in the EU; sold as coatings |
|
CBS |
Lauric fats such as palm kernel and coconut fractions |
Not compatible beyond small amounts; no tempering |
Compound coatings, wafers, ice cream coatings |
Not permitted in chocolate; compound products only |
MMR Analyst Insight: Price Gap and Inclusion Ceiling for the Global Cocoa Butter Equivalent Market
MMR views CBE demand as shaped by two variables. The first is the price gap between cocoa butter and CBE, which sets the incentive to substitute. The second is the legal inclusion ceiling, which sets how much substitution is allowed in products sold as chocolate. Where the ceiling is fixed, as in the EU, growth comes from higher chocolate output and from coatings, fillings and compound products that are not capped. Where cocoa prices stay high and ceilings are flexible, inclusion levels rise. Companies with secure palm fraction supply, technology to improve cocoa butter matching and certified sourcing are expected to capture the largest share of revenue growth through 2034, and the report tracks each profiled company against these factors.
Global Cocoa Butter Equivalent Market Segment Analysis
The Global Cocoa Butter Equivalent Market is segmented by source, application, product form, manufacturing technology, end-user industry, distribution channel and region. Each segment reflects different raw material availability, functional performance requirements, processing needs and buyer purchasing patterns.
Global Cocoa Butter Equivalent Market, By Source
Based on source, the market is segmented into palm oil fractions, shea butter, sal fat, illipe butter, kokum butter, mango kernel fat and other specialty vegetable fats.
Palm oil fractions are the leading source with a 44% share in 2025. Palm mid-fraction is rich in POP triglycerides, is available at scale and is easy to blend with shea stearin and other stearin sources, which supports consistent CBE grades. Shea butter is the second major source, valued for its stearin content, while sal, illipe, kokum and mango kernel fats supply POS and SOS triglycerides and support differentiated grades, although their supply is seasonal and concentrated in specific regions.
Global Cocoa Butter Equivalent Market, By Application
Based on application, the market is segmented into chocolate and confectionery, bakery products, chocolate coatings and fillings, dairy products and frozen desserts, cosmetics and personal care, and pharmaceuticals and other applications.
Chocolate and confectionery is the leading application with a 52% share in 2025, as manufacturers replace part of the cocoa butter to manage cost and supply. Bakery products and chocolate coatings and fillings add steady demand, while dairy products and frozen desserts use CBE in coatings and inclusions. Cosmetics, personal care and pharmaceuticals are smaller but profitable applications that draw on shea, mango kernel and kokum fats.
Global Cocoa Butter Equivalent Market, By Product Form
By product form, the market is segmented into blocks and slabs, chips and pellets, flakes, liquid, and granules and other solid forms.
Blocks and slabs account for the largest share, as cartons are the established way to supply chocolate makers and are easy to store and melt. Chips and pellets and flakes are preferred where faster melting and easier dosing matter, and liquid supply by tanker is expected to grow at a higher rate among large chocolate producers that want to avoid melting and handling steps.
Global Cocoa Butter Equivalent Market, By Manufacturing Technology
Based on manufacturing technology, the market is segmented into fractionation, blending, enzymatic interesterification, chemical interesterification, refining and modification, and other processing technologies.
Fractionation is the leading technology with a 38% share in 2025, because separating stearin and mid-fraction streams is the base step in producing cocoa butter-like fats. Blending adjusts the final composition, while enzymatic interesterification is expected to grow quickly as it allows precise triglyceride design and avoids chemical catalysts, mainly for grades outside the EU chocolate rule. Chemical interesterification and refining and modification remain important for grades used outside regulated chocolate categories.
Global Cocoa Butter Equivalent Market, By End-User Industry
By end-user industry, the market is segmented into chocolate manufacturers, confectionery manufacturers, bakery manufacturers, food ingredient manufacturers, cosmetics and personal care manufacturers, and pharmaceutical and other manufacturers.
Chocolate manufacturers are the largest end users, followed by confectionery and bakery manufacturers that use CBE in coatings, centers and fillings. Food ingredient manufacturers use CBE in compound products and blends for resale, and cosmetics and personal care manufacturers are expected to grow steadily as demand for plant-based butters rises.
Global Cocoa Butter Equivalent Market, By Distribution Channel
By distribution channel, the market is segmented into direct sales, specialty ingredient distributors, food ingredient distributors, industrial ingredient suppliers, online B2B platforms and other distribution channels.
Direct sales hold the largest share because large chocolate and confectionery companies buy through long-term supply agreements and technical collaboration with fat producers. Specialty and food ingredient distributors serve small and mid-sized manufacturers, and online B2B platforms are expected to grow fastest from a small base as buyers look for easier sourcing of standard grades.
Global Cocoa Butter Equivalent Market Regional Insights:
The Global Cocoa Butter Equivalent Market is segmented into North America, Europe, Asia Pacific, Middle East & Africa and South America. Europe holds the largest regional share at 37% in 2025, supported by the world’s main chocolate manufacturing base, the EU rule that permits up to 5% vegetable fats in chocolate, and the presence of major fat processors and chocolate groups in the Netherlands, Belgium, Germany, Switzerland, France, the United Kingdom, Italy, Spain and Poland. AAK, Fuji Oil Europe, Cargill and Bunge operate refining and specialty fat facilities in the region.
Asia Pacific is expected to be the fastest-growing region during 2026-2034, supported by palm fractionation in Malaysia, Indonesia and Singapore, rising chocolate, bakery and confectionery consumption in China, India, Japan and Southeast Asia, and plant investments such as the NURA joint venture of AAK and Kuala Lumpur Kepong in Johor, Malaysia. India also draws on sal and mango kernel fat resources. North America is a significant market in which CBE use is concentrated in coatings and compound products because the United States restricts vegetable fats in products sold as chocolate; Cargill and Bunge are major suppliers.
The Middle East & Africa is an emerging region, with Ghana, Côte d’Ivoire and Nigeria linked to cocoa and shea supply, and the United Arab Emirates, Saudi Arabia, South Africa and Türkiye offering growing confectionery and bakery demand. South America is advancing through Brazil’s large confectionery industry and expanding chocolate production in Argentina, Colombia and Chile, with CBE used mainly in coatings and bakery products.
Global Cocoa Butter Equivalent Market Competitive Landscape
The Global Cocoa Butter Equivalent Market is moderately consolidated, with large integrated edible oil and specialty fat processors, regional palm refiners and chocolate-focused ingredient suppliers competing on triglyceride consistency, technical support, supply security and sustainability. AAK AB, Cargill, Incorporated, Bunge Global SA, Fuji Oil Holdings Inc., Wilmar International Limited, Musim Mas Holdings, Mewah International Inc., 3F Industries Limited, Intercontinental Specialty Fats Sdn. Bhd., FGV Holdings Berhad and Kuala Lumpur Kepong Berhad are among the key companies shaping the competitive landscape. Europe and Asia Pacific host most large-scale fractionation and CBE capacity, and Asia Pacific producers hold a strong position in palm mid-fraction supply.
Backward integration, joint ventures, technology investment and product launches are becoming important strategies for strengthening competitive positioning. AAK and Kuala Lumpur Kepong formed the NURA joint venture in October 2025 to secure specialty palm fractions, and AAK said on 5 October 2026 that its dry fractionation technology will be commercialized there. AAK also launched ILLEXAO EN 10 on 28 May 2026 for enrobing at high CBE levels, secured GBP 2 million from Humber Freeport in September 2026 toward expanding its Hull refinery, and signed a development agreement with carbon-to-fat start-up Savor in July 2026.
Global Cocoa Butter Equivalent Market Recent Developments:
|
Date |
Development |
|
May 2026 |
The European Commission published a simplification |
|
May 2026 |
AAK launched ILLEXAO EN 10, a cocoa butter equivalent |
|
June 2026 |
Döhler acquired Nukoko, a company with a fava bean |
|
July 2026 |
AAK signed a two-year development agreement with |
|
September |
AAK secured GBP 2 million from Humber Freeport toward |
|
October 2026 |
AAK announced that its patented dry fractionation |
|
October 2026 |
Cocoa traded at USD 5,700 per metric ton after an |
Global Cocoa Butter Equivalent Market – Industry Analysis
The report presents a comprehensive analysis of the Global Cocoa Butter Equivalent Market, covering stakeholders across tropical fat cultivation and collection, extraction and refining, fractionation and interesterification, specialty fat manufacturing and the chocolate, confectionery, bakery, cosmetics and pharmaceutical industries. It evaluates the historical and current market scenario, industry developments, market size, production volume and the growth outlook through 2034.
The report assesses growth drivers, restraints, opportunities and challenges, and examines macroeconomic conditions, cocoa and palm oil price movements, raw material availability, manufacturing technology, production costs, regulation and labeling rules, trade flows and sustainability requirements.
It also reviews the competitive positioning of leading specialty fat manufacturers, palm refiners, ingredient suppliers and regional producers. Company analysis covers product portfolio, manufacturing technology, raw material sourcing strength, financial performance, capacity expansion, strategic partnerships and recent developments.
PORTER’s Five Forces, PESTLE and SWOT analyses are used to assess the competitive environment and the influence of macroeconomic, regulatory, technological and environmental factors. Regional assessments and country-level forecasts identify emerging opportunities and investment hotspots for fat producers, chocolate makers, ingredient distributors, investors and policy makers.
Global Cocoa Butter Equivalent Market Scope: Inquire before buying
|
Global Cocoa Butter Equivalent Market |
|||
|
Report Coverage |
Details |
||
|
Base Year: |
2025 |
Forecast Period: |
2026-2034 |
|
Historical Data: |
2020 to 2025 |
Market Size in 2025: |
USD 1.62 Billion |
|
Forecast Period 2026 to 2034 CAGR: |
6.10% |
Market Size in 2034: |
USD 2.76 Billion |
|
Segments |
By Source |
Palm Oil Fractions Sal Fat Illipe Butter Kokum Butter Mango Kernel Fat Other Specialty Vegetable Fats |
|
|
By Application |
Bakery Products Chocolate Coatings and Fillings Dairy Products and Frozen Desserts Cosmetics and Personal Care Pharmaceuticals and Other Applications |
||
|
By Product Form |
Blocks and Slabs Chips and Pellets Granules and Other Solid Forms |
||
|
By Manufacturing Technology |
Fractionation Blending Enzymatic Interesterification Chemical Interesterification Refining and Modification Other Processing Technologies |
||
|
By End-User Industry |
Chocolate Manufacturers Confectionery Manufacturers Bakery Manufacturers Food Ingredient Manufacturers Cosmetics and Personal Care Manufacturers Pharmaceutical and Other Manufacturers |
||
|
By Distribution Channel |
Direct Sales Specialty Ingredient Distributors Food Ingredient Distributors Industrial Ingredient Suppliers Online B2B Platforms Other Distribution Channels |
||
Global Cocoa Butter Equivalent Market , by Region
North America (United States, Canada and Mexico)
Europe (UK, France, Germany, Italy, Spain, Sweden, Austria and Rest of Europe)
Asia Pacific (China, South Korea, Japan, India, Australia, Indonesia, Malaysia, Vietnam, Taiwan, Bangladesh, Pakistan and Rest of APAC)
Middle East and Africa (South Africa, GCC, Egypt, Nigeria and Rest of ME&A)
South America (Brazil, Argentina, Rest of South America)
Global Cocoa Butter Equivalent (CBE) Market Key Players
A. North America – 3 Companies
1. Cargill, Incorporated (United States)
2. Bunge Global SA (United States)
3. AAK AB (North American Operations)
Others
B. Europe – 5 Companies
4. AAK AB (Sweden)
5. Bunge Global SA (Switzerland)
6. Fuji Oil Europe (Netherlands)
7. Cargill Cocoa & Chocolate (Netherlands)
8. Olenex (Switzerland)
Others
C. Asia Pacific – 10 Companies
9. Musim Mas Holdings (Singapore)
10. Wilmar International Limited (Singapore)
11. Fuji Oil Holdings Inc. (Japan)
12. Mewah International Inc. (Singapore)
13. 3F Industries Limited (India)
14. Intercontinental Specialty Fats Sdn. Bhd. (Malaysia)
15. FGV Holdings Berhad (Malaysia)
16. Kuala Lumpur Kepong Berhad (Malaysia)
17. IOI Corporation Berhad (Malaysia)
18. PT SMART Tbk (Indonesia)
Others
D. Middle East and Africa (MEA) – 4 Companies
19. Olam Group (Singapore / African Operations)
20. Ghana Nuts Company Limited (Ghana)
21. Fuji Oil Ghana Limited (Ghana)
22. AAK (West African Operations)
Others
E. South America – 5 Companies
23. Cargill Agrícola S.A. (Brazil)
24. Bunge Alimentos S.A. (Brazil)
25. Agropalma S.A. (Brazil)
26. Grupo Oleoplan (Brazil)
27. AAK (Regional Operations)
Others
Global Cocoa Butter Equivalent Market – Frequently Asked Questions:
1. Which region has the largest share in Global Cocoa Butter Equivalent Market?
Ans: Europe region held the highest share in 2025.
2. What is the growth rate of Global Cocoa Butter Equivalent Market?
Ans: The Global Cocoa Butter Equivalent Market is growing at a CAGR of 6.10% during forecasting period 2026-2034.
3. What is scope of the Global Cocoa Butter Equivalent Market report?
Ans: Global Cocoa Butter Equivalent Market report helps with the PESTEL, PORTER and SWOT analysis, Recommendations for Investors & Leaders, and market estimation of the forecast period.
4. Who are the key players in Global Cocoa Butter Equivalent Market?
Ans: The important key players in the Global Cocoa Butter Equivalent Market are – AAK AB, Cargill, Incorporated, Bunge Global SA, Fuji Oil Holdings Inc., Wilmar International Limited, Musim Mas Holdings, Mewah International Inc., 3F Industries Limited, Intercontinental Specialty Fats Sdn. Bhd., FGV Holdings Berhad, Kuala Lumpur Kepong Berhad, Olenex.
5. What is the study period of this Market?
Ans: The Global Cocoa Butter Equivalent Market is studied from 2020 to 2034.
6. What is a cocoa butter equivalent (CBE)?
Ans: A cocoa butter equivalent is a non-lauric vegetable fat, made from sources such as palm mid-fraction, shea, sal, illipe, kokum or mango kernel fat, that has a triglyceride profile close to cocoa butter and is compatible with it in all proportions. In the European Union it may replace up to 5% of the finished product in chocolate when declared on the label.