
CNG and LPG Vehicle Market – Global Market Size, Strategic Growth Drivers, Risk Assessment Framework, Regulatory Landscape Review, Competitive Intensity Mapping & Long-Term Industry Outlook to 2032
Overview
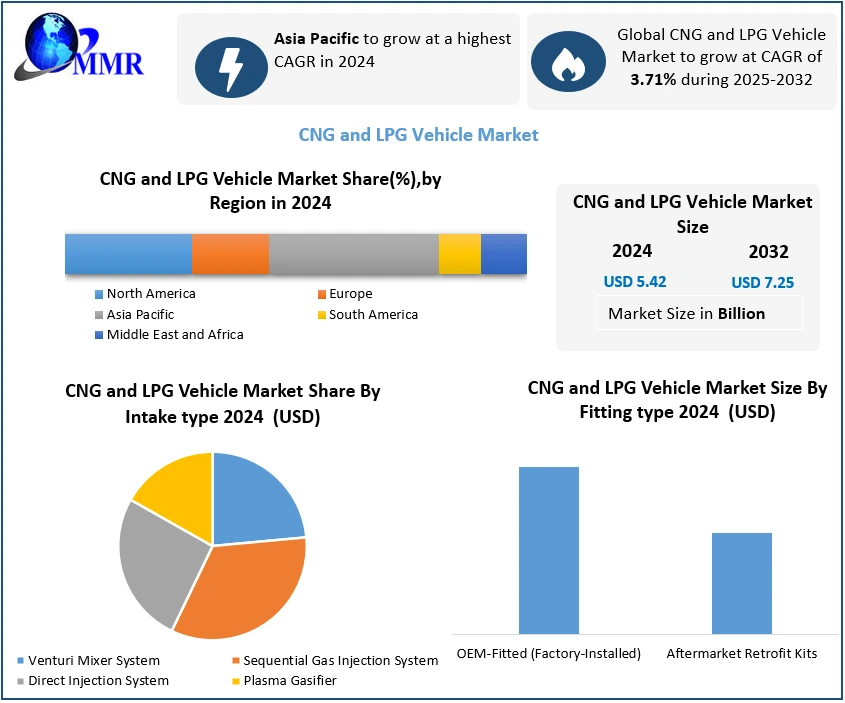
CNG and LPG Vehicle Market was valued at USD 5.42 Bn. in 2024 and the total Global CNG and LPG Vehicle Market revenue is Expected to grow at a CAGR of 3.71% from 2025 to 2032 reaching nearly USD 7.25 Bn. by 2032.
CNG and LPG Vehicle Market Overview
The CNG (Compressed Natural Gas) and LPG (Liquefied Petroleum Gas) vehicle market refers to the segment of the automotive industry that involves vehicles that utilize either compressed natural gas or liquefied petroleum gas as fuel instead of traditional gasoline or diesel. CNG is stored under high pressure in tanks onboard the vehicle. CNG vehicles are popular due to their lower emissions compared to gasoline or diesel vehicles and the relatively lower cost of natural gas compared to petroleum fuels. LPG vehicles, also known as propane vehicles, are equipped to run on liquefied petroleum gas, typically propane or butane. LPG is stored in a liquid state in tanks onboard the vehicle, and it is converted into vapor before being sent to the engine. LPG vehicles are chosen by some consumers due to their lower emissions and cost advantages compared to traditional gasoline vehicles.
 To know about the Research Methodology :- Request Free Sample Report
The CNG and LPG vehicle market encompasses various stakeholders, including automobile manufacturers producing dedicated CNG or LPG vehicles, conversion companies offering retrofitting services to convert conventional gasoline vehicles to CNG or LPG, fuelling station operators providing CNG and LPG refueling infrastructure, regulatory bodies setting emission standards and incentives, and consumers opting for alternative fuel vehicles for environmental or economic reasons. CNG and LPG Vehicles is not limited to a specific geographical region. The market has a global presence, with consumers across different continents showing interest in these supplements. This CNG and LPG Vehicle Market Report offers a specific and detailed market overview with statistical as well as pre-sized trendy data. This CNG and LPG Vehicle Market report showcases the CNG and LPG Vehicle market situation with Dynamics, Market Segment, Regional Analysis, and Top Competitor's Market Position.
CNG and LPG Vehicle Market Dynamics
Growing Environmental Awareness and Concerns Over Air Quality Have Led to Increased Interest in Alternative Fuel Vehicles like CNG and LPG Vehicles.
These vehicles produce lower emissions of harmful pollutants such as carbon dioxide (CO2), nitrogen oxides (NOx), and particulate matter compared to conventional gasoline and diesel vehicles, making them attractive options for individuals and businesses looking to reduce their carbon footprint and comply with stringent emission regulations. Government policies and regulations play a crucial role in shaping the CNG and LPG Vehicle Market. Many governments around the world offer incentives such as tax credits, subsidies, and rebates to promote the adoption of alternative fuel vehicles and build infrastructure for CNG and LPG refueling stations. Additionally, regulatory mandates such as emission standards and targets drive automakers to develop and offer CNG and LPG vehicle options in their product portfolios.
Advancements in technology have improved the efficiency, performance, and affordability of CNG and LPG vehicles. Innovations in engine design, fuel storage systems, and conversion technologies have made CNG and LPG vehicles more practical and accessible for consumers. These advancements have also contributed to increased driving range and reduced refueling times, addressing some of the concerns that previously hindered the widespread adoption of alternative fuel vehicles. Economic considerations such as fluctuating oil prices and the availability of natural gas resources influence consumer and fleet operator decisions regarding vehicle fuel choices. CNG and LPG vehicles offer cost savings potential over the long term, as natural gas prices tend to be more stable and lower than gasoline and diesel prices in many regions. Additionally, reduced maintenance costs and potential tax incentives further enhance the economic attractiveness of CNG and LPG vehicles, driving demand in the CNG and LPG Vehicle Market. Overall, these drivers collectively contribute to the growth and expansion of the CNG and LPG Vehicle Market worldwide.
Advanced maintenance cost and primary investment cost compared to petroleum vehicles
CNG and LPG Vehicles tend to be priced higher than regular petrol vehicles in the CNG and LPG Vehicle Market. This is due to the extra components added to these vehicles. As some parts of these vehicles get damaged faster compared to petrol vehicles due to lack of lubrication in most of these vehicles, these vehicles need much more regular maintenance over the years and thus cost more in the long term. Also, the parts need to be replaced from time to time compared to petrol vehicles which usually have a longer life for such parts. Thus, only people who drive a lot every month prefer using CNG and LPG vehicles. For instance, fleet providers may use CNG as they can drive a lot daily for their services. CNG and LPG Vehicles are cost-effective only when the vehicles are extensively driven.
Rising concerns of countries around the world for lower emission fuel vehicles.
The rising concerns for reducing emissions by countries all around the world may lead to an increase in the growth of low-emission fuel vehicles like CNG and LPG Vehicles in the CNG and LPG Vehicle Market. European countries have declared the ambition to reduce emissions in the coming decades and may be a major market for these vehicles in the coming years. Asian countries have already been supporting the growth of alternative fuel vehicles like CNG and LPG for a reduction in emissions and cost due to the import of petrol. As the present vehicles can be easily changed to CNG or LPG fuel systems and at an affordable price, we can expect explosive growth in the CNG and LPG Vehicle Market and aftermarket in the coming years. Improper Drainage causes cylinder damage CNG and LPG systems have various challenges that need to be addressed. With increasing technology, many such challenges have been mitigated. However, some key challenges still need to be addressed. One such problem is improper drainage which causes unnecessary cylinder damage. NPFA 52 requires the shield systems to be able to drain solids and liquids away from the cylinder. This means that holes are drilled at certain intervals. However, it has been discovered that many suppliers of kit services provide no allowance for drainage that is provided in the company-fitted systems.
CNG and LPG Vehicle Market Segment Analysis
Based on Fuel type the CNG and LPG Vehicle Market is segmented into Compressed Natural Gas (CNG) and LPG (Liquefied Petroleum Gas) Vehicles. Compressed Natural Gas (CNG) segment dominated the market in 2024 and the is expected to hold largest share during the forecast period with highest CAGR of 94.7% in 2025-2032 in the market owing to its cost-effectiveness and environmental friendliness relative to gasoline and diesel in the CNG and LPG Vehicle Market. CNG vehicles offer significant savings at the pump as natural gas is currently priced nearly 40-50% lower than an equivalent amount of gasoline. With fluctuating crude oil prices pushing petrol and diesel costs higher, consumers are increasingly attracted to CNG for its stable and affordable fuelling option. This factor has significantly boosted the adoption of new CNG vehicles as well as conversions of existing gasoline models.
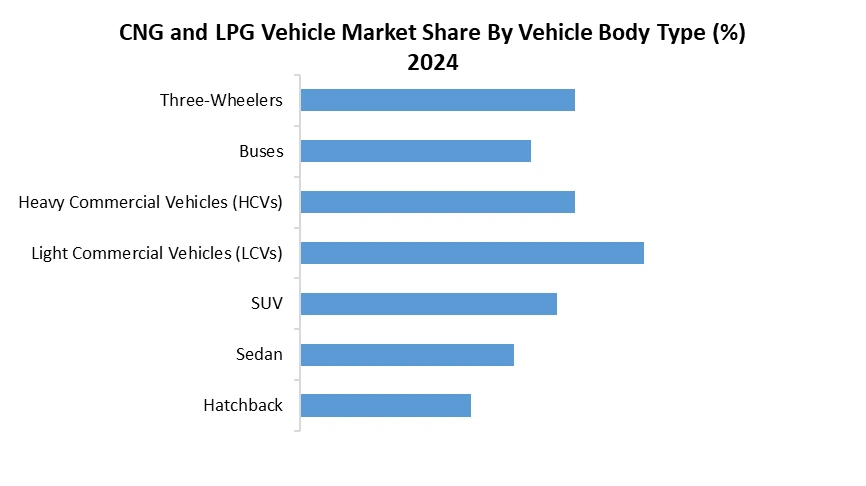
Based on Vehicle Body type the Market is segmented into Hatchback, Sedan, SUV, Light Commercial Vehicles (LCVs), Heavy Commercial Vehicles (HCVs), Buses, and Three-Wheelers. The Light Commercial Vehicles (LCVs)segment is estimated to held the highest share of 83% in 2024 in the CNG and LPG Vehicle Market. Changing consumer preferences toward family transportation underlines this segment's prominence. Rapid urbanization and improving economic conditions have boosted the sedan and Sports Utility Vehicles demand for commutes, school runs, and weekend getaways.
CNG and LPG Vehicle Market Regional Analysis
The global CNG and LPG Vehicle Market is analyzed and market size insights and trends are provided by countries, vehicle type, and fuel type as referenced above.
The countries covered in the global CNG and LPG vehicles market report are U.S., Canada, Mexico, Brazil, Argentina, Rest of South America, Germany, France, Italy, U.K., Belgium, Spain, Russia, Turkey, Netherlands, Switzerland, Rest of Europe, Japan, China, India, South Korea, Australia, Singapore, Malaysia, Thailand, Indonesia, Philippines, Rest of Asia-Pacific, U.A.E., Saudi Arabia, Egypt, South Africa, Israel, and Rest of Middle East and Africa.
Asia Pacific dominates the global CNG and LPG Vehicle Market, with India anticipated to boast the highest number of CNG vehicles globally. This dominance is attributed to elevated petrol and diesel prices, strict automotive emissions standards, widespread adoption of CNG in buses, taxis, and auto-rickshaws, a substantial presence of CNG/LPG retrofitting kits, prevalent conversion of old petrol and diesel vehicles to CNG/LPG, and a limited penetration of electric vehicles. CNG and LPG Vehicle Market growth is further propelled by rising demand for passenger cars, substantial investments from major original equipment manufacturers, and concurrent infrastructural advancements.
Europe is the fastest growing region in the global CNG and LPG Vehicle Market, due to the exploding population and high demand for clean fuel, and the European LNG fuelling network is still expanding as of now approx. 690 LNG and 4160 CNG fuelling stations in Europe.
The region section of the report also provides individual market-impacting factors and changes in regulation in the CNG and LPG Vehicle Market domestically that impact the current and future trends of the market. Data points like downstream and upstream value chain analysis, technical trends, and Porter’s five forces analysis, case studies are some of the pointers used to forecast the market scenario for individual countries. Also, the presence and availability of global brands and the challenges faced due to large or scarce competition from local and domestic brands, the impact of domestic tariffs, and trade routes are considered while providing forecast analysis of the region data.
CNG and LPG Vehicle Market Competitive Analysis
In May 2023, the European Council officially approved updated regulations mandating that only new 100% electric and hydrogen fuel cell vehicles can be sold in the European CNG and LPG Vehicle Market from 2035, both for individual and commercial use. The sale of petrol, diesel, E85, LPG, CNG, and various hybrids, including rechargeable ones, will be banned. This decision will notably impact a sector employing 12.5 million people in Europe, including around 400,000 direct jobs in France.
In March 2023, HAM Group inaugurated a new liquefied natural gas (LNG) and compressed natural gas (CNG) service station in Benavente, Zamora, located at Caada Berciana 9A. The strategic location near the A-6 (Northwest route), one of Spain's major radial highways, and the N-630, one of the country's longest national highways, enhances accessibility and convenience for customers.
In March 2022, Anhui Ankai Automobile Co. from China successfully shipped 800 CNG buses to Mexico as part of the Xinhua Silk Route Initiative, strengthening collaboration between China and Mexico. These buses are designated for public transportation services in the city of Monterrey.
In November 2022, Toyota Kirloskar Motor Pvt. Ltd., an India-based joint venture of Toyota Motor Corp., introduced the Compressed Natural Gas (CNG) variant of their high-end hatchback, the Toyota Glanza, to the Indian CNG and LPG Vehicle Market.
Scope of the Global CNG and LPG Vehicle Market: Inquire before buying
| Global CNG and LPG Vehicle Market | |||
|---|---|---|---|
| Report Coverage | Details | ||
| Base Year: | 2024 | Forecast Period: | 2025-2032 |
| Historical Data: | 2019 to 2024 | Market Size in 2024: | USD 5.42 Bn. |
| Forecast Period 2025 to 2032 CAGR: | 3.71% | Market Size in 2032: | USD 7.25 Bn. |
| Segments Covered: | by Fuel Type | CNG (Compressed Natural Gas) Vehicles LPG (Liquefied Petroleum Gas) Vehicles |
|
| by Vehicle Body Type | Hatchback Sedan SUV Light Commercial Vehicles (LCVs) Heavy Commercial Vehicles (HCVs) Buses Three-Wheelers |
||
| by Engine Type | Bi-Fuel Engines Mono-Fuel Engines |
||
| by Fitting Type | OEM-Fitted (Factory-Installed) Aftermarket Retrofit Kits |
||
| by Intake Type | Venturi Mixer System Sequential Gas Injection System Direct Injection System |
||
CNG and LPG Vehicle Market, by Region
North America (United States, Canada and Mexico)
Europe (UK, France, Germany, Italy, Spain, Sweden, Austria and Rest of Europe)
Asia Pacific (China, South Korea, Japan, India, Australia, Indonesia, Malaysia, Vietnam, Taiwan, and Rest of APAC)
Middle East and Africa (South Africa, GCC, Egypt, Nigeria and Rest of ME&A)
South America (Brazil, Argentina Rest of South America)
Leading CNG and LPG Vehicle Key Players Include
1. Hyundai Motor Group
2. Landi Renzo
3. Impco
4. General Motors
5. Ford Motor Company
6. Suzuki Motor Corporation
7. Venchurs
8. Westport
9. Fiat S.P.A
10. Volkswagen
11. Honda Motor Co
12. Tomasetoo Achile
13. Nissan
14. Tata
15. Groupe Renault
16. Navistar Inc.
17. AB Volvo
18. KION GROUP AG
19. AC S.A.
20. Landi Renzo S.p.a.
Frequently Asked Questions in the CNG and LPG Vehicles Market:
1. What are the main advantages of CNG and LPG vehicles over traditional gasoline vehicles?
Ans: Both CNG and LPG vehicles offer lower operating costs due to the generally lower price of natural gas compared to gasoline. Additionally, they produce fewer emissions, making them environmentally friendly options.
2. What advancements in technology are driving the growth of the CNG and LPG vehicle market?
Ans: Technological advancements in engine design, fuel storage systems, and conversion technologies are improving the efficiency, performance, and affordability of CNG and LPG vehicles.
3. Which region contributes notably towards the global CNG and LPG Vehicle Market?
Ans: Asia Pacific contributes notably towards the global CNG and LPG Vehicle Market.
4. What will be the expected CAGR of the CNG and LPG Vehicle Market during the forecast period (2025-2032)?
Ans: The global CNG and LPG Vehicle market is expected to grow at a CAGR of 3.71% during the forecast period.
5. What impact do fluctuating oil prices have on the CNG and LPG vehicle market?
Ans: Fluctuating oil prices can influence consumer decisions regarding vehicle fuel choices, with CNG and LPG vehicles offering cost savings potential over the long term due to the generally more stable and lower price of natural gas compared to gasoline.