
Clean Technology Market By Type, By Application, By End User, By Technology, By Sustainability Goal and Regional Insights 2034
Overview
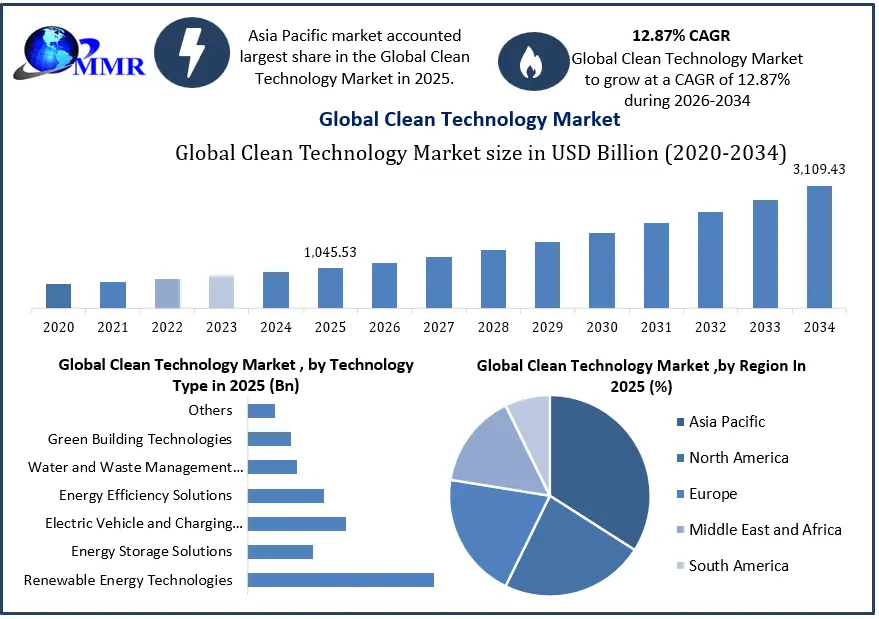
The Global Clean Technology Market was valued at USD 1,045.53 billion in 2025 and is expected to reach USD 3,109.43 billion by 2034, growing at a CAGR of 12.87% during 2026–2034. Market growth is supported by rising renewable energy deployment, electrification of transport, buildings and industry, power-grid modernization, industrial Decarbonisation, energy storage adoption and increasing investment in resource-efficient infrastructure.
Key Market Takeaways
• Renewable generation is increasingly procured alongside storage, grid equipment and software rather than as a stand-alone asset.
• Battery storage is moving into a broader set of grids and commercial and industrial use cases as power systems accommodate higher shares of variable renewable generation.
• Industrial buyers evaluate clean technologies against reliability, process integration, lifecycle cost and emissions performance, not only installed equipment price.
• Green hydrogen and carbon management are progressing through a project-development cycle in which bankable offtake, infrastructure and operating economics determine which projects advance.
• Water reuse, waste recovery and energy-efficient materials broaden the market beyond power generation and mobility.
• Asia Pacific plays a central role in clean-technology manufacturing and deployment, while regional opportunity depends on local grid readiness, financing, policy and resource conditions.
Clean Technology Market Growth and Share Analysis
To know about the Research Methodology :- Request Free Sample Report
Global Clean Technology Market Overview
Global Clean Technology Industry Definition
Clean technology includes products, equipment, processes and services that reduce energy and material consumption, emissions and pollution, improve resource recovery, and expand access to reliable and affordable energy. The report covers commercial clean technologies across renewable energy generation, stationary energy storage, smart grids and waste-to-energy, alongside carbon capture, green hydrogen, advanced materials and digital monitoring platforms.
Clean Technology Industry Ecosystem and Value Chain
The value chain spans component suppliers, technology developers, equipment manufacturers, project integrators, utilities and end users, with key participants varying across renewable energy, storage, smart grids, hydrogen and carbon capture.
| Value-chain layer | Representative activities and participants | Commercial considerations |
| Raw materials and components | Critical minerals, battery chemicals, specialty materials, semiconductors, power electronics, cells, membranes and catalysts | Input price volatility, processing concentration, traceability, recycling and supplier qualification. |
| Technology development | R&D, process design, patents, software architecture, pilot plants and technology licensing | Technology readiness, performance validation, intellectual property and scale-up risk. |
| Equipment manufacturing | Solar modules, wind turbines, battery systems, inverters, electrolysers, capture units, meters and treatment equipment | Manufacturing scale, yield, warranty exposure, quality control and product cost. |
| Project development and integration | Site development, permitting, EPC, grid connection, system integration and commissioning | Financing, project execution, interconnection, construction schedule and performance guarantees. |
| Asset operation and services | Operations, maintenance, monitoring, optimisation, recycling and lifecycle support | Uptime, utilisation, service coverage, operating cost and end-of-life obligations. |
| End-user adoption | Utilities, industrial facilities, commercial buildings, municipalities, transport operators and households | Payback, reliability, procurement rules, compliance, financing and customer acceptance. |
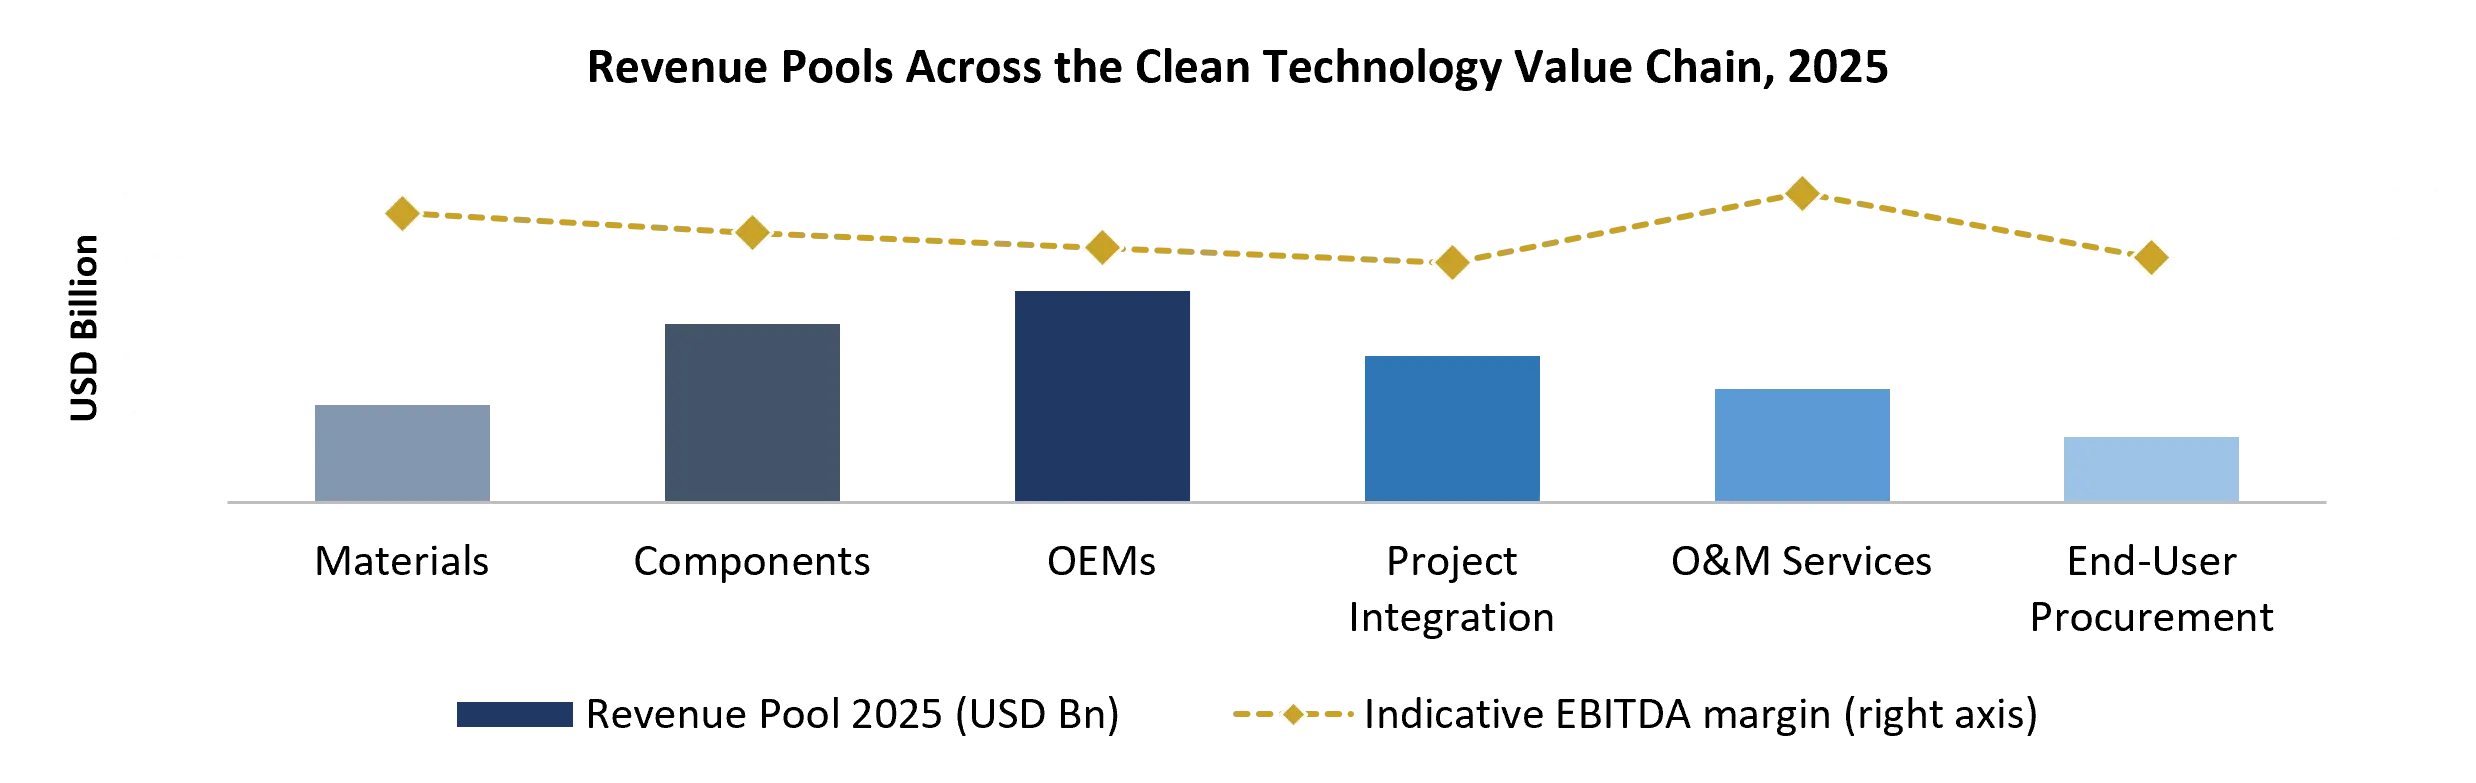
Clean Technology Value Chain and Revenue Pools.
| Materials › | Components › | OEMs › | Project Integration › | O&M Services › | End-User Procurement › |
| 12% of revenue pool | 22% of revenue pool | 26% of revenue pool | 18% of revenue pool | 14% of revenue pool | 8% of revenue pool |
 Global Clean Technology Market Dynamics
Global Clean Technology Market Drivers
Rising Renewable Energy Deployment and Grid Modernisation
Growing investments in solar energy, wind power and renewable energy systems are driving demand for clean technology solutions. Increasing renewable capacity is also creating opportunities for battery energy storage, smart grid technologies, transmission infrastructure and advanced energy management systems to improve grid flexibility and electricity reliability.
Growing Electrification Across Transport, Buildings and Industry
Electric vehicle adoption, building electrification and industrial electrification are increasing demand for EV charging infrastructure, energy storage solutions and power management systems. Businesses are also adopting energy-efficient technologies to reduce operating costs, improve resource efficiency and support industrial decarbonisation.
Global Clean Technology Market Restraints
Grid Infrastructure Constraints and Limited Readiness
Grid congestion, limited transmission capacity and lengthy interconnection approvals can delay renewable energy deployment and clean energy projects. These infrastructure constraints increase project costs and restrict the integration of renewable power, affecting the wider adoption of clean technology solutions.
Global Clean Technology Market Opportunities
Growing Demand for Grid-Scale and Long-Duration Energy Storage
Increasing renewable energy integration is creating demand for grid-scale battery storage and long-duration energy storage solutions. Lithium-ion batteries, flow batteries, thermal energy storage, and pumped hydro offer opportunities for peak-demand management, electricity balancing, and improved grid reliability.
Green Hydrogen for Industrial Decarbonisation
Green hydrogen production offers opportunities in chemicals, refining, iron and steel, and other hard-to-abate industries. Demand for green hydrogen technology will depend on renewable electricity costs, electrolyser efficiency, hydrogen storage infrastructure and long-term industrial offtake agreements.
Emerging Technology Commercialization Pathway
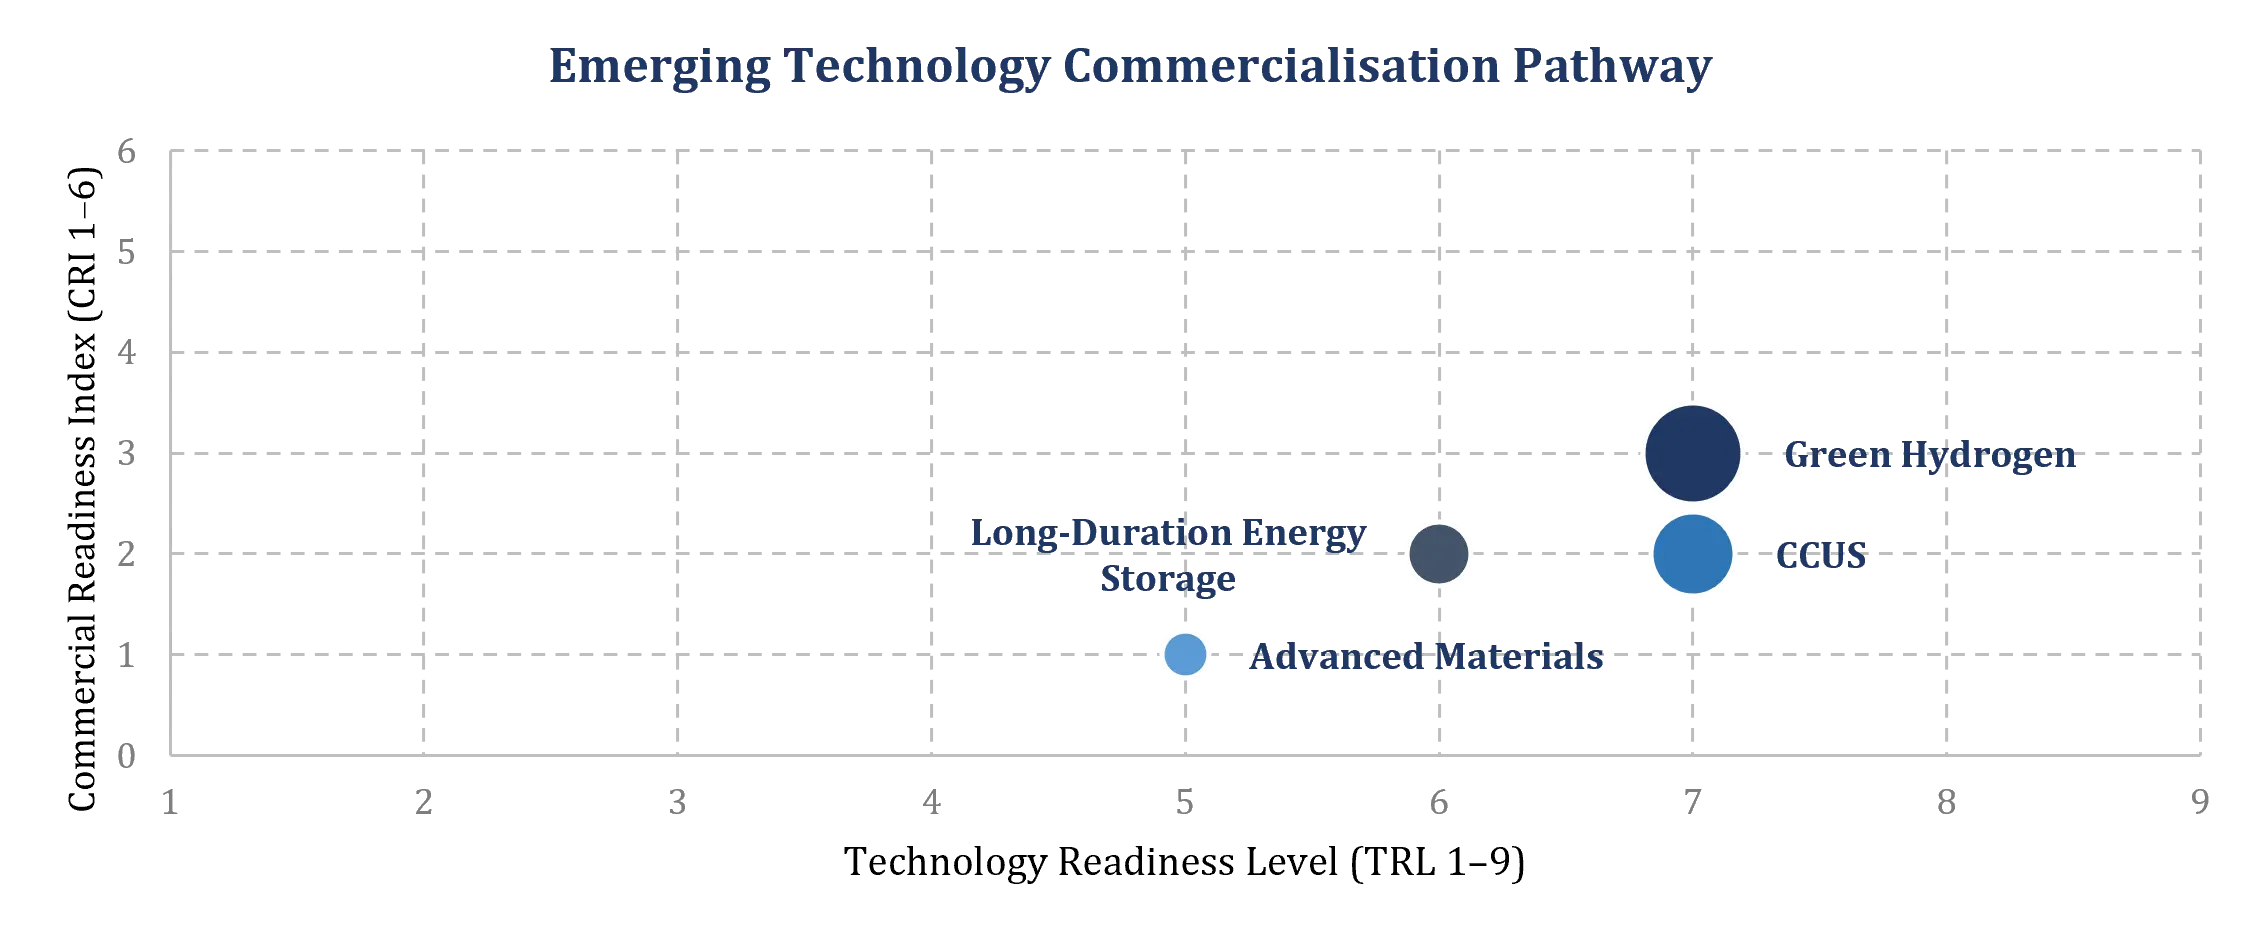 Bubble size = indicative investment pipeline (USD Bn). TRL = Technology Readiness Level; CRI = Commercial Readiness Index.
Global Clean Technology Market Challenges
Technology Integration and Interoperability
Integrating renewable energy systems, battery energy storage, and smart grid technologies from multiple suppliers can create compatibility and operational challenges. Software integration, communication standards and grid-code requirements remain important for reliable system performance and clean energy infrastructure development.
Permitting, Land Availability and Community Acceptance
Renewable energy projects, transmission infrastructure and waste-to-energy facilities require land, regulatory approvals and community support. Environmental assessments, land-use restrictions and local opposition can delay project execution and increase clean technology project costs.
Global Clean Technology Market Trends
| Trend | Technology and market development | Commercial implication |
| Integrated renewable-plus-storage projects | Solar and wind projects are increasingly evaluated with storage, power conversion, forecasting and grid services. | Suppliers compete on system-level output, dispatchability, project execution and lifecycle economics. |
| Battery chemistry diversification | LFP remains widely deployed in stationary storage, while sodium-ion and other chemistries are being developed for specific cost, safety and supply-chain requirements. | Procurement decisions increasingly compare cycle life, safety, thermal management, warranty and total cost per delivered MWh. |
| Grid digitalisation | Smart meters, advanced distribution management, digital substations, demand response and distributed energy resource management are expanding. | Software, connectivity, cybersecurity and interoperability become part of the value proposition. |
| Industrial electrification and heat efficiency | Heat pumps, electric boilers, efficient motors, drives, thermal storage and process controls support lower energy intensity. | Industrial suppliers must demonstrate integration with production processes and measurable operating savings. |
| Hydrogen project selectivity | Project pipelines are being filtered by offtake commitments, renewable power access, infrastructure and project economics. | Developers with secured customers and credible delivery plans are better positioned to advance projects. |
The MMR reported that global battery storage additions reached 108 GW in 2025, around 40% above 2024, while LFP accounted for approximately 90% of deployments. The figures point to the scale of the stationary storage market and the importance of chemistry, safety, and system integration in purchasing decisions.
Global Clean Technology Market Segment Analysis
| Segment Category | Sub-Segments | Key Insights |
| By Type | Renewable Energy Systems; Energy Storage Solutions; Smart Grid Technologies; Waste-to-Energy Processes | The type segment covers technologies supporting clean energy generation, electricity storage, grid efficiency, and energy recovery. Renewable Energy Systems benefit from investments in low-carbon power generation, while Energy Storage Solutions support supply-demand balancing and renewable integration. Smart Grid Technologies are gaining importance as electricity networks accommodate distributed generation and rising demand. Waste-to-Energy Processes contribute to resource recovery and alternative energy generation through suitable waste streams. |
| By Application | Residential; Commercial; Industrial; Transportation; Others | Industrial applications represent an important demand area due to high energy consumption, resource requirements and decarbonisation pressures across manufacturing and processing activities. Residential and commercial adoption is supported by distributed energy systems, building efficiency and lower operating costs. Transportation demand is linked to vehicle electrification and charging infrastructure, while other applications include qualifying public and community infrastructure projects. |
| By End User | Municipalities; Private Enterprises; Individual Consumers | Municipalities play an important role in clean-technology deployment through investments in public infrastructure, waste management, water treatment, renewable energy and smart-grid projects. Private enterprises adopt these solutions to improve operational efficiency, manage energy costs and meet environmental commitments. Individual consumers contribute through residential solar installations, home energy storage, efficient appliances and electric vehicle charging solutions. |
| By Technology | Carbon Capture and Utilisation / Storage (CCU/CCUS); Green Hydrogen Production; Advanced Materials for Energy Efficiency; Digital Monitoring Platforms | The technology segment covers solutions that enable emissions management, alternative fuel production, improved material performance and digital optimisation. Carbon capture technologies address emissions from industrial processes, while green hydrogen offers potential for selected hard-to-abate applications. Advanced materials support energy efficiency across equipment and infrastructure, and digital monitoring platforms improve system visibility, performance management and operational control. |
| By Sustainability Goal | Climate Mitigation; Resource Efficiency; Energy Access; Circular Economy; Others | Climate Mitigation is a central objective, with demand supported by efforts to reduce greenhouse-gas emissions across power generation, industry and transportation. Resource Efficiency focuses on reducing energy, water and material consumption, while Energy Access addresses the availability and reliability of electricity in underserved areas. Circular Economy initiatives encourage waste reduction, material recovery and reuse, with other sustainability objectives covering additional environmental and resource-related priorities. |
Global Clean Technology Market Regional Analysis:
The Global Clean Technology Market exhibits varied growth opportunities across regions, shaped by government policies, renewable energy potential, industrial development, infrastructure readiness and investment priorities. While established markets focus on grid modernisation, energy storage and industrial decarbonisation, emerging markets are creating opportunities through renewable energy deployment, distributed power systems, water treatment and resource-efficiency solutions.
North America: The North America Clean Technology Market is supported by established investment capabilities, renewable energy procurement, grid modernisation and increasing demand for energy storage solutions. Key opportunities include grid-scale battery storage, industrial electrification, carbon management, power electronics and digital energy management systems. However, grid interconnection delays, transmission infrastructure requirements, equipment lead times and permitting processes influence project deployment.
Europe: The European Clean Technology Market is driven by decarbonisation targets, energy security priorities and industrial competitiveness. Offshore wind, solar energy, energy storage, heat pumps and building energy-efficiency solutions represent important investment areas. Green hydrogen and carbon-management infrastructure are also gaining attention, particularly around industrial clusters and ports. Project development, however, remains influenced by permitting timelines, grid capacity, financing conditions and infrastructure readiness.
Asia Pacific: The Asia Pacific Clean Technology Market benefits from strong manufacturing capabilities, rising electricity demand and expanding industrial investment. China plays a significant role in solar PV modules, battery manufacturing and power electronics, while India, Japan, South Korea, Australia and Southeast Asian countries offer opportunities across renewable energy, battery storage, smart grids and industrial electrification. Regional growth varies according to grid readiness, financing availability, domestic manufacturing policies and electricity-market structures.
Middle East & Africa: The Middle East and Africa Clean Technology Market presents opportunities in utility-scale solar, battery energy storage, water treatment, desalination and green hydrogen development. Gulf countries are investing in clean energy as part of economic diversification and industrial development, while African markets offer potential for distributed renewable energy, mini-grids and energy-access solutions. Project bankability, financing availability, currency exposure, offtake certainty, and grid connectivity remain important considerations.
South America: The South America Clean Technology Market is supported by abundant renewable energy resources, hydropower generation and demand from mining, agriculture, chemicals and manufacturing industries. Solar and wind energy, energy storage, bioenergy, industrial electrification, water treatment and resource recovery represent key opportunities. Green hydrogen projects may also emerge around export-oriented industrial clusters. However, investment and deployment are influenced by financing costs, currency fluctuations, transmission infrastructure, permitting, and regulatory stability.
Technology, Operations and Sustainability Assessment
Renewable Generation and System Integration
Solar PV and wind technologies have moved into large-scale commercial deployment, but project performance depends on more than module or turbine efficiency. Site resources, land, grid access, equipment quality, power conversion, forecasting, curtailment, and operations all affect delivered electricity cost. Hybrid projects combining solar, wind and storage can improve output profiles and make better use of grid connections, although the optimal configuration depends on local market conditions.
Green Hydrogen Production
Green hydrogen production uses renewable electricity to split water through electrolysis. Alkaline, proton-exchange membrane, anion-exchange membrane and solid-oxide technologies have different operating characteristics, material requirements, efficiency profiles and maturity levels. The project case depends on renewable electricity cost and availability, electrolyser utilisation, water treatment, compression, storage, transport and a credible buyer. Hydrogen should not be described as green solely because it is produced by electrolysis; the electricity source and emissions boundary are central to classification.
Investment Prioritization
Clean technology investment decisions depend on technology readiness, resource suitability, confirmed demand, financing availability, project execution capabilities and lifecycle performance. These factors help assess commercial viability, operational risks and long-term returns.
Regulatory Landscape and Policy Framework
Policy frameworks influence technology demand through renewable-energy targets, emissions standards, tax credits, auctions, carbon pricing, building codes, vehicle regulations, grid rules, waste directives and public procurement. Regulation can create a market by setting performance requirements or by reducing project costs, but policy changes can also alter investment timing and supply-chain economics.
| Policy area | Market relevance | Business response |
| Renewable energy and power markets | Auctions, renewable portfolio standards, grid access rules and power-market reform influence generation deployment. | Track auction design, contract terms, interconnection rules and curtailment exposure. |
| Energy efficiency and buildings | Minimum performance standards, building codes, retrofit programmes and appliance standards support efficient products. | Align product specifications with local standards and document lifecycle savings. |
| Transport electrification | Vehicle-emission standards, purchase incentives, charging rules and fleet mandates influence EV and charging demand. | Build charging access, interoperability, safety and after-sales support into deployment plans. |
Strategic Opportunity and Risk Assessment
Opportunity Matrix
| Opportunity area | Demand trigger | Commercial opportunity | Key condition for scale |
| Renewables plus storage | Higher renewable penetration and demand for flexible power | Hybrid projects, BESS, inverters, controls and lifecycle services | Grid access, dispatch value and bankable revenue stack. |
| Industrial energy efficiency | Energy-cost exposure, emissions targets and productivity improvement | Motors, drives, heat pumps, process controls, insulation and monitoring | Verified savings and integration without disrupting production. |
| Green hydrogen | Industrial demand for low-emissions feedstock and fuels | Electrolysers, water systems, compression, storage and project integration | Competitive renewable power and secured offtake. |
Risk Matrix
| Risk category | Early warning indicators | Potential impact | Management response |
| Policy and regulatory | Incentive revisions, delayed permits, changing certification rules | Project delay, revised returns or loss of eligibility | Scenario analysis, regulatory monitoring and flexible project design. |
| Technology and performance | Pilot underperformance, warranty claims, component failures | Lower output, higher O&M cost and customer dissatisfaction | Independent validation, performance guarantees and staged deployment. |
| Supply chain | Long lead times, supplier concentration, critical-material price spikes | Cost escalation and schedule slippage | Dual sourcing, inventory planning, recycling and supplier audits. |
| Commercial and offtake | Uncontracted output, buyer credit deterioration, price volatility | Revenue shortfall and financing stress | Secure offtake, credit support and downside-case modelling. |
Competitive Landscape and Key Market Participants
Competition in the clean technology market varies across technology segments, with companies differentiated by efficiency, cost, reliability, system integration, project execution and lifecycle performance. The companies listed below participate in one or more covered technology areas; their inclusion does not imply direct competition across all segments or represent a market-share ranking.
Competitive Positioning by Technology
| Technology area | Representative companies | Basis of competition |
| Renewable energy systems | First Solar; JinkoSolar; LONGi; Canadian Solar; Trina Solar; Vestas; Siemens Gamesa; GE Vernova; Ørsted; NextEra Energy; Iberdrola; Enel; Adani Green Energy; ReNew | Module and turbine performance, cost, manufacturing scale, project pipeline, resource quality and operations. |
| Energy storage solutions | CATL; BYD; LG Energy Solution; Samsung SDI; Panasonic; Fluence; Sungrow; Wärtsilä; Tesla | Cell chemistry, system safety, cycle life, integration, warranty, software and project execution. |
| Smart grid technologies | Siemens; Schneider Electric; ABB; Hitachi Energy; Eaton; Itron; Landis+Gyr; Mitsubishi Electric; Honeywell; Rockwell Automation | Network reliability, interoperability, automation, cybersecurity, analytics and service coverage. |
| Waste-to-energy processes | Veolia; SUEZ; Kanadevia; China Everbright Environment; JFE Engineering; Babcock & Wilcox; Reworld Environmental | Feedstock flexibility, emissions control, energy recovery, plant availability and operating contracts. |
| Green hydrogen and fuel cells | Nel; ITM Power; thyssenkrupp nucera; Plug Power; Enapter; John Cockerill; Bloom Energy; Ballard Power Systems | Electrolyser efficiency, system cost, durability, project references, service and offtake ecosystem. |
Key Market Participants
| Company | Company |
| 1. Tesla, Inc. | 2. BYD Company Limited |
| 3. Siemens Energy AG | 4. Schneider Electric SE |
| 5. ABB Ltd. | 6. GE Vernova Inc. |
| 7. Vestas Wind Systems A/S | 8. First Solar, Inc. |
| 9. NextEra Energy, Inc. | 10. Ørsted A/S |
| 11. Enphase Energy, Inc. | 12. SolarEdge Technologies, Inc. |
| 13. Canadian Solar Inc. | 14. JinkoSolar Holding Co., Ltd. |
| 15. LONGi Green Energy Technology Co., Ltd. | 16. Trina Solar Co., Ltd. |
| 17. Sungrow Power Supply Co., Ltd. | 18. CATL (Contemporary Amperex Technology Co., Limited) |
| 19. LG Energy Solution Ltd. | 20. Panasonic Holdings Corporation |
| 21. Samsung SDI Co., Ltd. | 22. Fluence Energy, Inc. |
| 23. Wärtsilä Corporation | 24. Bloom Energy Corporation |
| 25. Plug Power Inc. | 26. Ballard Power Systems Inc. |
| 27. Nel ASA | 28. ITM Power plc |
| 29. Johnson Controls International plc | 30. Honeywell International Inc. |
| 31. Eaton Corporation plc | 32. Rockwell Automation, Inc. |
| 33. Mitsubishi Electric Corporation | 34. Hitachi, Ltd. |
| 35. Daikin Industries, Ltd. | 36. Veolia Environnement S.A. |
| 37. Xylem Inc. | 38. Ecolab Inc. |
| 39. SUEZ S.A. | 40. Waste Management, Inc. |
| 41. Republic Services, Inc. | 42. Reworld Environmental |
| 43. Saint-Gobain S.A. | 44. Kingspan Group plc |
| 45. ROCKWOOL A/S | 46. Enel S.p.A. |
| 47. Iberdrola, S.A. | 48. ENGIE S.A. |
| 49. Adani Green Energy Limited | 50. ReNew Energy Global plc |
| 51. Kanadevia Corporation | 52. China Everbright Environment Group Limited |
| 53. JFE Engineering Corporation | 54. Babcock & Wilcox Enterprises, Inc. |
| 55. thyssenkrupp nucera AG & Co. KGaA | 56. Enapter AG |
| 57. John Cockerill | 58. Carbon Clean |
| 59. Climeworks AG | 60. LanzaTech, Inc. |
| 61. Itron, Inc. | 62. Landis+Gyr Group AG |
| 63. Aspen Aerogels, Inc. | 64. Owens Corning |
Clean Technology Market Scope and Research Coverage:Inquire before buying
| Coverage parameter | Definition/coverage |
|---|---|
| Market | Global Clean Technology Market |
| Base year | 2025 |
| Historical Period | 2020–2025 |
| Forecast Period | 2026–2034 |
| 2025 market size | USD 1,045.53 Billion |
| 2034 market forecast | USD 3,109.43 Billion |
| CAGR | 12.87% during 2026–2034 |
| By Type | Renewable Energy Systems Energy Storage Solutions Smart Grid Technologies Waste-to-Energy Processes |
| By Application | Residential Commercial Industrial Transportation Others |
| By End User | Municipalities Private Enterprises Individual Consumers |
| By Technology | Carbon Capture and Utilisation / Storage Green Hydrogen Production Advanced Materials for Energy Efficiency Digital Monitoring Platforms |
| By Sustainability Goal | Climate Mitigation Resource Efficiency Energy Access Circular Economy Others |
| Regions | North America Europe Asia Pacific Middle East & Africa South America |
Frequently Asked Questions
What is the Global Clean Technology Market size?
The market is estimated at USD 1,045.53 billion in 2025.
What is the forecast value of the market by 2034?
The market is projected to reach USD 3,109.43 billion by 2034.
What is the expected CAGR?
The market is projected to grow at a CAGR of 12.87% during 2026–2034.
What are the key growth drivers?
Key growth drivers include increasing renewable energy investments, rising demand for energy storage solutions, grid modernisation, expanding electric vehicle adoption, and growing industrial focus on energy efficiency and decarbonisation.
Which region dominates the market?
Asia Pacific is a major market for clean technology, supported by large-scale renewable energy deployment, strong manufacturing capabilities, rising electricity demand, and increasing investments in clean energy infrastructure.
What are the emerging trends?
Emerging trends include wider integration of solar and wind power with battery energy storage, adoption of smart grid technologies, development of long-duration energy storage solutions, growing interest in green hydrogen production, and increasing use of digital platforms for energy monitoring and optimisation.