
Carbonated Soft Drinks Market by Flavour, Packaging Type, Distribution Channel, and Region – Global Market Size Estimation, Industry‑Wide Analysis, Competitive Landscape Assessment & Long‑Term Forecast to 2032
Overview
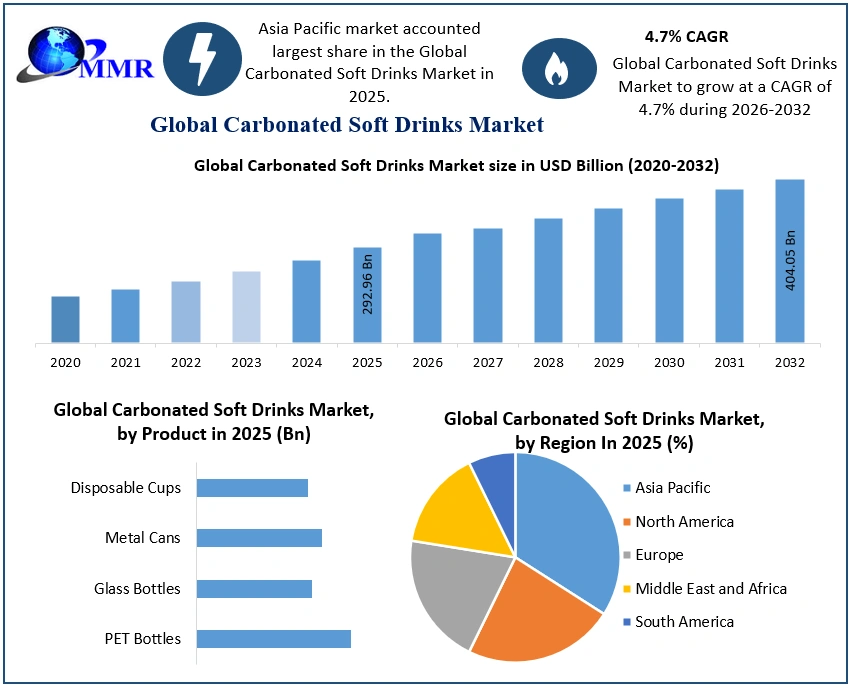
The Carbonated Soft Drinks Market size was valued at USD 292.96 Bn in 2025 and the total Carbonated Soft Drinks revenue is expected to grow at a CAGR of 4.7% from 2025 to 2032, reaching nearly USD 404.05 Bn by 2032.
Carbonated Soft Drinks Market Overview:
The global Carbonated Soft Drinks Market is undergoing structural change as governments sugar regulations and consumers shift toward healthier formulations. More than 130 countries and jurisdictions have now implemented sugar-sweetened beverage (SSB) taxes, with rates ranging from 1 to 3 cents per ounce in the United States and up to 20–30% excise duties in regions such as the Middle East. Health authorities highlight the urgency: the WHO reports that excessive sugar intake contributes to over 340,000 global deaths annually linked to sugary drinks. In the U.S., carbonated beverages still account for nearly 37% of soft-drink sales volume, reflecting strong baseline demand despite health concerns. These factors are pushing brands to accelerate zero-sugar innovation, flavor diversification, and packaging sustainability.
Consumer behavior continues to evolve rapidly. The 65% of consumers prefer beverages with reduced sugar, while the share of shoppers choosing zero-calorie sodas has increased by 8 percentage points since 2020. Governments are targeting packaging sustainability: the EU requires 90% plastic bottle collection by 2029, while leading North American beverage companies have integrated 25–30% recycled PET into their carbonated soft-drink bottles in Carbonated Soft Drinks Market. Meanwhile, per-capita consumption remains highly uneven countries like Mexico exceed 500 liters per capita annually, whereas many Asian Carbonated Soft Drinks Market consume below 70 liters, signaling large untapped growth potential. These structural shifts in regulation, health awareness, and environmental standards are reshaping product strategy and long-term market direction.
 To know about the Research Methodology :- Request Free Sample Report
Carbonated Soft Drinks Market Dynamics:
Carbonated Soft Drinks Market Demand Dynamics & Key Drivers Boosting Soft Drinks Market Size
The Carbonated Soft Drinks Market is structurally strong despite all the noise around sugar and regulation, and the numbers. Globally, consumers drink around 1.9 billion servings of soft drinks every day, and soft drinks account for about 76% of the total non-alcoholic beverage market, so the effective Soft Drinks Market Size inside beverages is dominant. In Mexico, per-capita soft drink intake exceeds 500 liters per person per year, while Belgium is above 270 liters, underlining deeply embedded carbonation is in daily life. At the same time, the Carbonated Drinks in Asia-Pacific are the real volume engine: Asia–Pacific held more than 40% of the global soft drinks market, while North America accounts for roughly one-third of the Carbonated Beverages Market, giving it a 32%+ share in some recent estimates. These structural demand bases underpin the positive Global Soft Drinks Market Forecast, even as category mix shifts toward healthier and premium formats.
The consumers who prefer sugar-free soft drinks increased by 8 percentage points between 2020 and 2022, and over 65% of beverage companies report plans to launch more low-sugar or sugar-free SKUs by 2025. This supports the expansion of the Low-calorie Soft Drinks Market and the Sugar-free Beverages Market, especially via cola and citrus variants. Zero-sugar and low-sugar beverages are recording double-digit year-on-year growth for players like Coca-Cola and PepsiCo across both developed and developing countries, giving tangible momentum to Diet Cola Market Growth as reformulated Coke Zero and Pepsi Zero capture share from full-sugar lines. At the same time, the Fruit-flavored Carbonates Market is benefiting from demand for exotic and tropical flavors and for “natural” positioning, helping offset volume pressure in classic cola. PET bottles accounting for about 67% of all beverage packaging across water, carbonated soft drinks, energy drinks, tea, and coffee. Within that, PET Bottles Soft Drinks Packaging is becoming more circular; around 30% of PET bottles used in soft drink containers contained recycled PET in 2022, and 72% of soft drink cans were made from recycled aluminum, both meaningful improvements in the environmental profile of the category. These shifts align with emerging Carbonated Soft Drinks Market and reduce regulatory and reputational risk around plastic.
Key Restraints Slowing Soft Drinks Market Growth Amid Health & Regulatory Pressures
Traditional sugared carbonates are closely linked to non-communicable diseases. In 2022 alone, sugar-sweetened beverages were associated globally with 2.2 million cases of type 2 diabetes, 1.2 million cardiovascular disease cases, and 340,000 deaths, underscoring why policymakers target this category so aggressively. On the regulatory front, more than 130 jurisdictions across nearly 120 countries and territories have implemented taxes on sugar-sweetened beverages; the WHO explicitly recommends these taxes as a “win-win-win” for public health, government revenue and equity. These measures pressure the sugared side of the Standard Cola Market Share and the higher-sugar parts of the Fruit-flavored Carbonates Market, especially in Europe and Latin America in Carbonated Soft Drinks Market.
In the Europe Carbonated Beverages Market, health-driven behavior sales of sugary soft drinks have fallen by about 15% over the last decade, and sales of high-sugar options declined 10% in just the last two years as awareness of sugar content has increased. The bottled water’s share of the non-alcoholic beverage segment surpassed soft drinks, reaching around 41% of category volume, signalling a structural headwind for legacy sugar-heavy carbonates, especially in economies and among older consumers. Environmental pressure compounds this: some bottlers still use up to 2.5 liters of water to produce one liter of finished beverage, putting water-intensive plants under scrutiny in water-stressed regions. These numbers explain pure volume growth in traditional carbonates is flattening in parts of the North America Carbonated Soft Drinks Market and Western Europe, even as mix and pricing improve.
Emerging Opportunities Driving Future Growth in the Carbonated Soft Drinks Market
The increasing preference for sugar-free options, up 8 percentage points from 2020 to 2022, and the strong corporate pipeline in low-sugar launches (with two-thirds of beverage companies planning additional offerings) mean the Low-calorie Soft Drinks Market and Sugar-free Beverages Market are becoming core growth engines than peripheral niches. This supports continued Diet Cola Market Growth as zero-sugar colas approach parity in taste with originals, while also enabling expansion into flavored zero-calorie segments at the intersection of the Fruit-flavored Carbonated Soft Drinks Market and functional beverages. Emerging regions add another numerical upside lever: Africa has much lower per-capita soft drink consumption than other continents, but its urban soft drink intake is “rapidly increasing”, and Asia Pacific commands over 40% of global soft drink volumes, giving the Carbonated Drinks in Asia-Pacific a role in future volume growth. As incomes rise and modern trade penetration deepens, even modest increases in per-capita consumption across populous countries can translate into billions of additional servings annually. The sustainability metrics around packaging 30% recycled PET in soft drink bottles globally and 72% recycled content in cans show that brands are starting from a meaningful base and can push toward closed-loop PET Bottles Soft Drinks Packaging systems and refill/return schemes.
Carbonated Soft Drinks Market Segment Analysis:
Based on Product Type, the Carbonated Soft Drinks Market is segmented into Standard Cola, Diet Cola / Zero-Calorie Cola, Fruit-Flavored Carbonates, and Other. Carbonated Beverages (Ginger Ale, Tonic Water, Cream Soda, and Root Beer). The Standard Cola segment dominated the Carbonated Soft Drinks Market in 2024 and is projected to maintain its lead throughout the forecast period. Globally, Carbonated Soft Drinks Market, accounted for over 41–45% of total carbonated drink consumption. It is estimated that more than 65 billion liters of cola beverages are consumed annually across retail and foodservice channels. The enduring popularity of cola is reinforced by strong brand loyalty, particularly toward iconic brands such as Coca-Cola and Pepsi, which together influence a significant share of category revenues worldwide. In high-consumption markets such as Mexico and the United States, cola beverages form the largest component of per-capita soft drink intake reaching 500+ liters per person annually in Mexico underscoring the deep cultural attachment to cola as an everyday beverage.
Based on Packaging Type, the Carbonated Soft Drinks Market is divided into PET Bottles, Glass Bottles, Metal Cans, and Disposable Cups. The PET Bottles segment accounted for the largest share in 2024 and is projected to retain dominance across the forecast period. PET packaging represents 55–60% of total carbonated soft drink packaging worldwide, driven by its lightweight nature, affordability, durability, and convenience for on-the-go and family-size consumption. Globally, PET-bottled beverages exceed hundreds of billions of units annually, supported by extensive penetration in emerging markets where bulk buying and price sensitivity shape purchasing behavior. PET Bottles are also evolving toward sustainability, with 30% of PET used in soft drink bottles now made from recycled PET (rPET). Major beverage companies are investing heavily in achieving 100% rPET usage, aligning with global sustainability commitments.
Glass Bottles remain a strong and fast-growing premium packaging category, particularly valued for taste preservation, recyclability, and brand heritage. Although smaller in share, glass packaging is preferred in premium retail stores, cafés, and foodservice channels. Premium carbonated beverages, artisanal sodas, and limited-edition launches increasingly rely on glass formats, which appeal to consumers seeking authenticity and elevated drinking experiences. The resurgence of glass bottles is further supported by their strong presence in European and Middle Eastern markets, where refill and return systems are well established.
Carbonated Soft Drinks Market Regional Analysis:
Asia-Pacific dominated the global landscape, held over 40% of total soft drink volumes, making it the single largest contributor to the Carbonated Beverages Market in 2024. Rapid urbanization, expanding modern retail, aggressive product launches, and strong youth-driven demand fuel the region’s dominance. Markets such as China, India, Indonesia, and Vietnam continue to record rising per-capita consumption, strengthening the region’s leadership position. In contrast, the North America Soft Drinks Market while remains highly profitable due to premiumization and rising adoption of Diet Cola / Zero-Calorie Cola and Sugar-free Beverages, which align with modern health trends.
Europe, though impacted by sugar taxes, sustains strong demand for Fruit-Flavored Carbonates and eco-friendly packaging formats, reinforcing its importance in the Carbonated Soft Drinks Market. Latin America, led by Mexico and Brazil, exhibits some of the highest global per-capita cola consumption, supporting sustained growth in Standard Cola. Simultaneously, the Middle East and Africa show accelerating expansion driven by a young demographic and increasing penetration of PET-based beverages. Across all regions, rising interest in low-calorie carbonates, innovative flavors, and sustainable Carbonated Beverage Packaging Trends continues to shape competitive dynamics and global market dominance.
Competitive Landscape:
The Carbonated Soft Drinks Market is highly competitive and dominated by global giants such as The Coca-Cola Company, PepsiCo, and Keurig Dr Pepper, which collectively control a major share of worldwide sales through strong brand portfolios, extensive bottling networks, and aggressive marketing. These players continuously innovate with zero-sugar, low-calorie, and fruit-flavored carbonates to align with shifting consumer preferences. Regional companies like Parle Agro, Britvic, Tingyi, and Aje Group strengthen competition with localized flavors and affordable pricing. Sustainability, recyclable packaging, and digital distribution strategies are emerging as critical differentiators, intensifying rivalry in Carbonated Soft Drinks Market.
Carbonated Soft Drinks Market Scope: Inquire before buying
| Global Carbonated Soft Drinks Market | |||
|---|---|---|---|
| Report Coverage | Details | ||
| Base Year: | 2025 | Forecast Period: | 2026-2032 |
| Historical Data: | 2020 to 2025 | Market Size in 2025: | USD 292.96 Bn. |
| Forecast Period 2026 to 2032 CAGR: | 4.7% | Market Size in 2032: | USD 404.05 Bn. |
| Segments Covered: | by Flavour |
Standard Cola
Diet Cola / Zero-Calorie Cola
Fruit-Flavored Carbonates (Orange, Lemon-Lime, Mango, Tropical, etc.)
Other Carbonated Beverages
Ginger Ale
Tonic Water
Cream Soda
Root Beer
|
|
| by Packaging Type | PET Bottles Glass Bottles Metal Cans Disposable Cups |
||
| by Distribution Channel | Supermarkets / Hypermarkets Convenience Stores Online Retail / E-Commerce On-Trade (Restaurants, Cafés, Bars, Foodservice) |
||
Carbonated Soft Drinks Market, by Region
North America (United States, Canada and Mexico)
Europe (UK, France, Germany, Italy, Spain, Sweden, Austria, Turkey, Russia and Rest of Europe)
Asia Pacific (China, India, Japan, South Korea, Australia, ASEAN and Rest of APAC)
Middle East and Africa (South Africa, GCC, Egypt, Nigeria and Rest of ME&A)
South America (Brazil, Argentina, Columbia and Rest of South America)
Carbonated Soft Drinks Market, Key Players are:
1. The Coca Cola Company (USA)
2. PepsiCo, Inc. (USA)
3. Keurig Dr Pepper Inc. (USA)
4. Monster Beverage Corporation (USA)
5. Nestlé S.A. (Switzerland)
6. Suntory Holdings Limited (Japan)
7. Asahi Group Holdings, Ltd. (Japan)
8. Britvic PLC (UK)
9. Refresco Group N.V. (Netherlands)
10. National Beverage Corp. (USA)
11. Tingyi (Cayman Islands) Holding Corporation (China)
12. Parle Agro Pvt. Ltd. (India)
13. Varun Beverages Ltd (India)
14. Anheuser Busch InBev SA/NV (Belgium) – (Via soft-drink margins and non-alcoholic drink divisions)
15. Hansen Natural Corporation (USA) – (now part of Monster Beverage)
16. Kirin Holdings Company, Limited (Japan)
17. Cott Corporation (Canada)
18. Ajegroup (Peru)
19. Celsius Holdings, Inc. (USA)
20. Suntory Beverage & Food Limited (Japan)
21. Dabur India Ltd (India) – (with carbonated soft drink lines)
22. THE Zhangzidao Group Co., Ltd. (China) – (via beverage operations)
23. Arca Continental, S.A.B. de C.V. (Mexico) – bottler & soft-drink producer
24. Bisleri International Pvt. Ltd. (India)
25. Corporación José R. Lindley S.A. (Peru)
26. Kali Mark (Kalimark) Pvt. Ltd. (India)
27. C&C Group plc (Ireland)
28. Britvic Ireland Ltd (Ireland)
29. Rauch Fruchtsäfte GmbH & Co OG (Austria)
30. SodaStream International Ltd. (Israel)
FAQs:
1. What was the Global Carbonated Soft Drinks Market size in 2024?
Ans. The Global Carbonated Soft Drinks Market size was USD 292.96 billion in 2024.
2. What is the major drivers for the Carbonated Soft Drinks Market?
Ans. Rising demand for low-calorie and sugar-free beverages, strong youth-driven consumption, flavor innovation, and expansion of PET bottle and on-the-go packaging are the major drivers of this market.
3. What is the growth rate of the Carbonated Soft Drinks Market?
Ans. The Carbonated Soft Drinks Market is growing at a CAGR of 4.7% over forecast the period.
4. What is the market size of the Carbonated Soft Drinks Market by 2032?
Ans. The market size of the Carbonated Soft Drinks Market by 2032 is expected to reach at 404.05 Bn.
5. What is the forecast period for the Carbonated Soft Drinks Market?
Ans. The forecast period for the Carbonated Soft Drinks Market is 2026-2032.