
Busbar Market Size by Conductor, Power Rating, End User, Region – Segment-Level Market Assessment, Growth Opportunity Analysis, Competitive Mapping & Forecast to 2029
Overview
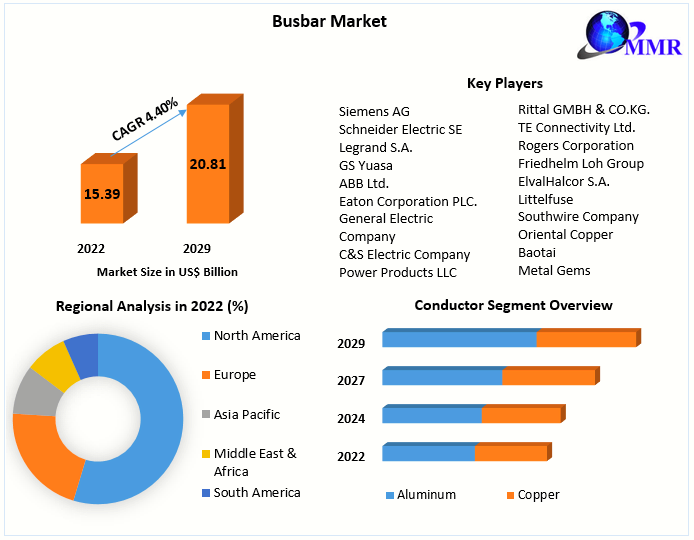
The Busbar Market size was valued at US$ 15.39 Bn. in 2022 and the total revenue is expected to grow at 4.40 % through 2023 to 2029, reaching nearly US$ 20.81 Bn.
Busbar Market Overview:
Global Busbar are strips of electrical material that gather and distribute power. Since busbars are grounded and conduct electricity at the same time, they are typically covered with materials that provide varied conductivity limitations and fluctuations. They make electricity delivery more efficient, versatile, and less inconvenient. They also offer low-cost, fast installation services with minimal downtime. This also make use of re-usable and re-locatable plug-in outlets and require minimal setup materials.
 To know about the Research Methodology :- Request Free Sample Report
Busbar Market Dynamics:
The increasing demand for the uninterruptable and well-founded supply of electricity along with rising concern to reduce energy across transmission and distribution lines will fuel the busbar market size. Additionally, growing demand in the renovation and installation of new transmission networks, as well as rising usage of smart grid technology, will enhance market size over the forecast period. Less thermal resistance, adaptability of tap-off positions, bulk power transmission over long distances, minor fire dangers, and reduced cable bother are some of the primary advantages affecting product acceptance positively.
The market share will be propelled by the rising need for dependable and continuous power generation, as well as a growing focus on minimizing energy losses across transmission and distribution systems. Rapid urbanization, as well as rising investments for infrastructure construction, are two critical drivers driving up power requirements around the country.
However, the cost of raw materials including such as copper, brass, and aluminum is so expensive. So this may limit the busbar market to move further.
Busbar Market Segment Analysis:
Based on Conductor, the global Busbar market is segmented into Aluminum and Copper. The copper segment held the largest market share of xx% in 2022. Because it has the power to transfer a large amount of electric current while minimising risk and having a high thermal conductivity. While the aluminum segment is expected to grow at a higher CAGR of xx% in the global busbar market during the forecast period. In comparison to other materials, the energy dissipation throughout distribution is also lower, resulting in a greater market for aluminum.
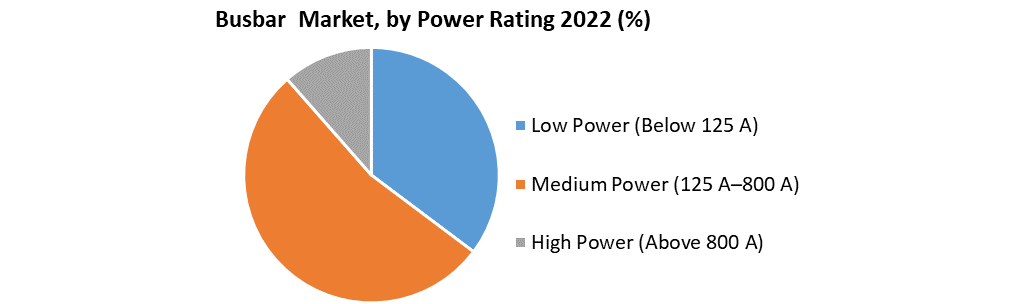
Based on Power Rating, the global Busbar market is segmented into Low Power (Below 125 A), Medium Power (125 A–800 A), and High Power (Above 800 A). The Low Power (Below 125 A) segment held the largest market share of 25% in 2022. Because such low power potential to distribute power to light fixtures across industrial and commercial establishments will encourage product appropriation. The product is acceptable for the distribution of electricity across commercial, industrial, and service sectors.
 Regional Insights:
The Asia Pacific dominates the global Busbar market during the forecast period 2023-2029. The Asia Pacific held the largest market share xx% in 2022. Asia-Pacific is noticing the widespread development of power infrastructure due to an increase in the demand for electricity publicized by economic growth and industrial development. Additionally, the increased focus on renewable power development has led to tremendous development in power systems infrastructure.
North America held the second-largest market share of xx% in 2022. Due to minimize transmission and distribution losses by replacing traditional power substations with energy-efficient technology this factor drives the growth in the region. Also, the rising of advanced technologies in the assembly integrity of the conductor that to minimize the time of implementation and resolve the difficulty, increase productivity, and also conserve the flow of electricity. Such factors may drive the growth of the busbar market over the forecast period.
The objective of the report is to present a comprehensive analysis of the global Busbar Market to the stakeholders in the industry. The past and current status of the industry with the forecasted market size and trends are presented in the report with the analysis of complicated data in simple language. The report covers all the aspects of the industry with a dedicated study of key players that include market leaders, followers, and new entrants.
PORTER, PESTEL analysis with the potential impact of micro-economic factors of the market have been presented in the report. External as well as internal factors that are supposed to affect the business positively or negatively have been analyzed, which will give a clear futuristic view of the industry to the decision-makers.
The reports also helps in understanding the global Busbar Market dynamic, structure by analyzing the market segments and project the global Busbar Market size. Clear representation of competitive analysis of key players by product, price, financial position, product portfolio, growth strategies, and regional presence in the global Busbar Market make the report investor’s guide.
Global Busbar Market Scope: Inquire before buying
| Global Busbar Market | |||
|---|---|---|---|
| Report Coverage | Details | ||
| Base Year: | 2022 | Forecast Period: | 2023-2029 |
| Historical Data: | 2018 to 2022 | Market Size in 2022: | US $ 15.39 Bn. |
| Forecast Period 2023 to 2029 CAGR: | 4.40% | Market Size in 2029: | US $ 20.81 Bn. |
| Segments Covered: | by Conductor | Aluminum Copper |
|
| by Power Rating | Low Power (Below 125 A) Medium Power (125 A–800 A) High Power (Above 800 A) |
||
| by End User | Utilities Residential Commercial Industrial End-Users Chemicals & Petroleum Metals & Mining Manufacturing Others |
||
Busbar Market, by Region
North America (United States, Canada and Mexico)
Europe (UK, France, Germany, Italy, Spain, Sweden, Austria and Rest of Europe)
Asia Pacific (China, South Korea, Japan, India, Australia, Indonesia, Malaysia, Vietnam, Taiwan, Bangladesh, Pakistan and Rest of APAC)
Middle East and Africa (South Africa, GCC, Egypt, Nigeria and Rest)
Key Players are:
1.Siemens AG
2.Schneider Electric SE
3.Legrand S.A.
4.GS Yuasa
5.ABB Ltd.
6.Eaton Corporation PLC.
7.General Electric Company
8.C&S Electric Company
9.Power Products LLC
10.Promet AG
11.Mersen S.A.
12.CHINT Electric Co.Ltd
13.Rittal GMBH & CO.KG.
14.TE Connectivity Ltd.
15.Rogers Corporation
16.Friedhelm Loh Group
17.ElvalHalcor S.A.
18.Littelfuse
19.Southwire Company
20.Oriental Copper
21.Baotai
22.Metal Gems
23.Pentair
Frequently Asked Questions:
1] What segments are covered in Busbar Market report?
Ans. The segments covered in Busbar Market report are based on Conductor, Power Rating, and End-Users.
2] Which region is expected to hold the highest share in the global Busbar Market?
Ans. Asia Pacific is expected to hold the highest share in the global Busbar Market.
3] What is the market size of global Busbar Market by 2029?
Ans. The market size of global Busbar Market by 2029 is US $ 20.81 Bn.
4] Who are the top key players in the global Busbar Market?
Ans. Siemens AG, Schneider Electric SE, Legrand S.A., GS Yuasa, and ABB Ltd. are the top key players in the global Busbar Market.
5] What was the market size of global Busbar Market in 2022?
Ans. The market size of global Busbar Market in 2022 was US $ 15.39 Bn.