
Building Optimization and Commissioning Services Market by Service Type, Building Optimization Technology,Building Type,Component Region - Global Market Size Estimation, Industry-Wide Analysis, Competitive Landscape Assessment & Long-Term Forecast to 2032
Overview
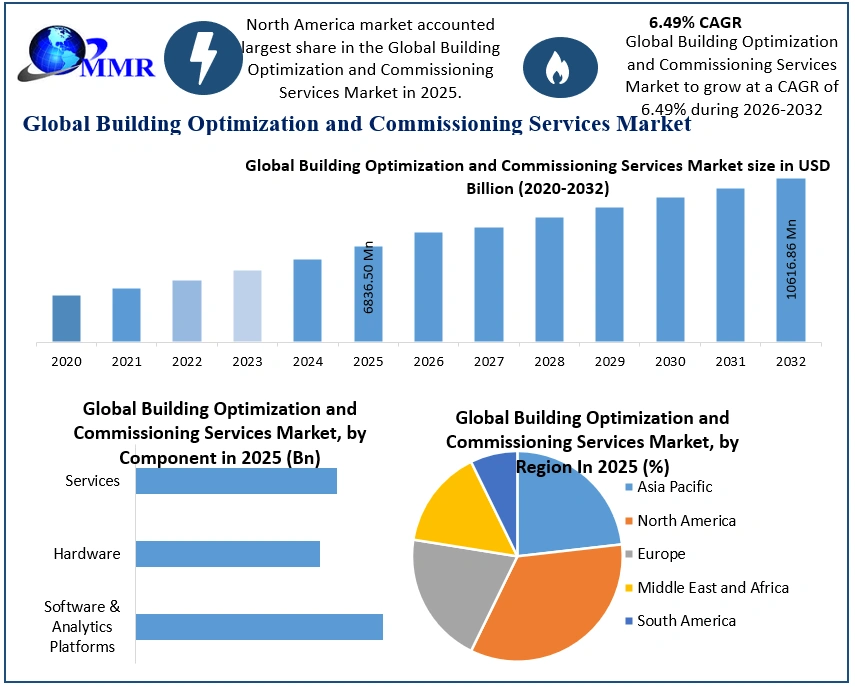
The Building Optimization and Commissioning Services Market size was valued at USD 6836.50 Million in 2025 and the total Building Optimization and Commissioning Services revenue is expected to grow at a CAGR of 6.49% from 2026 to 2032, reaching nearly USD 10616.86 Million by 2032.
Global Building Optimization and Commissioning Services Market Overview
Building Optimization and Commissioning Services is a full suite of engineering and consulting services that ensures that new and existing buildings perform at peak efficiency. These services include energy modeling, system tuning, performance verification, and post-occupancy evaluation; all designed to improve operational performance, decrease energy use, and improve comfort. Optimization makes sure mechanical, electrical, and plumbing (MEP) systems are operating as designed, while commissioning ensures that the MEP systems meet the design requirements and sustainability goals for the entire building's lifecycle.
The global market is experiencing robust growth driven by evolving energy efficiency regulations, increased carbon reduction awareness, and the rising adoption of Green Building certifications (LEED/BREEAM). The strongest demand exists in the commercial, institutional, and healthcare sectors, where sustainability and performance are mission-critical. the acceleration of data-driven optimization practices created through Smart Building technologies and the emergence of IoT-enabled technologies are rapidly evolving the performance opportunities.
The market faces key challenges, including a shortage of skilled commissioning professionals, high upfront service costs, and difficulties integrating solutions with legacy infrastructure. North America continues to dominate the global market, buoyed by energy codes articulating energy performance, ESG mandates from the entire private sector to the real estate investment business, as well as an established infrastructure of sustainability consultants and implementers. The Asia-Pacific region is rapidly emerging, driven by smart city initiatives and mandates around net-zero buildings. Aside from consultancies and focus companies across sectors, there are large players in the space, including Siemens AG (Germany) and CBRE Group, Inc. (USA), that offer clients end-to-end solutions that are especially appealing for energy-efficient operation of commercial or institutional buildings.
To know about the Research Methodology :- Request Free Sample Report
Global Building Optimization and Commissioning Services Market Dynamics
Increasing Adoption of Smart Building Technologies to Drive Building Optimization and Commissioning Services Market
The rapid adoption of smart building technologies, including IoT-enabled devices, AI-driven analytics, and advanced building automation systems, is significantly driving the demand for building optimization and commissioning services. The buildings become more technologically sophisticated, integrating systems such as smart lighting, HVAC controls, and energy management platforms requires precise planning, calibration, and monitoring to ensure optimal performance. Commissioning and optimization services help facility managers maximize energy efficiency, reduce operational costs, enhance occupant comfort, and ensure compliance with sustainability standards. This growing reliance on intelligent systems is creating a strong need for specialized services that can manage, optimize, and maintain complex building infrastructures effectively.
Integration of Renewable Energy Systems to Create Opportunities in the Building Optimization and Commissioning Services Market
The increasing adoption of renewable energy solutions such as solar panels, wind energy, and energy storage systems in buildings is creating new opportunities for building optimization and commissioning services. Proper integration of these systems requires careful planning, monitoring, and optimization to ensure they operate efficiently alongside existing HVAC, lighting, and automation systems. Service providers can capitalize on this trend by offering specialized commissioning and optimization solutions that maximize energy savings, reduce operational costs, and support sustainability goals, positioning themselves as key partners in the transition to green and energy-efficient buildings.
High Service Costs and Limited Provider Availability to Restrain Growth of Building Optimization and Commissioning Services Market
The need for additional expenditure to avail building and commissioning services is expected to hamper the growth of the global market in the next few years. the lack of presence of a large number of companies providing advanced building optimization and commissioning services is likely to restrict the growth of the market in the near future. With the tremendous rise in the population across the globe, construction activities are predicted to increase substantially. This is projected to create potential growth opportunities for the growth of the market in the coming years.
Global Building Optimization and Commissioning Services Market Segment Analysis
Based on Service Type: The market is segmented into New Construction Commissioning, Recommissioning, Retro-commissioning, and Others. Retro-commissioning segment is expected to dominate the Building Optimization and Commissioning Services Market during the forecast period. It is gaining substantial traction because of the growing emphasis on energy efficiency, sustainability, and reducing operational costs. Building owners and facility managers are primarily driven to cut down on energy consumption and enhance building performance to meet environmental regulations and green certification requirements such as LEED and ENERGY STAR.
Based on Building Type: The market is segmented into Commercial Buildings, Residential Buildings, and Industrial Buildings. The commercial buildings segment dominates the global market and has the largest Building Optimization and Commissioning Services Market Share. This is mainly attributed to the Commercial Buildings' sheer size, energy consumption, regulatory requirements, and the need for continuous system optimization to meet corporate sustainability goals. Compared to the Commercial Buildings segment, the Industrial Buildings hold a smaller Building Optimization and Commissioning Services Market share. Even though the industrial buildings are highly complex and benefit from commissioning services, their number is limited compared to commercial buildings.

Global Building Optimization and Commissioning Services Market Regional Insights
In 2025, North America dominated the global Building Optimization and Commissioning Services Market and is expected to maintain this position during the forecast period. The exact cause of North America's leading position can be attributed to its long history of infrastructure, large regional energy efficiency policies, and the established green building standards such as LEED. North America also features a strong system of sustainability consultants, engineering firms, and commissioning service providers to support evolving energy management practices and automation technologies.
The market continues to move toward positive growth due to public and private sector investments in smart buildings, ESG-compliant upgrades to infrastructure, and public-sector mandates in sustainable construction. The U.S. tends to lead the region, with considerable retro-commissioning activity taking place in large commercial and institutional buildings, with the focus on urban environments working to eliminate carbon footprints.
Asia-Pacific is the fastest-growing region in the building optimization and commissioning services market, driven by rapid urbanization, rising awareness of energy-efficient systems, and strong government incentives promoting smart cities and net-zero buildings. Countries such as China, India, and Australia are leading this growth, with large-scale commercial and industrial projects increasingly adopting advanced building automation and energy management solutions. regulatory frameworks, green building certifications, and sustainability mandates are encouraging building owners to implement commissioning and optimization services to enhance operational efficiency and reduce energy costs. The combination of technological adoption, favorable policies, and growing construction activity positions Asia-Pacific as a key growth engine for the market over the coming years.
Global Building Optimization and Commissioning Services Market Competitive Landscape
The Global Building Optimization and Commissioning Services Market is becoming more competitive, driven by increasing demands for energy-efficient buildings, sustainability compliance, and ease of performance monitoring. There has been a heightened focus on carbon reduction goals and optimal building lifecycle performance, leading to competition between key service providers that offer integrated optimization and commissioning services.
For example, Siemens AG (Germany) offers advanced building technologies and automation. Its Desigo CC platform is commonly used by service providers to optimize HVAC, lighting, and security systems, particularly for commercial and industrial infrastructure. Siemens reported strong revenue in FY 2025 in its Smart Infrastructure business unit. The company stated that strong performance in smart buildings and energy retrofit projects contributed to the revenue results.
Johnson Controls, Inc. (USA) provides a number of services, including continuous commissioning and building automation based on AI. The company's OpenBlue platform implies real-time, data-driven facility management solutions. In 2025, Johnson Controls' Building Solutions North America segment transacted more than USD 9 billion in annual revenue. Other players, including Affiliated Engineers Inc., Cimetrics, Inc., and Syska Hennessy Group, have made recent moves to scale their service offerings as the market evolves. Each is building upon its analytics-based solutions and industry-wide recognition of sustainability-focused retrofit strategies.
Global Building Optimization and Commissioning Services Market Trends
| Category | Key Trend | Example | Market Impact |
| AI & IoT–Enabled Commissioning | Integration of AI, machine learning, IoT sensors, and smart analytics into commissioning workflows | AI-powered analytics detecting inefficiencies in real-time; IoT sensor networks monitoring HVAC systems | Enables predictive maintenance, reduces operational downtime, and improves energy management |
| Cloud-Based & Continuous Commissioning | Adoption of cloud platforms and SaaS-delivered commissioning models supporting lifecycle monitoring | Platforms like BrainBox AI’s CBMS offering remote optimization and ongoing monitoring | Drives flexible, outcome-oriented service delivery and long-term performance tracking |
| Occupant-Centric Optimization & WELL/BREEAM Alignment | Commissioning with focus on occupant comfort, health certifications, and occupant-centric HVAC controls | Occupant-centric building controls adapting HVAC lighting based on real-time presence and preferences | Aligns buildings with WELL/BREEAM standards, enhances occupant satisfaction, and reduces energy consumption |
Global Building Optimization and Commissioning Services Market Recent Development
In Jan 2024, Honeywell International Inc.(USA) launched Advance Control for Buildings, a machine-learning-enabled platform with built-in cybersecurity and edge‑to‑cloud connectivity, allowing upgrades over existing wiring without full rewiring, and in Sept 2024, Partnered with Cisco Spaces to integrate occupancy data with its Forge Sustainability+ platform, enabling HVAC optimization based on real‑time usage.
In March 2024, Johnson Controls, Inc. (USA) it launched a Net‑Zero Buildings Initiative in India with Mahindra Group, delivering toolkits and training to decarbonize infrastructure and completed a major sustainability upgrade at its Norman, Oklahoma, plant (OpenBlue platform + 1.56 MW solar PV), reducing emissions by 43% and saving USD 960K annually, serving as a global blueprint.
In Jun 2024, Siemens (Germany) invested USD 100M in expanding its smart infrastructure switchgear plant in Frankfurt, and it raised the mid‑term profit margin target for its Smart Infrastructure division to 16‑20% driven by rising automation demand.
Building Optimization and Commissioning Services Market Scope: Inquire before buying
| Building Optimization and Commissioning Services Market | |||
|---|---|---|---|
| Report Coverage | Details | ||
| Base Year: | 2025 | Forecast Period: | 2026-2032 |
| Historical Data: | 2020 to 2025 | Market Size in 2025: | USD 6836.50 Mn. |
| Forecast Period 2026 to 2032 CAGR: | 6.49% | Market Size in 2032: | USD 10616.86 Mn. |
| Segments Covered: | by Service Type | New Construction Commissioning Recommissioning Retro-commissioning Others |
|
| by Building Optimization Technology | BAS (Building Automation Systems) Energy Management Systems (EMS) Automated Control Systems Others |
||
| by Building Type | Commercial Buildings Residential Buildings Industrial Buildings |
||
| by Component | Software & Analytics Platforms Hardware Services |
||
Global Building Optimization and Commissioning Services Market by Region
North America (United States, Canada, Mexico)
Europe (United Kingdom, France, Germany, Italy, Spain, Sweden, Russia, Rest of Europe)
Asia Pacific(China, South Korea, Japan, India, Australia, Indonesia, Malaysia, Philippines,Thailand, Vietnam, Rest of Asia Pacific)
Middle East and Africa (MEA) (South Africa, GCC, Nigeria, Rest of MEA)
South America (Brazil, Argentina, Colombia, Chile, Rest of South America)
Global Building Optimization and Commissioning Services Market Key Players
1. Building Commissioning, Engineering & Consulting Service Providers
These companies provide commissioning, retro-commissioning, energy audits, building performance optimization, MEP engineering, and sustainability consulting services.
North America
1. Affiliated Engineers, Inc. (AEI) – United States
2. Heapy Engineering – United States
3. IMEG Corporation – United States
4. Sain Engineering Associates, Inc. (SEA) – United States
5. Syska Hennessy Group – United States
6. AECOM – United States
7. Jacobs Solutions Inc. (formerly Jacobs Engineering Group) – United States
8. WSP Global Inc. – Canada
9. Hunton Group, Inc. – United States
Europe
10. Arup Group – United Kingdom
11. Egis Group – France
Asia-Pacific
12. CIM Environmental Pty Ltd. – Australia
13. Pinnacle Infotech – India
14. Sterling & Wilson Private Limited – India
2. Building Automation & Energy Optimization Technology Providers
These companies provide smart building technologies, building management systems (BMS), HVAC controls, automation software, and energy optimization solutions.
North America
1. Honeywell International Inc. – United States
2. Johnson Controls International plc – United States/Ireland
3. Eaton Corporation plc – Ireland/United States
4. Cimetrics, Inc. – United States
Europe
5. Siemens AG – Germany
6. Schneider Electric SE – France
3. Smart Building & Integrated Facility Solution Providers
These companies provide integrated solutions combining building controls, automation, energy management, and performance optimization.
Global Presence
1. Siemens AG – Germany
2. Schneider Electric SE – France
3. Honeywell International Inc. – United States
4. Johnson Controls International plc – United States/Ireland
5. Eaton Corporation plc – Ireland/United States
Frequently Asked Questions
1. Which region has the largest share in the Global Building Optimization and Commissioning Services Market?
Ans: North America held the largest share in the Global Building Optimization and Commissioning Services Market in 2025.
2. What is the growth rate of the Global Building Optimization and Commissioning Services Market?
Ans: The Global Building Optimization and Commissioning Services Market is expected to grow at a CAGR of 6.49% during the forecast period 2026-2032.
3. What is the scope of the Global Building Optimization and Commissioning Services Market report?
Ans: The Global Building Optimization and Commissioning Services Market report helps with the PESTEL, Porter's, Recommendations for Investors and leaders, and market estimation for the forecast period.
4. Who are the key players in the Global Building Optimization and Commissioning Services Market?
Ans: The important key players in the Global Building Optimization and Commissioning Services Market are Affiliated Engineers, Inc. (USA), Cimetrics, Inc. (USA), Eaton (USA), Heapy (USA), Honeywell International Inc. (USA), Hunton Group, Inc. (USA).
5. What is the study period of this market?
Ans: The Global Building Optimization and Commissioning Services Market is studied from 2025 to 2032.