1. Blue Prism Technology Services Market Introduction
1.1. Study Assumption and Market Definition
1.2. Scope of the Study
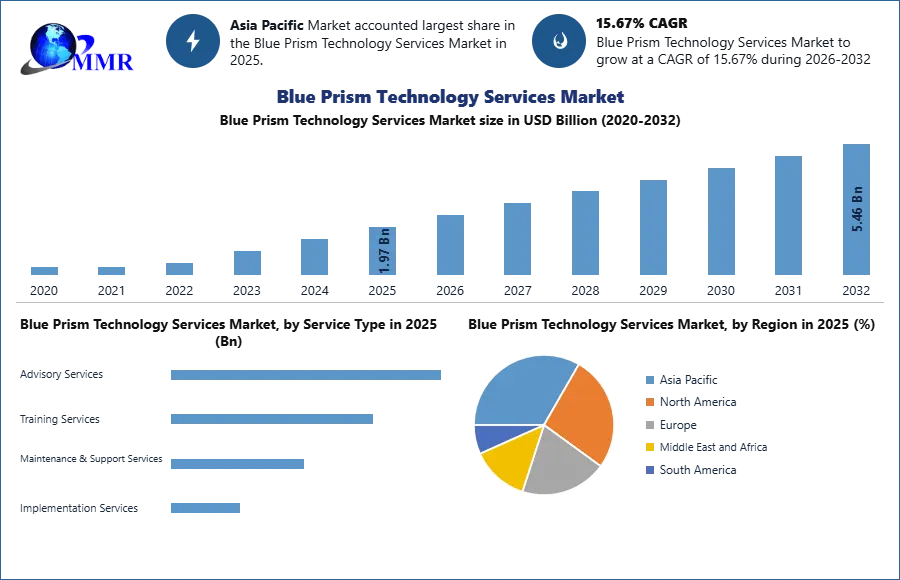
1.3. Executive Summary
2. Global Blue Prism Technology Services Market: Competitive Landscape
2.1. MMR Competition Matrix
2.2. Competitive Landscape
2.3. Key Players Benchmarking
2.3.1. Company Name
2.3.2. Business Segment
2.3.3. End-user Segment
2.3.4. Revenue (2025)
2.3.5. Company Locations
2.4. Leading Blue Prism Technology Services Market Companies, by market capitalization
2.5. Market Structure
2.5.1. Market Leaders
2.5.2. Market Followers
2.5.3. Emerging Players
2.6. Mergers and Acquisitions Details
3. Blue Prism Technology Services Market: Dynamics
3.1. Blue Prism Technology Services Market Trends by Region
3.1.1. North America Blue Prism Technology Services Market Trends
3.1.2. Europe Blue Prism Technology Services Market Trends
3.1.3. Asia Pacific Blue Prism Technology Services Market Trends
3.1.4. Middle East and Africa Blue Prism Technology Services Market Trends
3.1.5. South America Blue Prism Technology Services Market Trends
3.2. Blue Prism Technology Services Market Dynamics by Region
3.2.1. North America
3.2.1.1. North America Blue Prism Technology Services Market Drivers
3.2.1.2. North America Blue Prism Technology Services Market Restraints
3.2.1.3. North America Blue Prism Technology Services Market Opportunities
3.2.1.4. North America Blue Prism Technology Services Market Challenges
3.2.2. Europe
3.2.2.1. Europe Blue Prism Technology Services Market Drivers
3.2.2.2. Europe Blue Prism Technology Services Market Restraints
3.2.2.3. Europe Blue Prism Technology Services Market Opportunities
3.2.2.4. Europe Blue Prism Technology Services Market Challenges
3.2.3. Asia Pacific
3.2.3.1. Asia Pacific Blue Prism Technology Services Market Drivers
3.2.3.2. Asia Pacific Blue Prism Technology Services Market Restraints
3.2.3.3. Asia Pacific Blue Prism Technology Services Market Opportunities
3.2.3.4. Asia Pacific Blue Prism Technology Services Market Challenges
3.2.4. Middle East and Africa
3.2.4.1. Middle East and Africa Blue Prism Technology Services Market Drivers
3.2.4.2. Middle East and Africa Blue Prism Technology Services Market Restraints
3.2.4.3. Middle East and Africa Blue Prism Technology Services Market Opportunities
3.2.4.4. Middle East and Africa Blue Prism Technology Services Market Challenges
3.2.5. South America
3.2.5.1. South America Blue Prism Technology Services Market Drivers
3.2.5.2. South America Blue Prism Technology Services Market Restraints
3.2.5.3. South America Blue Prism Technology Services Market Opportunities
3.2.5.4. South America Blue Prism Technology Services Market Challenges
3.3. PORTER's Five Forces Analysis
3.4. PESTLE Analysis
3.5. Technology Roadmap
3.6. Regulatory Landscape by Region
3.6.1. North America
3.6.2. Europe
3.6.3. Asia Pacific
3.6.4. Middle East and Africa
3.6.5. South America
3.7. Key Opinion Leader Analysis For Blue Prism Technology Services Industry
3.8. Analysis of Government Schemes and Initiatives For Blue Prism Technology Services Industry
3.9. Blue Prism Technology Services Market Trade Analysis
3.10. The Global Pandemic Impact on Blue Prism Technology Services Market
4. Blue Prism Technology Services Market: Global Market Size and Forecast by Segmentation (in USD Billion) 2025-2032
4.1. Blue Prism Technology Services Market Size and Forecast, by Service Type (2025-2032)
4.1.1. Advisory Services
4.1.2. Training Services
4.1.3. Maintenance & Support Services
4.1.4. Implementation Services
4.2. Blue Prism Technology Services Market Size and Forecast, by Enterprise Size (2025-2032)
4.2.1. SMEs
4.2.2. Large Enterprises
4.3. Blue Prism Technology Services Market Size and Forecast, by End Users (2025-2032)
4.3.1. IT & Telecom
4.3.2. Healthcare and Life Sciences
4.3.3. BFSI
4.3.4. Travel, Transportation and Logistics
4.3.5. Utilities & Energy
4.3.6. Others
4.4. Blue Prism Technology Services Market Size and Forecast, by Distribution Channel (2025-2032)
4.4.1. Offline
4.4.2. Online
4.5. Blue Prism Technology Services Market Size and Forecast, by Region (2025-2032)
4.5.1. North America
4.5.2. Europe
4.5.3. Asia Pacific
4.5.4. Middle East and Africa
4.5.5. South America
5. North America Blue Prism Technology Services Market Size and Forecast by Segmentation (in USD Billion) 2025-2032
5.1. North America Blue Prism Technology Services Market Size and Forecast, by Service Type (2025-2032)
5.1.1. Advisory Services
5.1.2. Training Services
5.1.3. Maintenance & Support Services
5.1.4. Implementation Services
5.2. North America Blue Prism Technology Services Market Size and Forecast, by Enterprise Size (2025-2032)
5.2.1. SMEs
5.2.2. Large Enterprises
5.3. North America Blue Prism Technology Services Market Size and Forecast, by End Users (2025-2032)
5.3.1. IT & Telecom
5.3.2. Healthcare and Life Sciences
5.3.3. BFSI
5.3.4. Travel, Transportation and Logistics
5.3.5. Utilities & Energy
5.3.6. Others
5.4. North America Blue Prism Technology Services Market Size and Forecast, by Distribution Channel (2025-2032)
5.4.1. Offline
5.4.2. Online
5.5. North America Blue Prism Technology Services Market Size and Forecast, by Country (2025-2032)
5.5.1. United States
5.5.1.1. United States Blue Prism Technology Services Market Size and Forecast, by Service Type (2025-2032)
5.5.1.1.1. Advisory Services
5.5.1.1.2. Training Services
5.5.1.1.3. Maintenance & Support Services
5.5.1.1.4. Implementation Services
5.5.1.2. United States Blue Prism Technology Services Market Size and Forecast, by Enterprise Size (2025-2032)
5.5.1.2.1. SMEs
5.5.1.2.2. Large Enterprises
5.5.1.3. United States Blue Prism Technology Services Market Size and Forecast, by End Users (2025-2032)
5.5.1.3.1. IT & Telecom
5.5.1.3.2. Healthcare and Life Sciences
5.5.1.3.3. BFSI
5.5.1.3.4. Travel, Transportation and Logistics
5.5.1.3.5. Utilities & Energy
5.5.1.3.6. Others
5.5.1.4. United States Blue Prism Technology Services Market Size and Forecast, by Distribution Channel (2025-2032)
5.5.1.4.1. Offline
5.5.1.4.2. Online
5.5.2. Canada
5.5.2.1. Canada Blue Prism Technology Services Market Size and Forecast, by Service Type (2025-2032)
5.5.2.1.1. Advisory Services
5.5.2.1.2. Training Services
5.5.2.1.3. Maintenance & Support Services
5.5.2.1.4. Implementation Services
5.5.2.2. Canada Blue Prism Technology Services Market Size and Forecast, by Enterprise Size (2025-2032)
5.5.2.2.1. SMEs
5.5.2.2.2. Large Enterprises
5.5.2.3. Canada Blue Prism Technology Services Market Size and Forecast, by End Users (2025-2032)
5.5.2.3.1. IT & Telecom
5.5.2.3.2. Healthcare and Life Sciences
5.5.2.3.3. BFSI
5.5.2.3.4. Travel, Transportation and Logistics
5.5.2.3.5. Utilities & Energy
5.5.2.3.6. Others
5.5.2.4. Canada Blue Prism Technology Services Market Size and Forecast, by Distribution Channel (2025-2032)
5.5.2.4.1. Offline
5.5.2.4.2. Online
5.5.3. Mexico
5.5.3.1. Mexico Blue Prism Technology Services Market Size and Forecast, by Service Type (2025-2032)
5.5.3.1.1. Advisory Services
5.5.3.1.2. Training Services
5.5.3.1.3. Maintenance & Support Services
5.5.3.1.4. Implementation Services
5.5.3.2. Mexico Blue Prism Technology Services Market Size and Forecast, by Enterprise Size (2025-2032)
5.5.3.2.1. SMEs
5.5.3.2.2. Large Enterprises
5.5.3.3. Mexico Blue Prism Technology Services Market Size and Forecast, by End Users (2025-2032)
5.5.3.3.1. IT & Telecom
5.5.3.3.2. Healthcare and Life Sciences
5.5.3.3.3. BFSI
5.5.3.3.4. Travel, Transportation and Logistics
5.5.3.3.5. Utilities & Energy
5.5.3.3.6. Others
5.5.3.4. Mexico Blue Prism Technology Services Market Size and Forecast, by Distribution Channel (2025-2032)
5.5.3.4.1. Offline
5.5.3.4.2. Online
6. Europe Blue Prism Technology Services Market Size and Forecast by Segmentation (in USD Billion) 2025-2032
6.1. Europe Blue Prism Technology Services Market Size and Forecast, by Service Type (2025-2032)
6.2. Europe Blue Prism Technology Services Market Size and Forecast, by Enterprise Size (2025-2032)
6.3. Europe Blue Prism Technology Services Market Size and Forecast, by End Users (2025-2032)
6.4. Europe Blue Prism Technology Services Market Size and Forecast, by Distribution Channel (2025-2032)
6.5. Europe Blue Prism Technology Services Market Size and Forecast, by Country (2025-2032)
6.5.1. United Kingdom
6.5.1.1. United Kingdom Blue Prism Technology Services Market Size and Forecast, by Service Type (2025-2032)
6.5.1.2. United Kingdom Blue Prism Technology Services Market Size and Forecast, by Enterprise Size (2025-2032)
6.5.1.3. United Kingdom Blue Prism Technology Services Market Size and Forecast, by End Users (2025-2032)
6.5.1.4. United Kingdom Blue Prism Technology Services Market Size and Forecast, by Distribution Channel (2025-2032)
6.5.2. France
6.5.2.1. France Blue Prism Technology Services Market Size and Forecast, by Service Type (2025-2032)
6.5.2.2. France Blue Prism Technology Services Market Size and Forecast, by Enterprise Size (2025-2032)
6.5.2.3. France Blue Prism Technology Services Market Size and Forecast, by End Users (2025-2032)
6.5.2.4. France Blue Prism Technology Services Market Size and Forecast, by Distribution Channel (2025-2032)
6.5.3. Germany
6.5.3.1. Germany Blue Prism Technology Services Market Size and Forecast, by Service Type (2025-2032)
6.5.3.2. Germany Blue Prism Technology Services Market Size and Forecast, by Enterprise Size (2025-2032)
6.5.3.3. Germany Blue Prism Technology Services Market Size and Forecast, by End Users (2025-2032)
6.5.3.4. Germany Blue Prism Technology Services Market Size and Forecast, by Distribution Channel (2025-2032)
6.5.4. Italy
6.5.4.1. Italy Blue Prism Technology Services Market Size and Forecast, by Service Type (2025-2032)
6.5.4.2. Italy Blue Prism Technology Services Market Size and Forecast, by Enterprise Size (2025-2032)
6.5.4.3. Italy Blue Prism Technology Services Market Size and Forecast, by End Users (2025-2032)
6.5.4.4. Italy Blue Prism Technology Services Market Size and Forecast, by Distribution Channel (2025-2032)
6.5.5. Spain
6.5.5.1. Spain Blue Prism Technology Services Market Size and Forecast, by Service Type (2025-2032)
6.5.5.2. Spain Blue Prism Technology Services Market Size and Forecast, by Enterprise Size (2025-2032)
6.5.5.3. Spain Blue Prism Technology Services Market Size and Forecast, by End Users (2025-2032)
6.5.5.4. Spain Blue Prism Technology Services Market Size and Forecast, by Distribution Channel (2025-2032)
6.5.6. Sweden
6.5.6.1. Sweden Blue Prism Technology Services Market Size and Forecast, by Service Type (2025-2032)
6.5.6.2. Sweden Blue Prism Technology Services Market Size and Forecast, by Enterprise Size (2025-2032)
6.5.6.3. Sweden Blue Prism Technology Services Market Size and Forecast, by End Users (2025-2032)
6.5.6.4. Sweden Blue Prism Technology Services Market Size and Forecast, by Distribution Channel (2025-2032)
6.5.7. Austria
6.5.7.1. Austria Blue Prism Technology Services Market Size and Forecast, by Service Type (2025-2032)
6.5.7.2. Austria Blue Prism Technology Services Market Size and Forecast, by Enterprise Size (2025-2032)
6.5.7.3. Austria Blue Prism Technology Services Market Size and Forecast, by End Users (2025-2032)
6.5.7.4. Austria Blue Prism Technology Services Market Size and Forecast, by Distribution Channel (2025-2032)
6.5.8. Rest of Europe
6.5.8.1. Rest of Europe Blue Prism Technology Services Market Size and Forecast, by Service Type (2025-2032)
6.5.8.2. Rest of Europe Blue Prism Technology Services Market Size and Forecast, by Enterprise Size (2025-2032)
6.5.8.3. Rest of Europe Blue Prism Technology Services Market Size and Forecast, by End Users (2025-2032)
6.5.8.4. Rest of Europe Blue Prism Technology Services Market Size and Forecast, by Distribution Channel (2025-2032)
7. Asia Pacific Blue Prism Technology Services Market Size and Forecast by Segmentation (in USD Billion) 2025-2032
7.1. Asia Pacific Blue Prism Technology Services Market Size and Forecast, by Service Type (2025-2032)
7.2. Asia Pacific Blue Prism Technology Services Market Size and Forecast, by Enterprise Size (2025-2032)
7.3. Asia Pacific Blue Prism Technology Services Market Size and Forecast, by End Users (2025-2032)
7.4. Asia Pacific Blue Prism Technology Services Market Size and Forecast, by Distribution Channel (2025-2032)
7.5. Asia Pacific Blue Prism Technology Services Market Size and Forecast, by Country (2025-2032)
7.5.1. China
7.5.1.1. China Blue Prism Technology Services Market Size and Forecast, by Service Type (2025-2032)
7.5.1.2. China Blue Prism Technology Services Market Size and Forecast, by Enterprise Size (2025-2032)
7.5.1.3. China Blue Prism Technology Services Market Size and Forecast, by End Users (2025-2032)
7.5.1.4. China Blue Prism Technology Services Market Size and Forecast, by Distribution Channel (2025-2032)
7.5.2. S Korea
7.5.2.1. S Korea Blue Prism Technology Services Market Size and Forecast, by Service Type (2025-2032)
7.5.2.2. S Korea Blue Prism Technology Services Market Size and Forecast, by Enterprise Size (2025-2032)
7.5.2.3. S Korea Blue Prism Technology Services Market Size and Forecast, by End Users (2025-2032)
7.5.2.4. S Korea Blue Prism Technology Services Market Size and Forecast, by Distribution Channel (2025-2032)
7.5.3. Japan
7.5.3.1. Japan Blue Prism Technology Services Market Size and Forecast, by Service Type (2025-2032)
7.5.3.2. Japan Blue Prism Technology Services Market Size and Forecast, by Enterprise Size (2025-2032)
7.5.3.3. Japan Blue Prism Technology Services Market Size and Forecast, by End Users (2025-2032)
7.5.3.4. Japan Blue Prism Technology Services Market Size and Forecast, by Distribution Channel (2025-2032)
7.5.4. India
7.5.4.1. India Blue Prism Technology Services Market Size and Forecast, by Service Type (2025-2032)
7.5.4.2. India Blue Prism Technology Services Market Size and Forecast, by Enterprise Size (2025-2032)
7.5.4.3. India Blue Prism Technology Services Market Size and Forecast, by End Users (2025-2032)
7.5.4.4. India Blue Prism Technology Services Market Size and Forecast, by Distribution Channel (2025-2032)
7.5.5. Australia
7.5.5.1. Australia Blue Prism Technology Services Market Size and Forecast, by Service Type (2025-2032)
7.5.5.2. Australia Blue Prism Technology Services Market Size and Forecast, by Enterprise Size (2025-2032)
7.5.5.3. Australia Blue Prism Technology Services Market Size and Forecast, by End Users (2025-2032)
7.5.5.4. Australia Blue Prism Technology Services Market Size and Forecast, by Distribution Channel (2025-2032)
7.5.6. Indonesia
7.5.6.1. Indonesia Blue Prism Technology Services Market Size and Forecast, by Service Type (2025-2032)
7.5.6.2. Indonesia Blue Prism Technology Services Market Size and Forecast, by Enterprise Size (2025-2032)
7.5.6.3. Indonesia Blue Prism Technology Services Market Size and Forecast, by End Users (2025-2032)
7.5.6.4. Indonesia Blue Prism Technology Services Market Size and Forecast, by Distribution Channel (2025-2032)
7.5.7. Malaysia
7.5.7.1. Malaysia Blue Prism Technology Services Market Size and Forecast, by Service Type (2025-2032)
7.5.7.2. Malaysia Blue Prism Technology Services Market Size and Forecast, by Enterprise Size (2025-2032)
7.5.7.3. Malaysia Blue Prism Technology Services Market Size and Forecast, by End Users (2025-2032)
7.5.7.4. Malaysia Blue Prism Technology Services Market Size and Forecast, by Distribution Channel (2025-2032)
7.5.8. Vietnam
7.5.8.1. Vietnam Blue Prism Technology Services Market Size and Forecast, by Service Type (2025-2032)
7.5.8.2. Vietnam Blue Prism Technology Services Market Size and Forecast, by Enterprise Size (2025-2032)
7.5.8.3. Vietnam Blue Prism Technology Services Market Size and Forecast, by End Users (2025-2032)
7.5.8.4. Vietnam Blue Prism Technology Services Market Size and Forecast, by Distribution Channel (2025-2032)
7.5.9. Taiwan
7.5.9.1. Taiwan Blue Prism Technology Services Market Size and Forecast, by Service Type (2025-2032)
7.5.9.2. Taiwan Blue Prism Technology Services Market Size and Forecast, by Enterprise Size (2025-2032)
7.5.9.3. Taiwan Blue Prism Technology Services Market Size and Forecast, by End Users (2025-2032)
7.5.9.4. Taiwan Blue Prism Technology Services Market Size and Forecast, by Distribution Channel (2025-2032)
7.5.10. Rest of Asia Pacific
7.5.10.1. Rest of Asia Pacific Blue Prism Technology Services Market Size and Forecast, by Service Type (2025-2032)
7.5.10.2. Rest of Asia Pacific Blue Prism Technology Services Market Size and Forecast, by Enterprise Size (2025-2032)
7.5.10.3. Rest of Asia Pacific Blue Prism Technology Services Market Size and Forecast, by End Users (2025-2032)
7.5.10.4. Rest of Asia Pacific Blue Prism Technology Services Market Size and Forecast, by Distribution Channel (2025-2032)
8. Middle East and Africa Blue Prism Technology Services Market Size and Forecast by Segmentation (in USD Billion) 2025-2032
8.1. Middle East and Africa Blue Prism Technology Services Market Size and Forecast, by Service Type (2025-2032)
8.2. Middle East and Africa Blue Prism Technology Services Market Size and Forecast, by Enterprise Size (2025-2032)
8.3. Middle East and Africa Blue Prism Technology Services Market Size and Forecast, by End Users (2025-2032)
8.4. Middle East and Africa Blue Prism Technology Services Market Size and Forecast, by Distribution Channel (2025-2032)
8.5. Middle East and Africa Blue Prism Technology Services Market Size and Forecast, by Country (2025-2032)
8.5.1. South Africa
8.5.1.1. South Africa Blue Prism Technology Services Market Size and Forecast, by Service Type (2025-2032)
8.5.1.2. South Africa Blue Prism Technology Services Market Size and Forecast, by Enterprise Size (2025-2032)
8.5.1.3. South Africa Blue Prism Technology Services Market Size and Forecast, by End Users (2025-2032)
8.5.1.4. South Africa Blue Prism Technology Services Market Size and Forecast, by Distribution Channel (2025-2032)
8.5.2. GCC
8.5.2.1. GCC Blue Prism Technology Services Market Size and Forecast, by Service Type (2025-2032)
8.5.2.2. GCC Blue Prism Technology Services Market Size and Forecast, by Enterprise Size (2025-2032)
8.5.2.3. GCC Blue Prism Technology Services Market Size and Forecast, by End Users (2025-2032)
8.5.2.4. GCC Blue Prism Technology Services Market Size and Forecast, by Distribution Channel (2025-2032)
8.5.3. Nigeria
8.5.3.1. Nigeria Blue Prism Technology Services Market Size and Forecast, by Service Type (2025-2032)
8.5.3.2. Nigeria Blue Prism Technology Services Market Size and Forecast, by Enterprise Size (2025-2032)
8.5.3.3. Nigeria Blue Prism Technology Services Market Size and Forecast, by End Users (2025-2032)
8.5.3.4. Nigeria Blue Prism Technology Services Market Size and Forecast, by Distribution Channel (2025-2032)
8.5.4. Rest of ME&A
8.5.4.1. Rest of ME&A Blue Prism Technology Services Market Size and Forecast, by Service Type (2025-2032)
8.5.4.2. Rest of ME&A Blue Prism Technology Services Market Size and Forecast, by Enterprise Size (2025-2032)
8.5.4.3. Rest of ME&A Blue Prism Technology Services Market Size and Forecast, by End Users (2025-2032)
8.5.4.4. Rest of ME&A Blue Prism Technology Services Market Size and Forecast, by Distribution Channel (2025-2032)
9. South America Blue Prism Technology Services Market Size and Forecast by Segmentation (in USD Billion) 2025-2032
9.1. South America Blue Prism Technology Services Market Size and Forecast, by Service Type (2025-2032)
9.2. South America Blue Prism Technology Services Market Size and Forecast, by Enterprise Size (2025-2032)
9.3. South America Blue Prism Technology Services Market Size and Forecast, by End Users (2025-2032)
9.4. South America Blue Prism Technology Services Market Size and Forecast, by Distribution Channel (2025-2032)
9.5. South America Blue Prism Technology Services Market Size and Forecast, by Country (2025-2032)
9.5.1. Brazil
9.5.1.1. Brazil Blue Prism Technology Services Market Size and Forecast, by Service Type (2025-2032)
9.5.1.2. Brazil Blue Prism Technology Services Market Size and Forecast, by Enterprise Size (2025-2032)
9.5.1.3. Brazil Blue Prism Technology Services Market Size and Forecast, by End Users (2025-2032)
9.5.1.4. Brazil Blue Prism Technology Services Market Size and Forecast, by Distribution Channel (2025-2032)
9.5.2. Argentina
9.5.2.1. Argentina Blue Prism Technology Services Market Size and Forecast, by Service Type (2025-2032)
9.5.2.2. Argentina Blue Prism Technology Services Market Size and Forecast, by Enterprise Size (2025-2032)
9.5.2.3. Argentina Blue Prism Technology Services Market Size and Forecast, by End Users (2025-2032)
9.5.2.4. Argentina Blue Prism Technology Services Market Size and Forecast, by Distribution Channel (2025-2032)
9.5.3. Rest Of South America
9.5.3.1. Rest Of South America Blue Prism Technology Services Market Size and Forecast, by Service Type (2025-2032)
9.5.3.2. Rest Of South America Blue Prism Technology Services Market Size and Forecast, by Enterprise Size (2025-2032)
9.5.3.3. Rest Of South America Blue Prism Technology Services Market Size and Forecast, by End Users (2025-2032)
9.5.3.4. Rest Of South America Blue Prism Technology Services Market Size and Forecast, by Distribution Channel (2025-2032)
10. Company Profile: Key Players
10.1. SS&C Blue Prism
10.1.1. Company Overview
10.1.2. Business Portfolio
10.1.3. Financial Overview
10.1.4. SWOT Analysis
10.1.5. Strategic Analysis
10.1.6. Scale of Operation (small, medium, and large)
10.1.7. Details on Partnership
10.1.8. Regulatory Accreditations and Certifications Received by Them
10.1.9. Awards Received by the Firm
10.1.10. Recent Developments
10.2. Accenture
10.3. IBM
10.4. Capgemini
10.5. Deloitte
10.6. Infosys
10.7. Tata Consultancy Services
10.8. Cognizant
10.9. Wipro
10.10. Ernst & Young
10.11. KPMG
10.12. HCLTech
10.13. DXC Technology
10.14. Tech Mahindra
10.15. LTIMindtree
10.16. NTT DATA
10.17. Fujitsu
10.18. Atos
10.19. CGI Inc.
10.20. EPAM Systems
10.21. Trianz
10.22. Virtusa
10.23. Mphasis
10.24. Genpact
10.25. AutomationEdge
10.26. WonderBotz
10.27. SimplifyNext
10.28. NEOOPS
10.29. Robotic Process Automation Implementation (RPAi)
10.30. Damco Group
11. Key Findings
12. Industry Recommendations
13. Blue Prism Technology Services Market: Research Methodology
14. Terms and Glossary