B2B Mobility Sharing Market – Industry Structure Evaluation, Demand Drivers Analysis, Regional Growth Analysis and Identification, Competitive Positioning Review & Global Market Size Forecast to 2032

16.95%
CAGR (2026-2032)
68.39 USD Bn.
Forecast Market Size
319
Report Pages
126
Market Tables

Overview

Global B2B Mobility Sharing Market size was valued at USD 68.39 Bn. in 2025, and the total Global B2B Mobility Sharing Market revenue is expected to grow by 16.95% from 2026 to 2032, reaching nearly USD 204.65 Bn.

The B2B mobility sharing market has emerged as a pivotal sector in modern urban transportation, offering diverse services such as ride-sourcing, car sharing, and micromobility. This market has seen exponential growth, driven by technological advancements, evolving consumer preferences, and substantial investments.

• According to MMR analysis, the global B2B mobility-sharing market is projected to reach significant revenue milestones, reflecting its robust expansion and adoption across various regions. Companies are continuously innovating to improve service efficiency and user experience, which in turn boosts market revenue and growth.

The extensive use of ride-sourcing services has created a significant demand for B2B mobility sharing in North America. The development of these services is aided by the region's sophisticated infrastructure as well as a high rate of smartphone and mobile internet usage. Market leaders Uber, Lyft, and Via are able to retain and increase their market share by taking use of large user populations and technical developments.

Qualitative data indicates that the rise of autonomous vehicles and AI-powered solutions is set to further transform the B2B mobility sharing landscape. These innovations promise to reduce operational costs and enhance service efficiency, driving higher profit margins. Additionally, environmental sustainability trends are pushing companies to adopt greener technologies, aligning with consumer demand for eco-friendly transportation options. Overall, the B2B mobility sharing market is poised for continued growth, supported by a dynamic ecosystem of technological innovation, consumer demand, and strategic investments.B2B Mobility Sharing Market Snapshot

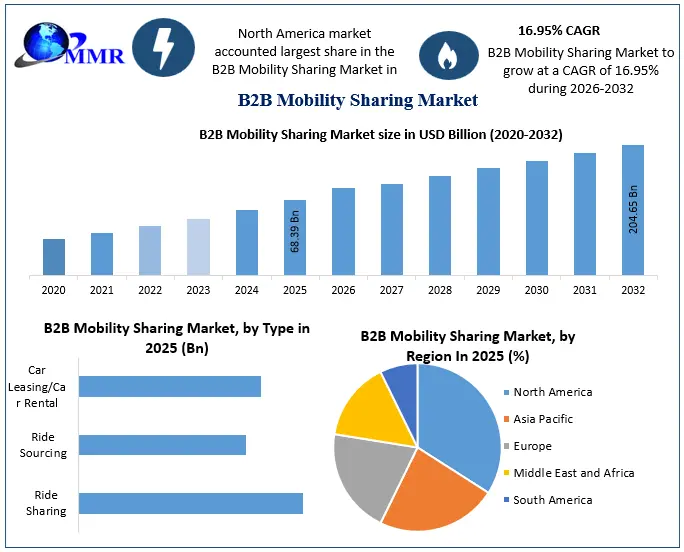
To know about the Research Methodology :- Request Free Sample Report

B2B Mobility Sharing Market Dynamics

The Forces Steering Shared Mobility

B2B shared mobility has revolutionized urban transportation by providing a variety of options, including e-hailing, car sharing, and micro-mobility. E-hailing, where riders use a mobile app to book rides, dominates the marketplace with more than 40 million daily trips. This segment, led by companies like Uber and Lyft, showcases significant profit margins due to its high volume and efficient service models.

By optimizing routes depending on passenger pickups, dynamic shuttle services like Via increase operational effectiveness and profitability. The practice of pooling rides among strangers, or pooled e-hailing, lowers expenses and boosts efficiency, both of which support market growth. Car owners may now hire out their vehicles thanks to the growth of peer-to-peer car-sharing services like Turo, which increases asset utilization and opens up new revenue sources. This particular model not only meets a wide range of customer demands, but it also increases profit margins by reducing vehicle idle time.

• Shared micromobility options like Lime and Bird scooters and bicycles cater to short-distance travel, addressing the last-mile connectivity issue and contributing to market expansion. These services are particularly popular in densely populated urban areas, driving market growth through high usage rates.

Initiatives by the government

Almost every country's government cares about population growth, which have serious effects on ecosystems. Governments encourage individuals to use vehicles and other forms of transportation as little as possible. Furthermore, one of the administration's important ideas to encourage people to pick shared rides over personal trips is to share rides among families, relatives, and friends, which is expected to stimulate the expansion of the B2B Mobility Shared Industry. Consumers prefer affordable & luxury modes of transportation to individual driving. Furthermore, clients who previously rented a personal driver for their vehicle because it was more cost-effective have altered their preferences to using shared transportation. As a result, these initiatives are expected to propel the global B2B Mobility Shared Market forward over the forecast period. Alarmism about the environment and efficient modes of transportation is on the rise.

Challenges Facing Shared Mobility

Distinct regulatory obstacles frequently impede the growth and harmonization of services. A vulnerability exposed by the COVID-19 pandemic was the sharp decline in demand for shared transportation due to lockdowns and social isolation. Additional obstacles include consumer worries regarding data privacy, cleanliness, and safety. A lot of businesses are finding it difficult to turn a profit in the face of increasing operating expenses and competitive pressure, raising concerns about the financial viability of shared mobility models. Infrastructure investments, such as shared car parking spaces and dedicated lanes, are crucial but frequently underfunded, which hinders service effectiveness and adoption rates.

B2B Mobility Sharing Market Segment Analysis

Based on Type, according to MMR analysis, the ride-sourcing segment has been the largest B2B mobility-sharing market in 2025 and is expected to dominate during the forecast period, characterized by its substantial market share and rapid growth.

According to the International Transport Forum (ITF), ride sourcing services, such as those provided by Uber and Lyft, facilitate over 40 million trips daily worldwide. This high usage rate translates to significant profit margins and sustained market growth.

Ride sourcing optimizes routes, cuts down on wait times, and raises client happiness by utilizing cutting-edge algorithms and real-time data. The National Renewable Energy Laboratory (NREL) emphasizes that ride-sourcing platforms' success in the industry is a result of these efficiencies as well as their adaptable scalability. In addition, the U.S. Department of Transportation (DOT) states that the ride-sourcing industry has been growing steadily year over year due to rising urbanization and shifting customer preferences for on-demand and convenient transportation options. The leadership of this market is upheld by ongoing technical advancements and significant investments, guaranteeing its crucial position in urban mobility's future.

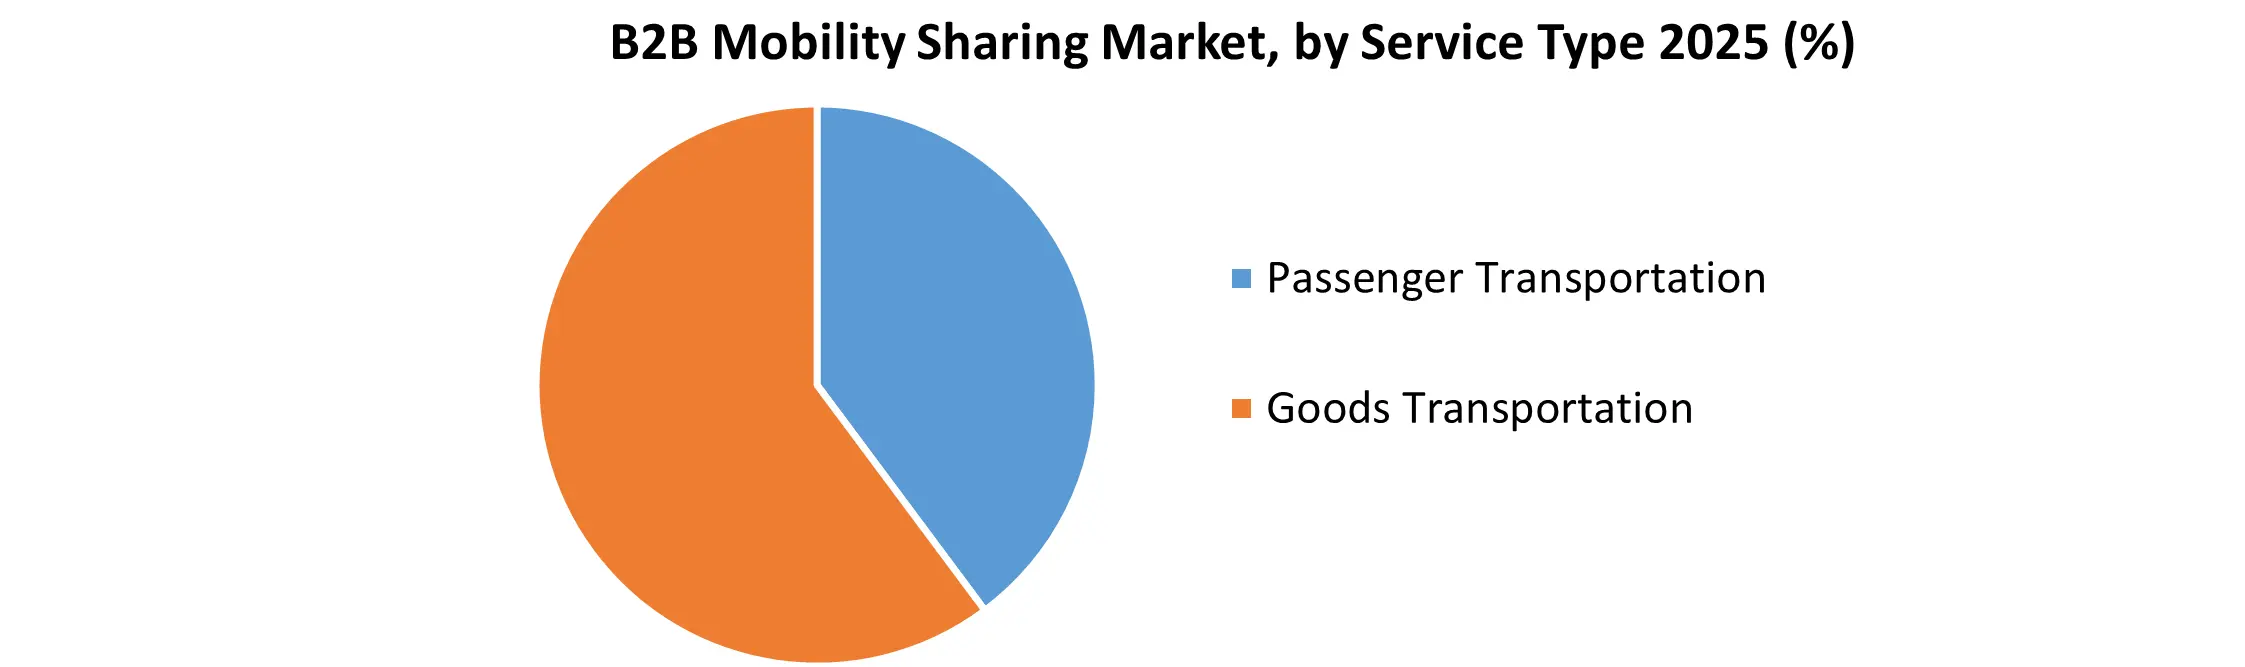
Based on service type, the Global B2B Mobility Sharing Market comprises goods transportation and passenger transportation. Among these, passenger transportation held the dominant share, accounting for 65% of the B2B Mobility Sharing Market. This dominance is primarily attributed to the growing demand for employee commute solutions, especially in urban and corporate hubs. Additionally, businesses are increasingly adopting shared mobility options to reduce operational costs, ease parking concerns, and support sustainability goals, making passenger transportation the preferred service type in the B2B mobility ecosystem.

B2B Mobility Sharing Market

Industry Development Factors:

As traffic congestion worsens, the market for shared mobility is gaining traction. According to an MMR Report study, travel times in Mexico Metropolis during peak traffic are 52 % higher in the year 2021, making this the most congested city in North America. Although this figure refers to extra average travel time during the day, traveling during peak evening hours takes 87 % longer on average. On the West Coast, Los Angeles and Vancouver are the most congested cities in the U.S & Canada, respectively. An increase in demand for ride-sharing services, along with a loss in parking space, is driving the industry. Car-sharing systems are used by businesses to commute their employees daily, decreasing fleet time and parking costs.

Furthermore, governments in Europe & North America have enacted strict pollution control regulations, incentives provided by the US government to use car-sharing, automobile manufacturers in Germany are increasing their investments in car sharing, and heavy traffic congestion and pollution in China are driving people to choose urban mobility. The absence of suitable public transit infrastructure in India, as well as shifting restrictions in Malaysia and Singapore, are important drivers of industry expansion. Furthermore, consumers are choosing ride-sharing due to lower travel costs. The industry is also being aided by an increase in the usage of vehicles equipped with modern technologies.

People can employ solutions that allow users to share a range of forms of transportation due to rising automobile ownership costs. Furthermore, solutions enable users to make real-time reservations, changes, and cancellations. Especially in growing economies such As India & Mexico, ride-hailing services are commonly used. Over the forecast timeline, a lack of knowledge regarding the benefits of such application services may stymie market expansion. Furthermore, in the case of ride-sharing, people are afraid to share their cars with strangers, resulting in a decline in the number of vehicles participating in the segment.

B2B Mobility Sharing Market Regional Overview:

The B2B Mobility Sharing Market is divided into 5 primary segments based on the geographical study. North America, Latin America, Europe, Asia Pacific, the Middle East, and Africa are among them. Because of strict environmental regulations, North America leads the B2B Mobility Sharing Market. The strong market share of North America throughout the world is due to a combination of high disposable income and a significant number of adopters in the region. In the worldwide B2B Mobility Sharing market, Europe is considered to be the second-largest market.

Poor connectivity and high costs connected with internet technology growth are also impeding the market from reaching its maximum potential in some low-income countries in the Middle East and Africa. Various government measures encouraging resource sharing are attempting to restructure the industry. The European Commission, for example, and government bodies like the Center on Regulatory in Europe (CERRE), have begun to offer incentives to vehicle owners to encourage the usage of these services. As a result, several factors have contributed to the market's growth in recent years and thus are anticipated to continue indefinitely.

The objective of the report is to present a comprehensive analysis of the Global B2B Mobility Sharing Market to the stakeholders in the industry. The past and current status of the industry with the forecasted market size and trends are presented in the report with the analysis of complicated data in simple language. The report covers all the aspects of the industry with a dedicated study of key players that include Market leaders, followers, and new entrants.

PORTER, PESTEL analysis with the potential impact of micro-economic factors of the market have been presented in the report. External as well as internal factors that are supposed to affect the business positively or negatively have been analyzed, which will give a clear futuristic view of the industry to the decision-makers.

The report also helps in understanding the Global B2B Mobility Sharing Market dynamics, structure by analyzing the Market segments and projecting the Global B2B Mobility Sharing Market size. Clear representation of competitive analysis of key players by Service Type, price, financial position, Service Type portfolio, growth strategies, and regional presence in the Global B2B Mobility Sharing Market make the report investor’s guide.

B2B Mobility Sharing Market Scope: Inquiry Before Buying

B2B Mobility Sharing Market
Report Coverage Details
Base Year: 2025 Forecast Period: 2026-2032
Historical Data: 2020 to 2025 Market Size in 2025: 68.39 USD Billion
Forecast Period 2026-2032 CAGR: 16.95% Market Size in 2032: 204.65 USD Billion
Segments Covered: by Type Ride Sharing
Ride Sourcing
Car Leasing/Car Rental
by Service Type Passenger Transportation
Goods Transportation
by Business Model Subscription-Based
Pay-as-You-Go
Corporate Contracts
by Vehicle Type Passenger Vehicle
Light Commercial Vehicle
Heavy Commercial Vehicle
Shuttles
Buses/Coaches
Others
by End-User IT & Technology
Manufacturing & Industrial
Logistics & Transportation
Retail & E-commerce
Hospitality & Travel
Healthcare & Life Sciences
Government & Public Sector
Others

B2B Mobility Sharing Market by region

North America (United States, Canada and Mexico)
Europe (UK, France, Germany, Italy, Spain, Sweden, Austria and Rest of Europe)
Asia Pacific (China, South Korea, Japan, India, Australia, Indonesia, Malaysia, Vietnam, Taiwan, Bangladesh, Pakistan and Rest of APAC)
Middle East and Africa (South Africa, GCC, Egypt, Nigeria and Rest)
South America (Brazil, Argetina and Rest of South America)

B2B Mobility Sharing Market Key Players

Uber Technologies Inc.
Lyft Inc.
Ola Cabs
Bolt Technology
FREE NOW
Grab Holdings
DiDi Global

Car Sharing & Corporate Fleet Platforms
Zipcar
Getaround
Free2move
Zoomcar
Drivezy

Leasing, Rental & Fleet Management (B2B Focus)
Enterprise Mobility
Hertz Global Holdings
Sixt SE
Ayvens
Arval
Orix Corporation
Kinto

MaaS (Mobility-as-a-Service) & Aggregators
SkedGo Pty Ltd
Moovit
Citymapper
Ridecell

Shuttle / Corporate Transport Specialists
Shuttl
Zeelo
Liftango
Swvl

Micro-mobility / Niche B2B Sharing
Vogo
Yulu
Tier Mobility
Others

Frequently Asked Questions:

1. Which region has the largest share in Global B2B Mobility Sharing Market?
Ans: North America region held the highest share in 2025.

2. What is the growth rate of Global B2B Mobility Sharing Market?
Ans: The Global B2B Mobility Sharing Market is growing at a CAGR of 16.95% during forecasting period 2026-2032.

3. What is scope of the Global B2B Mobility Sharing market report?
Ans: Global B2B Mobility Sharing Market report helps with the PESTEL, PORTER, COVID-19 Impact analysis, Recommendations for Investors & Leaders, and market estimation of the forecast period.

4. Who are the key players in Global B2B Mobility Sharing market?
Ans: The important key players in the Global B2B Mobility Sharing Market are – Ola, Zipcar, DriveNow, Zoomcar, Car2go, ParkatmyHouse, Lyft, Sixt, Spinlister, Uber, Drivezy, Volercars, SKedGo Pty Ltd, Tanzer, Rapido, and Jenzabar.

5. What is the study period of B2B Mobility Sharing Market?
Ans: The Global B2B Mobility Sharing Market is studied from 2025 to 2032.

Table of Contents

1. Global B2B Mobility Sharing Market: Market Introduction 1.1. Executive Summary 1.2. Market Size (2025) & Forecast (2026-2032) 1.3. Market Size (Value in USD Billion) and Market Share (%) – By Segments, Regions, and Country 2. Global B2B Mobility Sharing Market: Competitive Landscape 2.1. MMR Competition Matrix 2.2. Competitive Positioning of Top Key Players 2.3. Key Players Benchmarking 2.3.1 Company Name 2.3.2 Headquarter 2.3.3 Business Portfolio 2.3.4 Revenue (2025) 2.3.5 Market Share (%) 2025 2.3.6 Profit Margin (%) 2.3.7 Growth Rate (%) 2.3.8 Trips Per Day / Per Vehicle 2.3.9 Repeat Usage Rate (%) 2.3.10 Technology Integration 2.3.11 Carbon Footprint Disclosure 2.3.12 Certifications 2.3.13 ESG Policies 2.3.14 Geographical Presence 2.4. Market Structure 2.4.1 Market Leaders 2.4.2 Market Followers 2.4.3 Emerging Players 2.5. Mergers and Acquisitions Details 2.6 Competitive Intelligence & Strategic Positioning Analysis 2.6.1 Market share benchmarking of key players (revenue %, fleet size %, trips %) 2.6.2 Fleet capacity & geographic footprint comparison (cities served, vehicles deployed) 2.6.3 Business model differentiation (aggregator vs operator vs fleet leasing vs MaaS platforms) 2.6.4 Strategic positioning mapping (cost leadership vs premium service vs enterprise-focused solutions) 2.6.5 Pricing strategies & contract structures (subscription, pay-per-use, long-term enterprise contracts) 2.6.6 Partnership ecosystem analysis (corporates, logistics firms, government, campuses) 2.6.7 M&A, alliances & consolidation impact on market competition and scale advantages 2.7 Business Model Archetypes Analysis 2.7.1 Asset-heavy vs asset-light model comparison 2.7.2 Aggregator vs operator economics 2.7.3 Full-stack vs niche players 2.7.4 Scalability vs profitability trade-off 2.7.5 Differentiation levers (pricing, tech, fleet) 2.7.6 Strategic success factors 2.8 Go-to-Market Strategy for B2B Expansion 2.8.1 Partner identification & targeting framework 2.8.2 Market entry strategy by enterprise segment 2.8.3 Customization vs standardization approach 2.8.4 Pilot-to-scale conversion success rate (%) 2.8.5 Sales cycle duration for enterprise contracts (months) 2.8.6 Customer acquisition strategy (direct vs partnerships) 2.8.7 Regional GTM strategy differences 2.9 B2B Revenue Stream Expansion & Monetization Strategy Analysis 2.9.1 Contribution of B2B revenue streams to total mobility revenue (%) 2.9.2 Revenue diversification impact on business stability (%) 2.9.3 Incremental revenue potential from B2B vs B2C models (%) 2.9.4 Margin expansion through enterprise contracts (%) 2.9.5 Revenue predictability improvement via subscriptions (%) 2.9.6 Multi-stream monetization strategy benchmarking 2.9.7 Long-term revenue scaling potential across B2B models 2.10 Business Model Innovation & Hybrid Platform Strategy 2.10.1 SaaS vs in-house vs hybrid model cost-benefit comparison (%) 2.10.2 Time-to-market reduction through platform integration (%) 2.10.3 Innovation-led differentiation impact on revenue growth (%) 2.10.4 Platform dependency vs internal capability trade-offs 2.10.5 Customization intensity vs scalability trade-off 2.10.6 Operational flexibility gains through hybrid strategies (%) 2.10.7 Case-based performance comparison of hybrid models 2.11 Fleet-as-a-Service (FaaS) & Asset Utilization Optimization 2.11.1 Fleet utilization improvement through B2B deployment (%) 2.11.2 Idle asset reduction via enterprise partnerships (%) 2.11.3 Revenue per fleet deployed under FaaS (USD/vehicle/year) 2.11.4 Dedicated vs shared fleet efficiency comparison 2.11.5 Logistics & delivery partnerships impact on utilization (%) 2.11.6 Asset lifecycle optimization in B2B models 2.11.7 Capacity planning efficiency gains (%) 3. Global B2B Mobility Sharing Market Dynamics 3.1. B2B Mobility Sharing Market Trends 3.2. B2B Mobility Sharing Market Dynamics 3.2.1 Drivers 3.2.2 Restraints 3.2.3 Opportunities 3.2.4 Challenges 3.3. PORTER’s Five Forces Analysis 3.4. PESTLE Analysis 3.5. Value Chain Analysis 3.6. Key Opinion Leader Analysis For the B2B Mobility Sharing Industry 4 Global Mobility Sharing Landscape & Urban Mobility Metrics Analysis 4.1 Traffic congestion trends across key cities (2020–2025) (%) 4.2 Average hours lost in traffic per commuter (hours/year) 4.3 Urban congestion growth rate & city-level penetration (%) 4.4 Average travel time per 10 km (minutes) – global benchmark comparison 4.5 Economic impact of congestion (productivity loss per driver/year $) 4.6 Mobility demand intensity vs congestion correlation (%) 4.7 Modal shift trends (private vehicles to shared mobility) (%) 5 Urban Commute Efficiency & Mobility Cost Burden Analysis 5.1 Average daily commute distance and time (km, minutes) across regions 5.2 Cost of commuting per employee (monthly $ / % of income) 5.3 Time vs cost trade-off analysis (private vs shared mobility) 5.4 Peak vs off-peak travel time variation (%) 5.5 First-mile and last-mile connectivity gap analysis (%) 5.6 Public transport dependency vs shared mobility adoption (%) 5.7 Productivity loss due to inefficient commuting (hours/year per employee) 6 Regional Demand Intensity & Market Maturity Index 6.1 Mobility spend intensity (USD per enterprise) by region 6.2 Market penetration rates across key geographies (%) 6.3 Urban vs semi-urban demand split (%) 6.4 Regulatory impact score (ease of operations index) 6.5 Infrastructure readiness index (EV, charging, road quality) 6.6 Growth rate differential across regions (%) 6.7 Regional profitability comparison 7 Demand-Side Economics & Consumption Behavior Analysis 7.1 Enterprise mobility spend per employee (USD/year) across industries 7.2 Mobility cost vs ownership cost benchmarking (% savings potential) 7.3 Adoption maturity curve across enterprise segments (penetration %) 7.4 Dominance of e-hailing in enterprise mobility (daily trips volume, revenue share %) 7.5 Impact of high-frequency usage models on profitability and margins (%) 7.6 Route optimization & dynamic pooling impact on operational efficiency (%) 7.7 Growth of pooled mobility and its effect on cost reduction per trip (%) 7.8 Peer-to-peer car sharing impact on asset utilization rates (%) 7.9 Contribution of micro-mobility to last-mile connectivity demand (%) 7.10 Urban density correlation with shared mobility adoption rates (%) 8 Pricing Dynamics & Contract Structuring Analysis 2025 8.1 Pricing model comparison (subscription vs pay-per-use vs contracts) 8.2 Average pricing benchmarks (per ride, per km, per employee) 8.3 Discounting trends in enterprise contracts (%) 8.4 Dynamic pricing vs fixed pricing impact on margins 8.5 Multi-year contract penetration (%) 8.6 Pricing sensitivity across industries 8.7 Bundled services impact on pricing power 9 Cost Optimization & Efficiency Improvement Levers 9.1 Cost reduction potential across operations (%) 9.2 Route optimization savings potential (fuel + time %) 9.3 Shared vs dedicated fleet cost comparison 9.4 Driver utilization improvement impact on margins (%) 9.5 Maintenance cost optimization benchmarks 9.6 Centralized vs decentralized fleet management efficiency 9.7 Digitalization-led cost savings potential (%) 10 Revenue Pool & Margin Distribution Analysis 10.1 Total addressable revenue pool by segment ($) 10.2 Profit pool distribution across value chain (%) 10.3 High-margin pockets identification 10.4 Revenue leakage points analysis (%) 10.5 Platform vs operator revenue split (%) 10.6 Geographic revenue concentration (%) 10.7 Future revenue pool shift (next 5–10 years) 11 Corporate Subscription & Employee Mobility Programs Analysis 11.1 Enterprise subscription adoption rate (%) 11.2 Average revenue per employee (ARPU – $/employee/month) 11.3 Employee engagement & usage frequency (%) 11.4 Cost savings vs traditional commute benefits (%) 11.5 Impact on employee productivity & retention (%) 11.6 Corporate mobility budget allocation trends (%) 11.7 Subscription stickiness (renewal rates %) 12 Supply-Side Capacity & Utilization Efficiency 12.1 Fleet size evolution vs demand growth (vehicles vs users ratio) 12.2 Vehicle utilization rates (hours/day, trips/day per vehicle) 12.3 Idle capacity analysis across regions (%) 12.4 Driver-to-vehicle ratio & productivity metrics 12.5 Asset turnover ratio (revenue per vehicle/year) 12.6 Peak vs off-peak utilization spread (%) 12.7 Capacity constraints & supply-demand mismatch quantification 13 Unit Economics & Profitability Benchmarking 13.1 Revenue per trip / per km (by service model) 13.2 Cost structure breakdown (driver, fuel, platform, depreciation %) 13.3 Contribution margin analysis by service type 13.4 Breakeven utilization levels (minimum trips/day required) 13.5 Customer acquisition cost (CAC) vs lifetime value (LTV) 13.6 EBITDA margin comparison across business models 13.7 Profitability gap: B2B contracts vs B2C rides (%) 14 Technology Penetration & Operational Efficiency Metrics 14.1 AI/algorithm-driven routing efficiency gains (%) 14.2 Reduction in empty miles due to optimization (%) 14.3 Platform automation impact on operating costs (%) 14.4 Digital adoption rate among enterprise clients (%) 14.5 Telematics & fleet tracking penetration (%) 14.6 Integration with enterprise systems (ERP, HRMS adoption %) 14.7 Data monetization potential (revenue share from analytics services) 15 Digital Platform Performance & KPI Benchmarking 15.1 Monthly active enterprise users (MAU) 15.2 Trips per user per month 15.3 Platform uptime (%) 15.4 Booking-to-fulfillment conversion rate (%) 15.5 App/portal engagement metrics 15.6 Data analytics usage by enterprises (%) 15.7 Platform scalability benchmarks 16 Mobility-as-a-Service (MaaS) Model – Adoption & Impact Analysis 16.1 MaaS adoption rate across enterprise segments (%) 16.2 Share of MaaS in total B2B mobility spend (%) 16.3 Cost efficiency comparison: MaaS vs traditional fleet ownership (%) 16.4 Integration of multi-modal services (ride-hailing, transit, leasing) within MaaS platforms 16.5 Enterprise subscription penetration and average spend per user ($/employee) 16.6 Impact of MaaS on utilization rates and operational efficiency (%) 16.7 Platform integration with enterprise systems (ERP/HRMS) and digital adoption (%) 17 Automaker-Led Mobility Expansion & Autonomous Integration Analysis 17.1 OEM entry into mobility services (car-sharing platforms, MaaS initiatives) and revenue contribution (%) 17.2 Investment trends by automakers in shared mobility and platform-based services (USD billion) 17.3 Development of purpose-built vehicles for shared mobility (cost efficiency, utilization impact %) 17.4 Strategic shift from vehicle ownership to mobility service models (revenue mix %) 17.5 Partnerships and alliances in autonomous mobility (OEM + tech collaborations) 17.6 Autonomous vehicle integration impact on cost structure and scalability (%) 17.7 Competitive advantage of OEM-backed platforms vs independent mobility providers (%) 18 Enterprise Decision-Making Framework 18.1 Cost-benefit comparison: in-house fleet vs mobility sharing 18.2 Break-even timeline for fleet ownership vs outsourcing 18.3 Strategic decision matrix by company size & industry 18.4 Risk-adjusted ROI comparison across models 18.5 Vendor selection criteria & weighting analysis 18.6 Outsourcing penetration trends (%) 18.7 Case-based decision scenarios (enterprise archetypes) 19 Customer Segmentation by Value & Profitability 19.1 High-value vs low-value customer segmentation (revenue contribution %) 19.2 Profitability by enterprise size & industry 19.3 Contract stickiness (renewal rates %) 19.4 Usage intensity segmentation (heavy vs light users %) 19.5 Revenue concentration (top 20% clients contribution %) 19.6 Customer churn analysis (%) 19.7 Upsell & cross-sell potential across segments 20 Partnership Ecosystem & Value Creation Analysis 20.1 Role of partnerships in revenue generation (%) 20.2 OEM, fleet, and platform partnership structures 20.3 Revenue share models across stakeholders 20.4 Strategic alliances impact on market expansion 20.5 Platform integration ecosystems (API-based models) 20.6 Co-investment trends in mobility infrastructure 20.7 Partnership-driven cost efficiencies (%) 21 Investment, Funding & Capital Efficiency Analysis 21.1 Total funding trends in mobility sharing ($ billion) 21.2 Capital deployed vs revenue generated ratio 21.3 Investor concentration & deal size analysis 21.4 ROI benchmarks across mobility models 21.5 Asset-heavy vs asset-light model comparison 21.6 M&A activity and valuation multiples (EV/Revenue) 21.7 Payback period for fleet investments (years) 22 Fleet Electrification & Sustainability Impact Analysis 22.1 EV adoption rate in B2B mobility fleets (%) 22.2 Cost comparison: EV vs ICE vehicles (TCO analysis) 22.3 Role of sustainability mandates in accelerating B2B mobility demand 22.4 Emission reduction potential (CO₂ per fleet %) 22.5 ESG-driven demand impact (%) 22.6 Government incentives impact on fleet economics 22.7 Charging infrastructure readiness index 22.8 Sustainability-linked contract growth (%) 23 Regulatory Landscape By Region 23.1 Global Regulatory Framework & Market Entry Barriers 23.2 Government Initiatives & Policy Support Impact Analysis 23.3 Compliance Cost & Operational Impact Analysis 23.4 Labor Laws & Driver Classification Impact 23.5 Pricing & Fare Regulation Impact 23.6 Environmental Regulations & EV Mandates 24. Global B2B Mobility Sharing Market Size and Forecast by Segmentation (by Value in USD Billion ) (2025-2032) 24.1. Global B2B Mobility Sharing Market Size and Forecast, By Type 24.1.1 Ride Sharing 24.1.2 Ride Sourcing 24.1.3 Car Leasing/Car Rental 24.2. Global B2B Mobility Sharing Market Size and Forecast, By Service Type 24.2.1 Passenger Transportation 24.2.2 Goods Transportation 24.3. Global B2B Mobility Sharing Market Size and Forecast, By Business Model 24.3.1 Subscription-Based 24.3.2 Pay-as-You-Go 24.3.3 Corporate Contracts 24.4. Global B2B Mobility Sharing Market Size and Forecast, By Vehicle Type 24.4.1 Passenger Vehicle 24.4.2 Light Commercial Vehicle 24.4.3 Heavy Commercial Vehicle 24.4.4 Shuttles 24.4.5 Buses/Coaches 24.4.6 Others 24.5. Global B2B Mobility Sharing Market Size and Forecast, By End-User 24.5.1 IT & Technology 24.5.2 Manufacturing & Industrial 24.5.3 Logistics & Transportation 24.5.4 Retail & E-commerce 24.5.5 Hospitality & Travel 24.5.6 Healthcare & Life Sciences 24.5.7 Government & Public Sector 24.5.8 Others 24.6. Global B2B Mobility Sharing Market Size and Forecast, by Region 24.6.1 North America 24.6.2 United States 24.6.3 Mexico 24.6.4 Canada 24.6.5 Europe 24.6.6 United Kingdom 24.6.7 France 24.6.8 Germany 24.6.9 Italy 24.6.10 Spain 24.6.11 Sweden 24.6.12 Russia 24.6.13 Rest of Europe 24.6.14 Asia Pacific 24.6.15 China 24.6.16 South Korea 24.6.17 Japan 24.6.18 India 24.6.19 Australia 24.6.20 Indonesia 24.6.21 Philippines 24.6.22 Malaysia 24.6.23 Vietnam 24.6.24 Thailand 24.6.25 Rest of Asia Pacific 24.6.26 Middle East and Africa 24.6.27 South Africa 24.6.28 GCC 24.6.29 Turkey 24.6.30 Egypt 24.6.31 Nigeria 24.6.32 Rest of ME&A 24.6.33 South America 24.6.34 Brazil 24.6.35 Argentina 24.6.36 Colombia 24.6.37 Chile 24.6.38 Peru 24.6.39 Rest Of South America 25. Company Profile: Key Players 25.1 Core B2B Mobility Platforms 25.01.Uber Technologies Inc. 25.01.1 Company Overview 25.01.2 Business Portfolio 25.01.3 Financial Overview 25.01.4 SWOT Analysis 25.01.5 Strategic Analysis 25.01.6 Recent Developments 25.02.Lyft Inc. 25.03.Ola Cabs 25.04.Bolt Technology 25.05.FREE NOW 25.06.Grab Holdings 25.07.DiDi Global 25.07.1 Car Sharing & Corporate Fleet Platforms 25.08.Zipcar 25.09.Getaround 25.10.Free2move 25.11.Zoomcar 25.12.Drivezy 25.12.1 Leasing, Rental & Fleet Management (B2B Focus) 25.13.Enterprise Mobility 25.14.Hertz Global Holdings 25.15.Sixt SE 25.16.Ayvens 25.17.Arval 25.18.Orix Corporation 25.19.Kinto 25.19.1 MaaS (Mobility-as-a-Service) & Aggregators 25.20.SkedGo Pty Ltd 25.21.Moovit 25.22.Citymapper 25.23.Ridecell 25.23.1 Shuttle / Corporate Transport Specialists 25.24.Shuttl 25.25.Zeelo 25.26.Liftango 25.27.Swvl 25.27.1 Micro-mobility / Niche B2B Sharing 25.28.Vogo 25.29.Yulu 25.30.Tier Mobility 25.30.1 Others 25. Key Findings 26. Analyst Recommendations 1. Growth Pockets: High-Growth Demand & Profit Pools 2. Differentiation Strategy: Differentiation Through Cost, Utilization & Technology 3. Go-to-Market: Enterprise Acquisition & Contract Monetization 4. Scale-Up Strategy: Multi-Market Expansion & Platform Integration 5. Value Creation: Margin Expansion & Revenue Optimization Levers 27. B2B Mobility Sharing Market: Research Methodology

Custom Market Research Services

We Will Customise The Research For You, In Case The Report Listed Above Does Not Meet With Your Requirements