Augmented Analytics Market: Industry Analysis and Forecast (2024-2030) Trends, Statistics, Dynamics, Segmentation by Component, Organisation Size, Deployment Mode, End-User

The Augmented Analytics Market size was valued at USD 8.74 Million in 2023 and the total Augmented Analytics Market revenue is expected to grow at a CAGR of 22.1 % from 2024 to 2030, reaching nearly USD 35.36 Million. Augmented analytics refers to the use of machine learning and natural language processing technologies to enhance data analytics processes, enabling businesses to derive deeper insights from their data more efficiently. Unlike traditional analytics, which requires significant manual effort and expertise, augmented analytics automates various stages of the analytics workflow, including data preparation, analysis, and interpretation, thereby empowering users with advanced capabilities even without extensive data science knowledge. The Augmented Analytics Market is experiencing rapid growth, driven by the increasing volume and complexity of data, the growing demand for actionable insights, and advancements in AI and machine learning technologies. Organizations across various industries are increasingly adopting augmented analytics solutions to gain actionable insights from their data and drive business performance. The banking, financial services, and insurance (BFSI) sector is leveraging augmented analytics to enhance risk management, fraud detection, and customer insights. Similarly, healthcare organizations are utilizing augmented analytics to improve patient outcomes, optimize resource allocation, and personalize treatment plans. These include the rising demand for self-service analytics tools, the need for real-time analytics capabilities, and the increasing focus on predictive and prescriptive analytics. The integration of augmented analytics with business intelligence (BI) platforms and the proliferation of IoT devices generating vast amounts of data are further driving market growth. Recent developments in the augmented analytics market include advancements in natural language processing (NLP) algorithms, enabling users to interact with data through voice commands and text queries. Key players in the market are focusing on enhancing their platforms' scalability, security, and usability to meet the evolving needs of businesses and ensure seamless integration with existing workflows. Trends in the augmented analytics market include the shift towards augmented data discovery, which combines AI-driven insights with human intuition to uncover hidden patterns and trends in data. Moreover, the increasing adoption of cloud-based augmented analytics solutions and the rise of explainable AI (XAI) is shaping the future of analytics, enabling businesses to understand and trust AI-driven insights. Opportunities in the augmented analytics market abound, particularly in emerging economies where businesses are increasingly investing in digital transformation initiatives and seeking innovative solutions to gain a competitive edge. The proliferation of IoT devices, the growing importance of data-driven decision-making, and the need for advanced analytics capabilities across industries present significant growth opportunities for augmented analytics vendors.Augmented Analytics Market
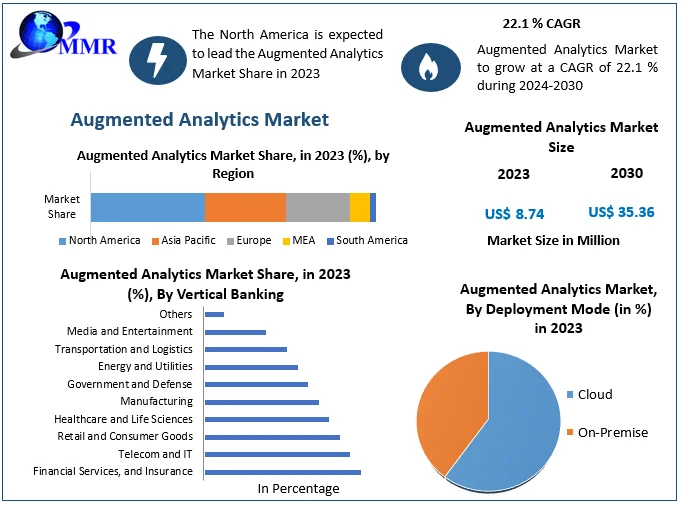
To know about the Research Methodology :- Request Free Sample Report Market Dynamics: Simplifying Data Complexity, The Role of Augmented Analytics in Business Insights: Augmented analytics simplifies this complexity by leveraging AI and machine learning algorithms to automate data preparation, analysis, and interpretation. For example, augmented analytics platforms like Tableau and Power BI integrate AI capabilities to assist users in identifying trends and patterns in vast datasets. Organizations seek self-service analytics tools that empower users to access and analyze data without extensive IT support. Augmented analytics platforms like ThoughtSpot and Sisense enable business users to perform complex analyses through intuitive interfaces and natural language queries, reducing dependency on data scientists. This trend fosters data-driven decision-making across departments and enhances operational efficiency. Augmented analytics leverage advanced technologies such as natural language processing (NLP), machine learning (ML), and predictive analytics to enhance analytical capabilities. For instance, tools like Looker and Alteryx utilize ML algorithms to automate data modeling and generate predictive insights, enabling organizations to anticipate future trends and make proactive decisions. The adoption of cloud-based augmented analytics solutions is on the rise due to their scalability, flexibility, and cost-effectiveness. Cloud platforms like Google Cloud and Microsoft Azure offer integrated analytics services that leverage AI and ML capabilities to deliver actionable insights from diverse data sources. This allows organizations to access analytics tools and resources on demand without significant upfront investments in the Augmented Analytics Market. Augmented analytics promotes data democratization by enabling users across the organization to access and analyze data independently. Tools like Qlik and GoodData offer intuitive interfaces and self-service features that empower business users to derive insights from data without specialized technical skills. This democratization fosters a data-driven culture and enhances collaboration among teams. The proliferation of IoT devices and the generation of massive volumes of data present opportunities for augmented analytics. By integrating IoT data streams with traditional datasets, organizations gain deeper insights into customer behavior, operational efficiency, and product performance. Augmented analytics platforms like SAS and IBM Watson Analytics facilitate the analysis of IoT-generated data to uncover actionable insights. Augmented analytics finds applications across various industries, including retail, healthcare, finance, and manufacturing, among others. For instance, in retail, augmented analytics helps optimize inventory management, predict customer demand, and personalize marketing efforts. In healthcare, it aids in clinical decision support, disease prediction, and patient monitoring. This broad applicability fuels Augmented Analytics Market growth as organizations across diverse sectors recognize the value of augmented analytics in driving innovation and competitive advantage. Driving Adoption with Scalable Cloud-Based Augmented Analytics Solutions: Augmented analytics solutions offer opportunities to streamline data preparation and analysis. For instance, platforms like Tableau leverage AI algorithms to automate data cleansing and modeling, reducing manual efforts and accelerating insights generation. With businesses seeking agile analytics solutions, augmented analytics platforms like ThoughtSpot empower users to derive insights independently. For example, ThoughtSpot's intuitive interface enables users to query data using natural language, fostering a self-service analytics culture. Augmented analytics integrate AI and ML algorithms to enhance analytical capabilities. Tools like Looker utilize ML to automate data modeling, enabling organizations to extract predictive insights and drive proactive decision-making. Cloud-based augmented analytics solutions offer scalability and cost-efficiency, driving adoption. For instance, Google Cloud's integrated analytics services leverage AI to deliver actionable insights from diverse data sources, providing organizations with flexible and accessible analytics capabilities. Augmented analytics fosters data democratization by enabling users across organizations to access and analyze data independently. Platforms like Qlik facilitate intuitive data exploration, empowering users to derive insights without specialized technical skills. Integration of IoT data streams with traditional datasets presents opportunities for deeper insights. For instance, SAS Analytics helps organizations analyze IoT-generated data to optimize operational efficiency and enhance product performance. Regulatory mandates drive the adoption of augmented analytics solutions with built-in data governance features. Platforms like SAP Analytics Cloud ensure compliance with regulations like GDPR, mitigating risks associated with data breaches. Augmented analytics platforms like Looker provide real-time data visualization and analysis capabilities, enabling organizations to monitor KPIs and detect anomalies promptly. This facilitates proactive decision-making and enhances competitive advantage in dynamic Augmented Analytics Market. Businesses leverage augmented analytics to gain deeper insights into customer preferences and behaviors. Platforms like Salesforce Einstein Analytics enable organizations to analyze customer interactions across multiple touchpoints, driving personalized marketing campaigns and enhancing customer satisfaction. Augmented analytics finds applications across diverse industries, including retail, healthcare, and finance. For instance, in retail, augmented analytics helps optimize inventory management and predict customer demand, driving operational efficiency and revenue growth.Augmented Analytics Market1 Privacy Concerns in Augmented Analytics Compliance and Limitations: Augmented analytics adoption faces challenges due to technology complexity and the need for skilled professionals in Augmented Analytics Market. For instance, integrating AI algorithms into existing analytics platforms requires expertise in both analytics and AI, which is scarce. Augmented analytics heavily relies on data quality, posing a restraint when dealing with incomplete or inaccurate datasets. For example, if AI algorithms analyze flawed data, it could lead to erroneous insights and flawed decision-making processes. With augmented analytics accessing vast amounts of data, privacy concerns arise regarding sensitive information. For instance, healthcare organizations must comply with regulations like HIPAA, limiting the data that is utilized for analysis. Implementing augmented analytics solutions is costly, especially for small and medium-sized enterprises (SMEs). For example, licensing fees for advanced analytics platforms and hiring skilled data scientists strain budgets. Augmented analytics integration with existing IT infrastructure poses challenges, especially in legacy systems. For instance, ensuring compatibility and seamless integration with legacy databases and applications requires substantial effort. Some augmented analytics solutions lack scalability, hindering their adoption in large enterprises with extensive data needs. For example, if a solution cannot handle a sudden influx of data, it could lead to performance issues and scalability limitations. Despite the goal of democratizing analytics, organizations still rely heavily on data scientists to interpret complex insights generated by augmented analytics tools. This dependency slows down decision-making processes and limits accessibility to insights. Augmented analytics must adhere to various regulatory frameworks, adding complexity to the implementation. For example, financial institutions must comply with regulations like GDPR and CCPA, requiring stringent data governance and privacy measures. Organizations face resistance to adopting augmented analytics due to cultural and organizational inertia. For example, employees accustomed to traditional analytics methods resist transitioning to AI-driven approaches, affecting adoption rates. Augmented analytics solutions may introduce security vulnerabilities, especially when handling sensitive data in Augmented Analytics Market. For example, if AI algorithms are compromised, it could lead to data breaches and expose confidential information, undermining trust in the analytics platform.Augmented Analytics Market2

Augmented Analytics Market Segment Analysis:

Based on Component, The Banking, Financial Services, and Insurance (BFSI) sector holds a prominent position, driven by the need for advanced analytics to optimize risk management, fraud detection, and customer experience. Similarly, the Telecom and IT sectors extensively utilize augmented analytics for network optimization, customer segmentation, and predictive maintenance, positioning them as significant adopters in the market. Retail and Consumer Goods industries leverage augmented analytics for personalized marketing, inventory management, and demand forecasting, showcasing substantial application and adoption rates. Healthcare and Life Sciences sectors increasingly adopt augmented analytics for patient outcome prediction, drug discovery, and resource optimization, indicating significant growth potential in this vertical. Manufacturing industries utilize augmented analytics for predictive maintenance, supply chain optimization, and quality control, contributing to their prominence in the market. Other segments such as Government and Defense, Energy and Utilities, Transportation and Logistics, Media and Entertainment, and others exhibit varying degrees of adoption, with significant growth expected in the coming years due to increasing awareness of the benefits of augmented analytics across diverse industries. While BFSI, Telecom and IT, Retail and Consumer Goods, and Healthcare and Life Sciences sectors currently dominate the augmented analytics market, other segments are expected to witness substantial growth and adoption as the technology matures and awareness increases.

Augmented Analytics Market Regional Insights:

North America leads the market, driven by the presence of major augmented analytics vendors and early adoption by enterprises. For instance, companies like Tableau, Qlik, and ThoughtSpot are headquartered in North America and have significant market share. Additionally, the region benefits from a mature IT infrastructure and a strong focus on technological innovation, fostering widespread adoption of augmented analytics solutions across industries such as BFSI, healthcare, and retail. The Asia-Pacific region is expected to witness exponential growth in the augmented analytics market, fueled by increasing digital transformation initiatives and rising demand for advanced analytics tools. Countries like China, India, and Japan are at the forefront of this growth, with a surge in investments in AI and analytics technologies across sectors like manufacturing, healthcare, and telecommunications. For example, Alibaba Cloud, based in China, offers augmented analytics solutions tailored to various industries, contributing to Augmented Analytics Market growth in the region. Furthermore, government initiatives promoting digitalization and data-driven decision-making are driving the adoption of augmented analytics in emerging economies across Asia-Pacific. As businesses increasingly recognize the value of data-driven insights, the augmented analytics Augmented Analytics Market in Asia-Pacific is expected to grow rapidly, presenting significant opportunities for both established vendors and emerging players in the region. Therefore, while North America currently dominates the augmented analytics market, Asia-Pacific is poised for substantial growth, driven by technological advancements, increasing digitalization, and supportive government policies, making it a key region to watch for future market developments.

Competitive Landscape

These recent developments, such as GoodData's collaboration with Arria, Trinity Life Sciences' partnership with WhizAI, AnswerRocket's launch of Max, and Qlik's recognition of two Constellation ShortLists, are poised to drive significant Augmented Analytics Market growth in the analytics sector. By integrating AI-driven insights and enhancing data analytics capabilities, companies aim to deliver intuitive and efficient solutions for their clients, empowering them to make data-driven decisions effectively. These advancements underscore the increasing importance of AI and augmented analytics in improving decision-making processes and transforming businesses across various sectors. As organizations strive to leverage advanced technologies for competitive advantage, these developments are expected to fuel adoption and innovation in the analytics Augmented Analytics Market, driving substantial growth and opportunities for industry players. In June 2023, GoodData, a cloud analytics firm based in California, revealed its collaboration with artificial intelligence provider Arria to enhance its customer analytics capabilities. This partnership introduces self-service analytics tools powered by natural language processing, reducing manual efforts for users. By integrating Arria's AI solutions, GoodData aims to deliver intuitive insights and streamline data analysis processes for its customers. May 2023 witnessed Trinity Life Sciences partnering with WhizAI, an AI-powered analytics provider, to swiftly integrate AI-driven insights. This collaboration aims to provide comprehensive domain expertise and data services to their clientele. Through leveraging artificial intelligence capabilities, Trinity Life Sciences and WhizAI endeavor to enhance decision-making processes and deliver advanced analytics solutions in the life sciences sector. March 2023 marked the debut of Max, an AI-assisted data analytics solution by AnswerRocket, aiming to empower enterprises to uncover valuable insights. Max seamlessly integrates AnswerRocket's augmented analytics platform with OpenAI's GPT-4 large language model, offering enhanced capabilities for intuitive data analysis. This innovative tool revolutionizes the way businesses analyze information, providing efficient and insightful data-driven decisions. August 2023 saw Qlik's acknowledgment on two Constellation ShortLists: Qlik AutoML for AI and ML, and Qlik Sense for Augmented BI and Analytics. These recognitions aim to facilitate early adopters and fast-followers in accessing transformative technologies and services. Qlik's presence on these lists underscores its commitment to empowering organizations with advanced analytics solutions for enhanced decision-making and business transformation.

Augmented Analytics Market Scope: Inquire before buying

Global Augmented Analytics Market
Report Coverage Details
Base Year: 2023 Forecast Period: 2024-2030
Historical Data: 2018 to 2023 Market Size in 2023: US $ 8.74 Bn.
Forecast Period 2023 to 2030 CAGR: 22.1% Market Size in 2030: US $ 35.36 Bn.
Segments Covered: by Component Software Services
by Organisation Size Large Enterprises Small and Medium-Sized Enterprises
by Deployment Mode On-Premise Cloud
by Vertical Banking, Financial Services, and Insurance Telecom and IT Retail and Consumer Goods Healthcare and Life Sciences Manufacturing Government and Defense Energy and Utilities Transportation and Logistics Media and Entertainment Others

Augmented Analytics Market, by Region

North America (United States, Canada and Mexico) Europe (UK, France, Germany, Italy, Spain, Sweden, Austria and Rest of Europe) Asia Pacific (China, South Korea, Japan, India, Australia, Indonesia, Malaysia, Vietnam, Taiwan, Bangladesh, Pakistan and Rest of APAC) Middle East and Africa (South Africa, GCC, Egypt, Nigeria and Rest of ME&A) South America (Brazil, Argentina Rest of South America)

Augmented Analytics Market Key Players

Key Players in North America: 1. Tableau Software (US) 2. MicroStrategy (US) 3. Microsoft Corporation (US) 4. Birst (US) 5. Sisense (US) Key Players in Europe: 1. SAS Institute (UK) 2. SAP SE (Germany) 3. Pyramid Analytics (Netherlands) 4. Board International (Switzerland) 5. Oracle Corporation (US) 6. Qlik (Sweden) Key Players in Asia Pacific: 1. Yellowfin (Australia) FAQs: 1. What are the growth drivers for the Augmented Analytics Market? Ans. Simplifying Data Complexity, The Role of Augmented Analytics in Business Insights expected to be the major driver for the Augmented Analytics Market. 2. What are the major Opportunity for the Augmented Analytics Market growth? Ans. Driving Adoption with Scalable Cloud-Based Augmented Analytics Solutions is the major opportunity for the Augmented Analytics market. 3. Which country is expected to lead the global Augmented Analytics Market during the forecast period? Ans. North America is expected to lead the Augmented Analytics Market during the forecast period. 4. What is the projected market size and growth rate of the Augmented Analytics Market? Ans. The Augmented Analytics Market size was valued at USD 8.74 Million in 2023 and the total Augmented Analytics Market revenue is expected to grow at a CAGR of 22.1 % from 2024 to 2030, reaching nearly USD 35.36 Million. 5. What segments are covered in the Augmented Analytics Market report? Ans. The segments covered in the Augmented Analytics Market report are by Component, Organisation Size, Deployment Mode, End User, and Region.
1. Augmented Analytics Market: Research Methodology 2. Augmented Analytics Market Introduction 2.1 Study Assumption and Market Definition 2.2 Scope of the Study 2.3 Executive Summary 3. Augmented Analytics Market: Dynamics 3.1 Augmented Analytics Market Trends by Region 3.1.1 North America Augmented Analytics Market Trends 3.1.2 Europe Augmented Analytics Market Trends 3.1.3 Asia Pacific Augmented Analytics Market Trends 3.1.4 Middle East and Africa Augmented Analytics Market Trends 3.1.5 South America Augmented Analytics Market Trends 3.2 Augmented Analytics Market Dynamics by Region 3.2.1 North America 3.2.1.1 North America Augmented Analytics Market Drivers 3.2.1.2 North America Augmented Analytics Market Restraints 3.2.1.3 North America Augmented Analytics Market Opportunities 3.2.1.4 North America Augmented Analytics Market Challenges 3.2.2 Europe 3.2.2.1 Europe Augmented Analytics Market Drivers 3.2.2.2 Europe Augmented Analytics Market Restraints 3.2.2.3 Europe Augmented Analytics Market Opportunities 3.2.2.4 Europe Augmented Analytics Market Challenges 3.2.3 Asia Pacific 3.2.3.1 Asia Pacific Augmented Analytics Market Drivers 3.2.3.2 Asia Pacific Augmented Analytics Market Restraints 3.2.3.3 Asia Pacific Augmented Analytics Market Opportunities 3.2.3.4 Asia Pacific Augmented Analytics Market Challenges 3.2.4 Middle East and Africa 3.2.4.1 Middle East and Africa Augmented Analytics Market Drivers 3.2.4.2 Middle East and Africa Augmented Analytics Market Restraints 3.2.4.3 Middle East and Africa Augmented Analytics Market Opportunities 3.2.4.4 Middle East and Africa Augmented Analytics Market Challenges 3.2.5 South America 3.2.5.1 South America Augmented Analytics Market Drivers 3.2.5.2 South America Augmented Analytics Market Restraints 3.2.5.3 South America Augmented Analytics Market Opportunities 3.2.5.4 South America Augmented Analytics Market Challenges 3.3 PORTER’s Five Forces Analysis 3.3.1 Bargaining Power Of Suppliers 3.3.2 Bargaining Power Of Buyers 3.3.3 Threat Of New Entrants 3.3.4 Threat Of Substitutes 3.3.5 Intensity Of Rivalry 3.4 PESTLE Analysis 3.5 By Value Chain Analysis 3.6 Regulatory Landscape by Region 3.6.1 North America 3.6.2 Europe 3.6.3 Asia Pacific 3.6.4 Middle East and Africa 3.6.5 South America 3.7 Analysis of Government Schemes and Initiatives For the Augmented Analytics Industry 3.8 The Global Pandemic and Redefining of The Augmented Analytics Industry Landscape 4. Global Augmented Analytics Market: Global Market Size and Forecast by Segmentation (By Value) (2023-2030) 4.1 Global Augmented Analytics Market Size and Forecast, by Component (2023-2030) 4.1.1 Software 4.1.2 Services 4.2 Global Augmented Analytics Market Size and Forecast, by Organisation Size (2023-2030) 4.2.1 Large Enterprises 4.2.2 Small and Medium-Sized Enterprises 4.3 Global Augmented Analytics Market Size and Forecast, by Deployment Mode (2023-2030) 4.3.1 On-Premise 4.3.2 Cloud 4.4 Global Augmented Analytics Market Size and Forecast, by Vertical Banking (2023-2030) 4.4.1 Financial Services, and Insurance 4.4.2 Telecom and IT 4.4.3 Retail and Consumer Goods 4.4.4 Healthcare and Life Sciences 4.4.5 Manufacturing 4.4.6 Government and Defense 4.4.7 Energy and Utilities 4.4.8 Transportation and Logistics 4.4.9 Media and Entertainment 4.4.10 Others 4.5 Global Augmented Analytics Market Size and Forecast, by Region (2023-2030) 4.5.1 North America 4.5.2 Europe 4.5.3 Asia Pacific 4.5.4 Middle East and Africa 4.5.5 South America 5. North America Augmented Analytics Market Size and Forecast by Segmentation (By Value) (2023-2030) 5.1 North America Augmented Analytics Market Size and Forecast, by Component (2023-2030) 5.1.1 Software 5.1.2 Services 5.2 North America Augmented Analytics Market Size and Forecast, by Organisation Size (2023-2030) 5.2.1 Large Enterprises 5.2.2 Small and Medium-Sized Enterprises 5.3 North America Augmented Analytics Market Size and Forecast, by Deployment Mode (2023-2030) 5.3.1 On-Premise 5.3.2 Cloud 5.4 North America Augmented Analytics Market Size and Forecast, by Vertical Banking (2023-2030) 5.4.1 Financial Services, and Insurance 5.4.2 Telecom and IT 5.4.3 Retail and Consumer Goods 5.4.4 Healthcare and Life Sciences 5.4.5 Manufacturing 5.4.6 Government and Defense 5.4.7 Energy and Utilities 5.4.8 Transportation and Logistics 5.4.9 Media and Entertainment 5.4.10 Others 5.5 North America Augmented Analytics Market Size and Forecast, by Country (2023-2030) 5.5.1 United States 5.5.1.1 United States Augmented Analytics Market Size and Forecast, by Component (2023-2030) 5.5.1.1.1 Software 5.5.1.1.2 Services 5.5.1.2 United States Augmented Analytics Market Size and Forecast, by Organisation Size (2023-2030) 5.5.1.2.1 Large Enterprises 5.5.1.2.2 Small and Medium-Sized Enterprises 5.5.1.3 United States Augmented Analytics Market Size and Forecast, by Deployment Mode (2023-2030) 5.5.1.3.1 On-Premise 5.5.1.3.2 Cloud 5.5.1.4 United States Augmented Analytics Market Size and Forecast, by Vertical Banking (2023-2030) 5.5.1.4.1 Financial Services, and Insurance 5.5.1.4.2 Telecom and IT 5.5.1.4.3 Retail and Consumer Goods 5.5.1.4.4 Healthcare and Life Sciences 5.5.1.4.5 Manufacturing 5.5.1.4.6 Government and Defense 5.5.1.4.7 Energy and Utilities 5.5.1.4.8 Transportation and Logistics 5.5.1.4.9 Media and Entertainment 5.5.1.4.10 Others 5.5.2 Canada 5.5.2.1 Canada Augmented Analytics Market Size and Forecast, by Component (2023-2030) 5.5.2.1.1 Software 5.5.2.1.2 Services 5.5.2.2 Canada Augmented Analytics Market Size and Forecast, by Organisation Size (2023-2030) 5.5.2.2.1 Large Enterprises 5.5.2.2.2 Small and Medium-Sized Enterprises 5.5.2.3 Canada Augmented Analytics Market Size and Forecast, by Deployment Mode (2023-2030) 5.5.2.3.1 On-Premise 5.5.2.3.2 Cloud 5.5.2.4 Canada Augmented Analytics Market Size and Forecast, by Vertical Banking (2023-2030) 5.5.2.4.1 Financial Services, and Insurance 5.5.2.4.2 Telecom and IT 5.5.2.4.3 Retail and Consumer Goods 5.5.2.4.4 Healthcare and Life Sciences 5.5.2.4.5 Manufacturing 5.5.2.4.6 Government and Defense 5.5.2.4.7 Energy and Utilities 5.5.2.4.8 Transportation and Logistics 5.5.2.4.9 Media and Entertainment 5.5.2.4.10 Others 5.5.3 Mexico 5.5.3.1 Mexico Augmented Analytics Market Size and Forecast, by Component (2023-2030) 5.5.3.1.1 Software 5.5.3.1.2 Services 5.5.3.2 Mexico Augmented Analytics Market Size and Forecast, by Organisation Size (2023-2030) 5.5.3.2.1 Large Enterprises 5.5.3.2.2 Small and Medium-Sized Enterprises 5.5.3.3 Mexico Augmented Analytics Market Size and Forecast, by Deployment Mode (2023-2030) 5.5.3.3.1 On-Premise 5.5.3.3.2 Cloud 5.5.3.4 Mexico Augmented Analytics Market Size and Forecast, by Vertical Banking (2023-2030) 5.5.3.4.1 Financial Services, and Insurance 5.5.3.4.2 Telecom and IT 5.5.3.4.3 Retail and Consumer Goods 5.5.3.4.4 Healthcare and Life Sciences 5.5.3.4.5 Manufacturing 5.5.3.4.6 Government and Defense 5.5.3.4.7 Energy and Utilities 5.5.3.4.8 Transportation and Logistics 5.5.3.4.9 Media and Entertainment 5.5.3.4.10 Others 6. Europe Augmented Analytics Market Size and Forecast by Segmentation (By Value) (2023-2030) 6.1 Europe Augmented Analytics Market Size and Forecast, by Component (2023-2030) 6.2 Europe Augmented Analytics Market Size and Forecast, by Organisation Size (2023-2030) 6.3 Europe Augmented Analytics Market Size and Forecast, by Deployment Mode (2023-2030) 6.4 Europe Augmented Analytics Market Size and Forecast, by Vertical Banking (2023-2030) 6.5 Europe Augmented Analytics Market Size and Forecast, by Country (2023-2030) 6.5.1 United Kingdom 6.5.1.1 United Kingdom Augmented Analytics Market Size and Forecast, by Component (2023-2030) 6.5.1.2 United Kingdom Augmented Analytics Market Size and Forecast, by Organisation Size (2023-2030) 6.5.1.3 United Kingdom Augmented Analytics Market Size and Forecast, by Deployment Mode (2023-2030) 6.5.1.4 United Kingdom Augmented Analytics Market Size and Forecast, by Vertical Banking (2023-2030) 6.5.2 France 6.5.2.1 France Augmented Analytics Market Size and Forecast, by Component (2023-2030) 6.5.2.2 France Augmented Analytics Market Size and Forecast, by Organisation Size (2023-2030) 6.5.2.3 France Augmented Analytics Market Size and Forecast, by Deployment Mode (2023-2030) 6.5.2.4 France Augmented Analytics Market Size and Forecast, by Vertical Banking (2023-2030) 6.5.3 Germany 6.5.3.1 Germany Augmented Analytics Market Size and Forecast, by Component (2023-2030) 6.5.3.2 Germany Augmented Analytics Market Size and Forecast, by Organisation Size (2023-2030) 6.5.3.3 Germany Augmented Analytics Market Size and Forecast, by Deployment Mode (2023-2030) 6.5.3.4 Germany Augmented Analytics Market Size and Forecast, by Vertical Banking (2023-2030) 6.5.4 Italy 6.5.4.1 Italy Augmented Analytics Market Size and Forecast, by Component (2023-2030) 6.5.4.2 Italy Augmented Analytics Market Size and Forecast, by Organisation Size (2023-2030) 6.5.4.3 Italy Augmented Analytics Market Size and Forecast, by Deployment Mode (2023-2030) 6.5.4.4 Italy Augmented Analytics Market Size and Forecast, by Vertical Banking (2023-2030) 6.5.5 Spain 6.5.5.1 Spain Augmented Analytics Market Size and Forecast, by Component (2023-2030) 6.5.5.2 Spain Augmented Analytics Market Size and Forecast, by Organisation Size (2023-2030) 6.5.5.3 Spain Augmented Analytics Market Size and Forecast, by Deployment Mode (2023-2030) 6.5.5.4 Spain Augmented Analytics Market Size and Forecast, by Vertical Banking (2023-2030) 6.5.6 Sweden 6.5.6.1 Sweden Augmented Analytics Market Size and Forecast, by Component (2023-2030) 6.5.6.2 Sweden Augmented Analytics Market Size and Forecast, by Organisation Size (2023-2030) 6.5.6.3 Sweden Augmented Analytics Market Size and Forecast, by Deployment Mode (2023-2030) 6.5.6.4 Sweden Augmented Analytics Market Size and Forecast, by Vertical Banking (2023-2030) 6.5.7 Austria 6.5.7.1 Austria Augmented Analytics Market Size and Forecast, by Component (2023-2030) 6.5.7.2 Austria Augmented Analytics Market Size and Forecast, by Organisation Size (2023-2030) 6.5.7.3 Austria Augmented Analytics Market Size and Forecast, by Deployment Mode (2023-2030) 6.5.7.4 Austria Augmented Analytics Market Size and Forecast, by Vertical Banking (2023-2030) 6.5.8 Rest of Europe 6.5.8.1 Rest of Europe Augmented Analytics Market Size and Forecast, by Component (2023-2030) 6.5.8.2 Rest of Europe Augmented Analytics Market Size and Forecast, by Organisation Size (2023-2030). 6.5.8.3 Rest of Europe Augmented Analytics Market Size and Forecast, by Deployment Mode (2023-2030) 6.5.8.4 Rest of Europe Augmented Analytics Market Size and Forecast, by Vertical Banking (2023-2030) 7. Asia Pacific Augmented Analytics Market Size and Forecast by Segmentation (By Value) (2023-2030) 7.1 Asia Pacific Augmented Analytics Market Size and Forecast, by Component (2023-2030) 7.2 Asia Pacific Augmented Analytics Market Size and Forecast, by Organisation Size (2023-2030) 7.3 Asia Pacific Augmented Analytics Market Size and Forecast, by Deployment Mode (2023-2030) 7.4 Asia Pacific Augmented Analytics Market Size and Forecast, by Vertical Banking (2023-2030) 7.5 Asia Pacific Augmented Analytics Market Size and Forecast, by Country (2023-2030) 7.5.1 China 7.5.1.1 China Augmented Analytics Market Size and Forecast, by Component (2023-2030) 7.5.1.2 China Augmented Analytics Market Size and Forecast, by Organisation Size (2023-2030) 7.5.1.3 China Augmented Analytics Market Size and Forecast, by Deployment Mode (2023-2030) 7.5.1.4 China Augmented Analytics Market Size and Forecast, by Vertical Banking (2023-2030) 7.5.2 South Korea 7.5.2.1 S Korea Augmented Analytics Market Size and Forecast, by Component (2023-2030) 7.5.2.2 S Korea Augmented Analytics Market Size and Forecast, by Organisation Size (2023-2030) 7.5.2.3 S Korea Augmented Analytics Market Size and Forecast, by Deployment Mode (2023-2030) 7.5.2.4 S Korea Augmented Analytics Market Size and Forecast, by Vertical Banking (2023-2030) 7.5.3 Japan 7.5.3.1 Japan Augmented Analytics Market Size and Forecast, by Component (2023-2030) 7.5.3.2 Japan Augmented Analytics Market Size and Forecast, by Organisation Size (2023-2030) 7.5.3.3 Japan Augmented Analytics Market Size and Forecast, by Deployment Mode (2023-2030) 7.5.3.4 Japan Augmented Analytics Market Size and Forecast, by Vertical Banking (2023-2030) 7.5.4 India 7.5.4.1 India Augmented Analytics Market Size and Forecast, by Component (2023-2030) 7.5.4.2 India Augmented Analytics Market Size and Forecast, by Organisation Size (2023-2030) 7.5.4.3 India Augmented Analytics Market Size and Forecast, by Deployment Mode (2023-2030) 7.5.4.4 India Augmented Analytics Market Size and Forecast, by Vertical Banking (2023-2030) 7.5.5 Australia 7.5.5.1 Australia Augmented Analytics Market Size and Forecast, by Component (2023-2030) 7.5.5.2 Australia Augmented Analytics Market Size and Forecast, by Organisation Size (2023-2030) 7.5.5.3 Australia Augmented Analytics Market Size and Forecast, by Deployment Mode (2023-2030) 7.5.5.4 Australia Augmented Analytics Market Size and Forecast, by Vertical Banking (2023-2030) 7.5.6 Indonesia 7.5.6.1 Indonesia Augmented Analytics Market Size and Forecast, by Component (2023-2030) 7.5.6.2 Indonesia Augmented Analytics Market Size and Forecast, by Organisation Size (2023-2030) 7.5.6.3 Indonesia Augmented Analytics Market Size and Forecast, by Deployment Mode (2023-2030) 7.5.6.4 Indonesia Augmented Analytics Market Size and Forecast, by Vertical Banking (2023-2030) 7.5.7 Malaysia 7.5.7.1 Malaysia Augmented Analytics Market Size and Forecast, by Component (2023-2030) 7.5.7.2 Malaysia Augmented Analytics Market Size and Forecast, by Organisation Size (2023-2030) 7.5.7.3 Malaysia Augmented Analytics Market Size and Forecast, by Deployment Mode (2023-2030) 7.5.7.4 Malaysia Augmented Analytics Market Size and Forecast, by Vertical Banking (2023-2030) 7.5.8 Vietnam 7.5.8.1 Vietnam Augmented Analytics Market Size and Forecast, by Component (2023-2030) 7.5.8.2 Vietnam Augmented Analytics Market Size and Forecast, by Organisation Size (2023-2030) 7.5.8.3 Vietnam Augmented Analytics Market Size and Forecast, by Deployment Mode (2023-2030) 7.5.8.4 Vietnam Augmented Analytics Market Size and Forecast, by Vertical Banking (2023-2030) 7.5.9 Taiwan 7.5.9.1 Taiwan Augmented Analytics Market Size and Forecast, by Component (2023-2030) 7.5.9.2 Taiwan Augmented Analytics Market Size and Forecast, by Organisation Size (2023-2030) 7.5.9.3 Taiwan Augmented Analytics Market Size and Forecast, by Deployment Mode (2023-2030) 7.5.9.4 Taiwan Augmented Analytics Market Size and Forecast, by Vertical Banking (2023-2030) 7.5.10 Bangladesh 7.5.10.1 Bangladesh Augmented Analytics Market Size and Forecast, by Component (2023-2030) 7.5.10.2 Bangladesh Augmented Analytics Market Size and Forecast, by Organisation Size (2023-2030) 7.5.10.3 Bangladesh Augmented Analytics Market Size and Forecast, by Deployment Mode (2023-2030) 7.5.10.4 Bangladesh Augmented Analytics Market Size and Forecast, by Vertical Banking (2023-2030) 7.5.11 Pakistan 7.5.11.1 Pakistan Augmented Analytics Market Size and Forecast, by Component (2023-2030) 7.5.11.2 Pakistan Augmented Analytics Market Size and Forecast, by Organisation Size (2023-2030) 7.5.11.3 Pakistan Augmented Analytics Market Size and Forecast, by Deployment Mode (2023-2030) 7.5.11.4 Pakistan Augmented Analytics Market Size and Forecast, by Vertical Banking (2023-2030) 7.5.12 Rest of Asia Pacific 7.5.12.1 Rest of Asia Pacific Augmented Analytics Market Size and Forecast, by Component (2023-2030) 7.5.12.2 Rest of Asia Pacific Augmented Analytics Market Size and Forecast, by Organisation Size (2023-2030) 7.5.12.3 Rest of Asia Pacific Augmented Analytics Market Size and Forecast, by Deployment Mode (2023-2030) 7.5.12.4 Rest of Asia Pacific Augmented Analytics Market Size and Forecast, by Vertical Banking (2023-2030) 8. Middle East and Africa Augmented Analytics Market Size and Forecast by Segmentation (By Value) (2023-2030) 8.1 Middle East and Africa Augmented Analytics Market Size and Forecast, by Component (2023-2030) 8.2 Middle East and Africa Augmented Analytics Market Size and Forecast, by Organisation Size (2023-2030) 8.3 Middle East and Africa Augmented Analytics Market Size and Forecast, by Deployment Mode (2023-2030) 8.4 Middle East and Africa Augmented Analytics Market Size and Forecast, by Vertical Banking (2023-2030) 8.5 Middle East and Africa Augmented Analytics Market Size and Forecast, by Country (2023-2030) 8.5.1 South Africa 8.5.1.1 South Africa Augmented Analytics Market Size and Forecast, by Component (2023-2030) 8.5.1.2 South Africa Augmented Analytics Market Size and Forecast, by Organisation Size (2023-2030) 8.5.1.3 South Africa Augmented Analytics Market Size and Forecast, by Deployment Mode (2023-2030) 8.5.1.4 South Africa Augmented Analytics Market Size and Forecast, by Vertical Banking (2023-2030) 8.5.2 GCC 8.5.2.1 GCC Augmented Analytics Market Size and Forecast, by Component (2023-2030) 8.5.2.2 GCC Augmented Analytics Market Size and Forecast, by Organisation Size (2023-2030) 8.5.2.3 GCC Augmented Analytics Market Size and Forecast, by Deployment Mode (2023-2030) 8.5.2.4 GCC Augmented Analytics Market Size and Forecast, by Vertical Banking (2023-2030) 8.5.3 Egypt 8.5.3.1 Egypt Augmented Analytics Market Size and Forecast, by Component (2023-2030) 8.5.3.2 Egypt Augmented Analytics Market Size and Forecast, by Organisation Size (2023-2030) 8.5.3.3 Egypt Augmented Analytics Market Size and Forecast, by Deployment Mode (2023-2030) 8.5.3.4 Egypt Augmented Analytics Market Size and Forecast, by Vertical Banking (2023-2030) 8.5.4 Nigeria 8.5.4.1 Nigeria Augmented Analytics Market Size and Forecast, by Component (2023-2030) 8.5.4.2 Nigeria Augmented Analytics Market Size and Forecast, by Organisation Size (2023-2030) 8.5.4.3 Nigeria Augmented Analytics Market Size and Forecast, by Deployment Mode (2023-2030) 8.5.4.4 Nigeria Augmented Analytics Market Size and Forecast, by Vertical Banking (2023-2030) 8.5.5 Rest of ME&A 8.5.5.1 Rest of ME&A Augmented Analytics Market Size and Forecast, by Component (2023-2030) 8.5.5.2 Rest of ME&A Augmented Analytics Market Size and Forecast, by Organisation Size (2023-2030) 8.5.5.3 Rest of ME&A Augmented Analytics Market Size and Forecast, by Deployment Mode (2023-2030) 8.5.5.4 Rest of ME&A Augmented Analytics Market Size and Forecast, by Vertical Banking (2023-2030) 9. South America Augmented Analytics Market Size and Forecast by Segmentation (By Value) (2023-2030) 9.1 South America Augmented Analytics Market Size and Forecast, by Component (2023-2030) 9.2 South America Augmented Analytics Market Size and Forecast, by Organisation Size (2023-2030) 9.3 South America Augmented Analytics Market Size and Forecast, by Deployment Mode (2023-2030) 9.4 South America Augmented Analytics Market Size and Forecast, by Vertical Banking (2023-2030) 9.5 South America Augmented Analytics Market Size and Forecast, by Country (2023-2030) 9.5.1 Brazil 9.5.1.1 Brazil Augmented Analytics Market Size and Forecast, by Component (2023-2030) 9.5.1.2 Brazil Augmented Analytics Market Size and Forecast, by Organisation Size (2023-2030) 9.5.1.3 Brazil Augmented Analytics Market Size and Forecast, by Deployment Mode (2023-2030) 9.5.1.4 Brazil Augmented Analytics Market Size and Forecast, by Vertical Banking (2023-2030) 9.5.2 Argentina 9.5.2.1 Argentina Augmented Analytics Market Size and Forecast, by Component (2023-2030) 9.5.2.2 Argentina Augmented Analytics Market Size and Forecast, by Organisation Size (2023-2030) 9.5.2.3 Argentina Augmented Analytics Market Size and Forecast, by Deployment Mode (2023-2030) 9.5.2.4 Argentina Augmented Analytics Market Size and Forecast, by Vertical Banking (2023-2030) 9.5.3 Rest Of South America 9.5.3.1 Rest Of South America Augmented Analytics Market Size and Forecast, by Component (2023-2030) 9.5.3.2 Rest Of South America Augmented Analytics Market Size and Forecast, by Organisation Size (2023-2030) 9.5.3.3 Rest Of South America Augmented Analytics Market Size and Forecast, by Deployment Mode (2023-2030) 9.5.3.4 Rest Of South America Augmented Analytics Market Size and Forecast, by Vertical Banking (2023-2030) 10. Global Augmented Analytics Market: Competitive Landscape 10.1 MMR Competition Matrix 10.2 Competitive Landscape 10.3 Key Players Benchmarking 10.3.1 Company Name 10.3.2 Business Segment 10.3.3 End User Segment 10.3.4 Revenue (2023) 10.3.5 Manufacturing Locations 10.4 Market Analysis by Organized Players vs. Unorganized Players 10.4.1 Organized Players 10.4.2 Unorganized Players 10.5 Leading Augmented Analytics Global Companies, by market capitalization 10.6 Market Structure 10.6.1 Market Leaders 10.6.2 Market Followers 10.6.3 Emerging Players 10.7 Mergers and Acquisitions Details 11. Company Profile: Key Players 11.1 Tableau Software (US) 11.1.1 Company Overview 11.1.2 Business Portfolio 11.1.3 Financial Overview 11.1.4 SWOT Analysis 11.1.5 Strategic Analysis 11.1.6 Scale of Operation (small, medium, and large) 11.1.7 Details on Partnership 11.1.8 Regulatory Accreditations and Certifications Received by Them 11.1.9 Awards Received by the Firm 11.1.10 Recent Developments 11.2 MicroStrategy (US) 11.3 Microsoft Corporation (US) 11.4 Birst (US) 11.5 Sisense (US) 11.6 SAS Institute (UK) 11.7 SAP SE (Germany) 11.8 Pyramid Analytics (Netherlands) 11.9 Board International (Switzerland) 11.10 Oracle Corporation (US) 11.11 Qlik (Sweden) 11.12 Yellowfin (Australia) 12. Key Findings and Analyst Recommendations 13. Terms and Glossary
  • INQUIRE BEFORE BUYING