
Dry Natural Gas Market – Global Market Size, Strategic Growth Drivers, Risk Assessment Framework, Regulatory Landscape Review, Competitive Intensity Mapping & Long-Term Industry Outlook to 2030
Overview
The Global Dry Natural Gas Market size was valued at USD 857.44 Billion in 2023 and the total Dry Natural Gas revenue is expected to grow at a CAGR of 7.18 % from 2024 to 2030, reaching nearly USD 1393.15 Billion.
Dry natural gas is methane purified from impurities. It's used for power, heating, and industry due to its cleanliness. Dry gas usually is processed and transported via pipelines to distribution networks and end-users. The rising need for eco-friendly energy fuels the demand for dry natural gas, outshining coal and oil. Its cleaner combustion makes it a preferred choice in power generation. Additionally, increasing industrial reliance on natural gas, prevalent in chemical, food, and metal industries, contributes to its increasing demand. Moreover, the increasing residential and commercial sectors seek natural gas for heating, predicting a rise in demand with population growth and economic growth. The dry natural gas market showing positive growth thanks to the rising demand for clean energy, global economic growth, and evolving technologies in production and transportation, emphasizing a dynamic landscape ahead.
The Russia-Ukraine war has profoundly affected the dry natural gas market with increasing prices and disruptions in global supply chains. The conflict immediately triggered a sharp increase in dry natural gas prices in Europe, doubling or even tripling in some cases. Factors include diminished natural gas exports from Russia the world's largest exporter. The war disrupted global supply chains through sanctions on Russia and damage to critical infrastructure. This turmoil is impacting the global economy, fuelling inflation and challenging business profitability, potentially leading to job losses. The long-term implications suggest a lasting shift in the energy landscape, with European countries likely to decrease reliance on Russian gas and explore renewable alternatives. The war may also expedite advancements in technologies like carbon capture and storage for emissions reduction in natural gas production. While the full ramifications remain uncertain, the Russia-Ukraine war is undeniably reshaping the dry natural gas market with far-reaching consequences. To know about the Research Methodology :- Request Free Sample Report
Dry Natural Gas Market Dynamics:
Increasing demand for electricity
The increasing global demand for electricity drives the dry natural gas market by population growth and growing economies. Dry natural gas noted for its clean-burning efficiency has become significant in generating power for homes, businesses, and industries. The rising demand contributes to rising dry natural gas prices with the average in the United States soaring from $2.70 to $6.02 per thousand cubic feet between 2020 and 2022. This price rise prompts increased investments in dry natural gas production, fostering new facilities and moderating long-term prices. Additionally, rising dry natural gas usage strains existing infrastructure, prompting investments to ensure efficient delivery. The trend is expected to persist, with a 44% increase in global dry natural gas consumption from 2022 to 2050, fuelled by growing demand in Asia and Africa. Also, environmental regulations, technological advancements, and geopolitical factors further shape the dynamic dry natural gas market landscape, emphasizing its evolving significance amid the evolving energy landscape.
Increasing use of natural gas in power generation.
The increasing use of natural gas in power generation is having a significant impact on the dry natural gas market especially the diminishing cost of natural gas rendering it a more economically viable choice for electricity generation compared to coal and oil. Also, environmental regulations further elevate its appeal, as natural gas power plants emit fewer pollutants than their coal counterparts, aligning with the global push for cleaner energy. Additionally, the growth of intermittent renewable energy sources like solar and wind enhances the importance of natural gas, providing a reliable backup when these renewables meet electricity demands. However, environmental challenges, such as environmental concerns surrounding natural gas as a greenhouse gas and the potential ecological impact of extraction are expected to hamper the Dry Natural Gas Market growth through the forecast period.
This transformation in the energy landscape holds implications for the natural gas market. Expected increase in demand likely push prices upward, benefitting producers but potentially raising electricity costs for consumers. The growing demand necessitates substantial investments in infrastructure for transportation and storage. Geopolitically, nations rich in natural gas resources gain influence on the global stage. Balancing these positives and negatives is crucial for informed decision-making in shaping future energy policies. The evolving scenario underscores the need for a comprehensive understanding of the multifaceted impact of natural gas deployment in power generation.
Price Volatility of dry natural gases.
Production in the dry natural gas market is intricately tied to price dynamics. High prices incentivize increased production, boosting supply, while low prices lead to production cutbacks, reducing supply. Demand is equally responsive. Also, high prices decrease demand as consumers shift to alternatives, and low prices stimulate increased consumption. Storage levels play a significant role, in influencing prices such as low storage results in higher prices, while high storage leads to lower prices. Geopolitical events such as conflicts or natural disasters, disrupt supplies, exemplified by the Ukraine-Russia conflict causing a spike in prices.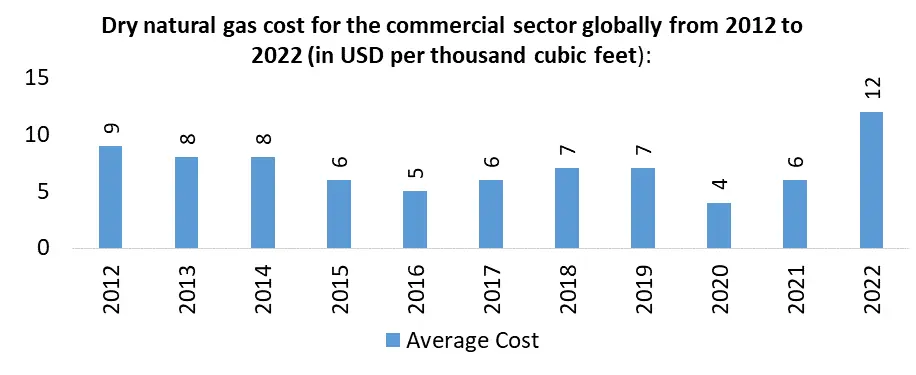 Additionally, Price volatility affects investments as uncertain markets hinder long-term decision-making, potentially leading to a shortage. Consumer’s particularly low-income households, bear the brunt of high prices, contributing to energy poverty. Environmental impacts are also notable, as volatility complicates investment in cleaner technologies, hindering progress towards sustainability. Policymakers and industry leaders must collaboratively devise strategies to mitigate these adverse effects, fostering a stable and sustainable dry natural gas market.
Dry Natural Gas Market Segment Analysis:
Based on the Source, the onshore segment held the largest market share of 65% and dominated the global Dry Natural Gas market in 2023. The onshore segment stands as a significant force in the global energy landscape due to its accessibility, lower production costs, and established infrastructure. It is characterized by lower costs compared to offshore production and onshore exploration benefits from existing pipelines and processing facilities, simplifying transportation and distribution. The dry natural gas industry boasting developed technologies, skilled workforces, and clear regulatory frameworks on onshore gas fields has a historical advantage. Despite environmental concerns such as land use issues and pollution, the segment is driven by the shale gas revolution, technological advancements, and a renewed focus on natural gas for its cleaner-burning attributes. Growing global energy demand further propels onshore production, though challenges like depletion of mature fields, regulatory hurdles, competition from other regions, and technological limitations persist. The onshore segment's outlook remains dominant, contingent on successful exploration, technological progress, and the global energy landscape's evolution, emphasizing the need for environmental responsibility to ensure long-term sustainability. The offshore segment held a market with 35% of the global Dry Natural Gas market in 2023, which is crucial despite its smaller size compared to onshore. While characterized by higher production costs and technical complexity, offshore exploration holds vast potential in deep-water environments. With larger reservoirs and geographic diversification, offshore fields offer long-term production possibilities. Growth drivers include technological advancements, exploration in untapped regions, a rising LNG market, and geopolitical considerations for energy source diversification. Challenges encompass high capital expenditure, technological limitations, environmental concerns, and geopolitical tensions. Despite obstacles, the offshore segment anticipates significant growth, contingent on overcoming challenges and aligning with evolving energy landscapes for sustained long-term viability.
Dry Natural Gas Market Regional Insights:
North America led the global Dry Natural Gas market with the highest market share of 30% in 2023. The region is further expected to grow at a CAGR of 7.7 % and maintain its dominance throughout the forecast period. Dry natural gas is integral to North America's energy landscape as well as in electricity generation, industrial processes, and residential and commercial applications. The dry natural gas market growth is driven by factors such as rising energy demand due to population growth and economic development, natural gas is poised to play a central role. The shift towards cleaner fuels aligns with concerns about climate change, supported by North America's abundant shale gas reserves, ensuring a stable supply. Despite environmental concerns, technological advancements in extraction, transportation, and storage enhance efficiency. Challenges include environmental impact, insufficient pipeline infrastructure, and geopolitical disruptions. The North American natural dry gas market is projected to grow steadily, contingent on sustainable practices, technological progress, and robust infrastructure development. The United States dominates the global dry natural gas in both production and consumption. This supremacy results from a trifecta of factors abundant natural gas reserves nestled in shale formations like the Appalachian and Permian Basins, driven by advanced extraction technologies, especially hydraulic fracturing. The U.S. reinforces its position with a robust infrastructure encompassing pipelines and storage facilities, ensuring seamless transportation and storage. Internally, a substantial demand across sectors, from power generation to residential heating, underscores its significance. On the global stage, the U.S. amplifies its influence by expanding liquefied natural gas (LNG) exports, solidifying its paramount role in the dry natural gas market.
 Canada is the second-largest producer in North America in the global dry natural gas market. Canada plays a significant role in the global dry natural gas market ranking fifth in production and fourth in exports. The Western Canadian Sedimentary Basin primarily in Alberta and British Columbia, contributes the majority of Canada's natural gas. Despite challenges such as declining production from mature fields, the country produced 6,434.85 BCF in 2021. Consumption reached 4,367.41 BCF, with industries and residences being major consumers. Canada exported 2,784.72 BCF mainly to the United States, facing challenges from increased competition and infrastructure limitations. The industry's future hinges on overcoming these hurdles while exploring opportunities in emerging technologies and rising demand for cleaner energy sources.
Dry Natural Gas Market Competitive Landscapes:
The dry natural gas market is expected to be highly competitive active presence of numerous market players. Major companies are striving to introduce sustainable aviation fuels, green hydrogen, and cost-effective e-fuel production processes, promoting overall market growth. In addition, several dry natural gas manufacturers are focused on enhancing and expanding their core business through the launch of additional efficient products to keep up with conventional dry natural gas sales. Key players are adopting various business strategies, including technical partnerships and mergers and acquisitions (M&A) to remain competitive in the dry natural gas market. For instance,
In March 2022, Comisión Federal de Electricidad (CFE), the state-owned electric utility of Mexico, issued direct awards on five projects expected to add 2.26 GW of gas-based power generation capacity. Wartsila was awarded contracts to build two internal combustion engine power plants: the 429 MW CCI Mexicali Oriente plant in Baja California, and the 202 MW CCI Parque Industrial in Sonora. The other three are combined cycle plants: CCC San Luis Potosí (442MW) in CCC San Luis Potosí and the 932MW CCC Salamanca plant in Guanajuato, both awarded to Mitsubishi Power; and finally, CCC El Sauz ll (256MW) in Querétaro, with the contract going to TSK and Siemens Energy. An increase in government investments to innovate and develop various technologies to make natural gas more efficient is projected to have a positive impact on the global dry natural gas market.
These strategic endeavors underscore the dry natural gas industry's commitment to diversifying product lines, innovating within segments, and adopting strategic partnerships to compete effectively in the market landscape. As consumer preferences evolve, these proactive strategies position dry natural gas manufacturers for sustained growth and competitiveness in the energy market.
Dry Natural Gas Market Scope: Inquiry Before Buying
| Dry Natural Gas Market | |||
|---|---|---|---|
| Report Coverage | Details | ||
| Base Year: | 2023 | Forecast Period: | 2024-2030 |
| Historical Data: | 2018 to 2023 | Market Size in 2023: | US $ 857.44 Bn. |
| Forecast Period 2024 to 2030 CAGR: | 7.18% | Market Size in 2030: | US $ 1393.15 Bn. |
| Segments Covered: | by Source | Offshore Onshore |
|
| by End-User | Industrial Power Generation Transportation Residential Commercial Others |
||
Dry Natural Gas Market, by Region:
North America (United States, Canada, and Mexico)
Europe (UK, France, Germany, Italy, Spain, Sweden, Austria, and the Rest of Europe)
Asia Pacific (China, South Korea, Japan, India, Australia, Indonesia, Malaysia, Vietnam, Taiwan, Bangladesh, Pakistan, and the Rest of APAC)
Middle East and Africa (South Africa, GCC, Egypt, Nigeria, and the Rest of ME&A)
South America (Brazil, Argentina Rest of South America)
Dry Natural Gas Market, Key Manufacture:
The Dry Natural Gas market characterized by the diverse key players are involved in various stages of the natural gas supply chain, including exploration, production, transportation, and distribution. These key companies employ diverse variety of growth strategies, such as strategic mergers and acquisitions, significant investments in infrastructure and technology, and expansion into new geographical regions. They also engage in collaborations, partnerships, and joint ventures to enhance their market presence and diversify their product services.
1. China National Petroleum Corporation (China)
2. Sinopec (China)
3. Royal Dutch Shell (Netherlands/United Kingdom)
4. EOG Resources (United States)
5. Chevron (United States)
6. ConocoPhillips (United States)
7. Total Energies (France)
8. Rosneft (Russia)
9. Gazprom (Russia)
10. ExxonMobil (USA)
11. China National Petroleum Corporation (China)
12. Sinopec (China)
13. PetroChina (China)
14. Royal Dutch Shell (UK/Netherlands)
15. Chevron (USA)
16. EOG Resources (USA)
17. ConocoPhillips (USA)
18. Natural Resources Canada (Canada)
FAQs:
1. What are the growth drivers for the market?
Ans. The increasing electricity demand, coupled with Supportive policies, tax incentives, and infrastructure development by governments worldwide are expected to be the major drivers for the Dry Natural Gas market.
2. What are the major trends in the market growth?
Ans. The rise of Electric Vehicles (EVs), Charging Infrastructure Expansion, etc. are expected to be the major trends in the Dry Natural Gas market.
3. Which region is expected to lead the Global market during the forecast period?
Ans. North America is expected to lead the global market during the forecast period thanks to increasingly adopting electrification technologies in the dry natural gas industry.
4. What is the projected market size and growth rate of the market?
Ans. The Global Dry Natural Gas Market size was valued at USD 857.44 billion in 2023 and the total Dry Natural Gas revenue is expected to grow at a CAGR of 7.18 % from 2024 to 2030, reaching nearly USD 1393.15 billion.
5. What segments are covered in the Dry Natural Gas Market report?
Ans. The segments covered in the Dry Natural Gas market report are source, End-user, and Region.