
Cross-Border B2C E-Commerce Market Size by Offering , Category , Payment Method and Region - Segment-Level Market Assessment, Growth Opportunity Analysis, Competitive Mapping & Forecast to 2032
Overview
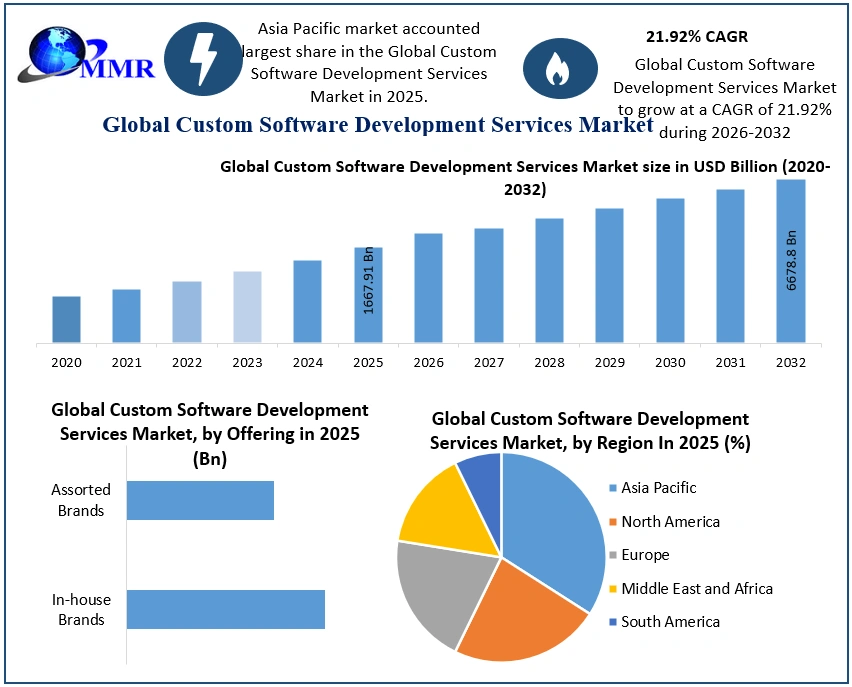
The Cross-Border B2C E-Commerce Market size was valued at USD 1667.91 Billion in 2025 and the total Cross-Border B2C E-Commerce revenue is expected to grow at a CAGR of 21.92% from 2025 to 2032, reaching nearly USD 6678.8 Billion by 2032.
Cross-Border B2C E-Commerce Market Overview:
Cross-border B2C e-commerce includes trading across global borders, where businesses operate in multiple countries using online platforms to conduct transactions and ship goods globally through B2C logistics. These platforms allow small and medium-sized enterprises (SMEs) to reach both domestic and worldwide consumers, creating growth opportunities. Such as, Data Catalyst estimates that about 70% of American SMEs utilize their web shop or a third-party online marketplace, with many opting for multiple markets. Accordingly, the Cross-Border B2C E-Commerce Market is expected to improve over the forecast period thanks to the growing demand for services that connect customers with suppliers, facilitate ordering, and manage goods delivery.
 According to MMR, Physical Goods in Global Cross-Border B2C E-Commerce Market was nearly 651.99 billion in the year 2022 and is expected to reach USD 3813.42 Billion by 2029. The growth of physical goods in the global cross-border b2c e-commerce market is driven by factors such as the growing penetration of internet and smartphone usage, rising consumer confidence in online shopping, and the expansion of efficient global logistics networks. Furthermore, the proliferation of online marketplaces and the growing trend of SMEs leveraging e-commerce platforms to reach international consumers further contribute to cross-border b2c e-commerce market's growth.
Cross-Border B2C E-Commerce Market Dynamics:
The primary factor driving the growth of the Cross-Border B2C E-Commerce Market is the growing young metropolitan population that relies heavily on technology. The rising internet and smartphone penetration is estimated to propel the market's growth, as most millennials use smartphones and tablets to order goods. The Cross-Border B2C E-Commerce Market is further driven by the rising preference for online purchasing, influenced by social media platforms' impact on shopping habits. Furthermore, the unavailability of certain products in domestic regions is expected to boost cross-border B2C e-commerce.
The availability of higher quality goods at affordable costs is driving the cross-border B2C e-commerce market's growth. Moreover, Cross-Border B2C E-Commerce provides considerable benefits to small and medium-sized enterprises (SMEs) to expand their businesses. The rising digital adoption index globally is also expected to provide significant growth opportunities for the cross-border B2C e-commerce. Digital adoption measures the region's integration of digital technology across various sectors, including government, people, and business. Businesses are leveraging digital transformation to increase their footprints across different regional markets.
To know about the Research Methodology :- Request Free Sample Report
Trends in Cross-Border B2C E-Commerce Delivery: Balancing Consumer and Brand Expectations
There are both similarities and differences between consumers and brands regarding values in the Market delivery experience. Customers primarily seek fast delivery, low shipping costs, and an easy returns process. The E-commerce landscape has enhanced the importance of speed, with 90% of consumers now expecting two-to-three-day domestic shipping and five-to-seven-day international shipping. Furthermore, 32% of global shoppers are willing to abandon their carts if they believe the estimated shipping time is too long, a shift largely attributed to the "Amazon effect" and its business model based on fast, free shipping. Consequently, customers expect a similar experience from other retailers, involving cross-border transactions.
In addition to speed, customers also prioritize low shipping costs and easy returns, which can place a burden on brands. Nearly 10% of consumers returned all or part of their recent cross-border e-commerce purchases, with 75% opting for free returns and 23% paying for the return. The highest return rates were observed in China (25%), New Zealand and Switzerland (22%), and the US (21%). Currently, maintaining low shipping costs and offering free or low-cost returns in the cross-border b2c e-commerce market is increasingly challenging due to inflation, unpredictable fuel prices, and rising labour costs.
Cross-Border B2C E-Commerce Market Segment Analysis:
Based on offering, Market is segmented into In-house Brands, Assorted Brands. The Assorted Brands segment was holding a larger share nearly 70.32% of the Cross-Border B2C E-Commerce market compared to the In-house Brands segment in the year 2025. Assorted brands offer a wide selection of products to e-commerce retailers. This allows them to meet the needs of a wider range of customers. Assorted Brands segment was xx Billion in the year 2022 and is expected to reach USD xx Billion by 2032 at a CAGR of 22.03% during the forecast period.
In terms of Category, The Apparel & Accessories segment held the largest cross-border B2C e-commerce market share of nearly 29.77% of the global revenue in 2025 and is expected to maintain its dominance in the forecast period. Cross-border e-commerce allows consumers to explore and purchase fashion apparel, clothing accessories, jewellery, and fashion-related products from international brands and retailers.
This category offers consumers access to diverse fashion choices and unique styles from around the world. Entertainment & Education category includes products such as books, e-books, online streaming services, video games, and digital media content. Consumers can access a wide range of entertainment and educational products from international sellers through cross-border e-commerce platforms. The consumer electronics category covers a wide range of products, including smartphones, tablets, laptops, cameras, audio devices, and other electronic gadgets. Cross-border e-commerce enables consumers to access the latest technology and electronic devices from international sellers, often at competitive prices.
By payment method, the Credit/Debit Cards segment held the largest market hare with market size of USD xx billion in 2025. Credit and debit cards remain one of the most widely used payment methods in cross-border e-commerce. Consumers can make purchases by entering their card details, including card number, expiry date, and CVV code, during the checkout process. Major card networks like Visa, Mastercard, American Express, and Discover are commonly accepted by international merchants. However, Digital Wallets is expected to grow at the highest CAGR of 22.77% over 2025-2032. Digital wallets offer a convenient and secure way to make payments, and they are accepted by a wide range of merchants.
Cross-Border B2C E-Commerce Market Regional Analysis:
Geographically, in 2025 Asia Pacific dominated the cross-border B2C e-commerce market and accounted for a largest share of over 46.25% of the global revenue with market size of USD xx billion. During the forecast period, the growth of the regional market is expected to be driven by the increasing international trade relations in the area. An example of this is the strengthened free trade agreement between China and New Zealand, which is a result of their positive trade relations. This trade pact facilitates faster export procedures, broader market access, and the expansion of tariff-free programs. As a result, such trade agreements have a significant impact on industry growth in the forecast period.
North America cross-border B2C e-commerce market is expected to grow at the highest CAGR of 22.45% over forecast period. This growth is attributable to the growing demand for reasonably priced, high-quality products. Furthermore, this region's high Price Level Index (PLI) contributes significantly to the regional market growth as it allows customers to shop for a product at an affordable rate. For example, the PLI of the U.S. is 113 and China is 59; this allows regional shoppers to get lower prices domestically.
Cross-Border B2C E-Commerce Market: Competitive Insights
The major market players are investing a lot of money in R&D to expand their product lines, which will spur further Market growth. With significant market development like new product releases, contractual agreements, M&A, increased investments, and collaboration with other organizations, Market participants are also undertaking various strategic activities to expand their global presence. To grow and thrive in a market climate that is becoming more competitive and growing, competitors in the Cross-Border B2C E-Commerce industry must offer affordable products. Such as, In Feb 2023, eBay Inc. acquired 3PM Shield to bolster its monitoring solutions and prevent the sale of counterfeit and illegal products. This acquisition aims to enhance eBay's capabilities with new technologies specifically designed to detect and block counterfeit items, unsafe products, and illegal goods on its platform.
Cross-Border B2C E-Commerce Market Scope: Inquiry Before Buying
| Global Cross-Border B2C E-Commerce Market | |||
|---|---|---|---|
| Report Coverage | Details | ||
| Base Year: | 2025 | Forecast Period: | 2026-2032 |
| Historical Data: | 2020 to 2025 | Market Size in 2025: | USD 1667.91Bn. |
| Forecast Period 2026 to 2032 CAGR: | 21.92% | Market Size in 2032: | USD 6678.8 Bn. |
| Segments Covered: | by Offering | In-house Brands Assorted Brands |
|
| by Category | Entertainment & Education Apparel & Accessories Consumer Electronics Home Furnishing Personal Care & Beauty Healthcare & Nutrition Footwear Food & Beverage Others |
||
| by Payment Method | Digital Wallets Credit/Debit Cards Internet Banking Others |
||
| by Type | Product Physical Product Digital Product Services |
||
Cross-Border B2C E-Commerce Market, by Region
North America (United States, Canada and Mexico)
Europe (UK, France, Germany, Italy, Spain, Sweden, Austria and Rest of Europe)
Asia Pacific (China, South Korea, Japan, India, Australia, Indonesia, Malaysia, Vietnam, Taiwan, Bangladesh, Pakistan and Rest of APAC)
Middle East and Africa (South Africa, GCC, Egypt, Nigeria and Rest of ME&A)
South America (Brazil, Argentina Rest of South America)
Cross-Border B2C E-Commerce Market, Key Players:
1. Amazon.com Inc.. - USA
2. Etsy Inc. - USA
3. eBay Inc. - USA
4. Alibaba Group - China
5. Wish Inc. - USA
6. Vee Pee - France
7. Cnova - Netherlands
8. Asos Plc - United Kingdom
9. Fruugo - United Kingdom
10. JD.com (Jing Dong) - China
11. Apple Inc. - USA
12. DHL Group - Germany
13. Box Me - Vietnam
14. PayPal - USA
15. Asia Commerce - Indonesia
16. SingPost - Singapore
17. Shipping Cart - Philippines
18. Anchanto - Singapore
19. SIA Joom (Latvia) - Latvia
20. Zalando - Germany
FAQs:
1] What segments are covered in the Global Market report?
Ans. The segments covered in the Market report are based on Offering, Category, Payment Method, Type and Region.
2] Which region is expected to hold the highest share in the Global Market?
Ans. APAC region is expected to hold the highest share of the Market.
3] What is the market size of the Global Market by 2032?
Ans. The market size of the Market by 2032 is expected to reach USD 6678.8 Bn.
4] What is the forecast period for the Global Market?
Ans. The forecast period for the Market is 2026-2032.
5] What was the market size of the Global Market in 2025?
Ans. The market size of the Market in 2025 was valued at USD 1667.91 Bn.