
Blue Hydrogen Market Size by Technology, Type, Transportation Mode, End-User, Region – Revenue Pool Analysis, Margin Structure Assessment, Capital Flow Trends, Competitive Benchmarking & Forecast to 2034
Overview
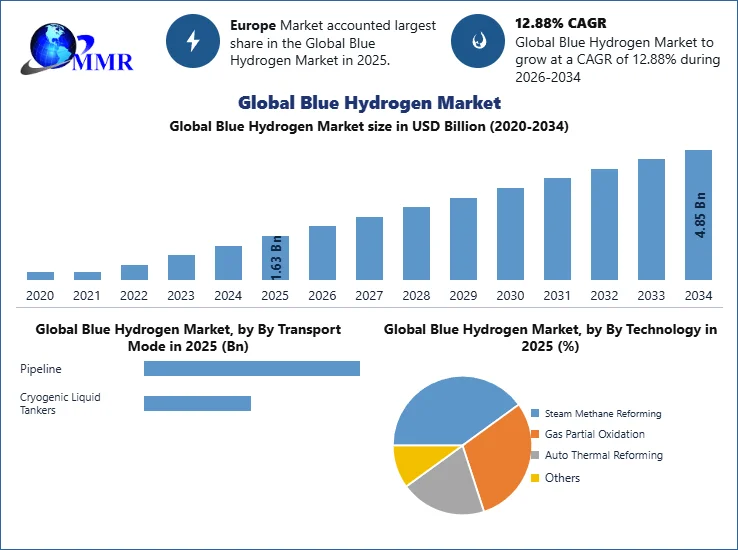
The Blue Hydrogen Market size was valued at USD 1.63 Billion in 2025, and the total Blue Hydrogen revenue is expected to grow at a CAGR of 12.89% from 2025 to 2034, reaching nearly USD 4.85 Billion by 2034.
Blue Hydrogen Market Overview
Blue hydrogen refers to low-carbon hydrogen that is derived from natural gas via steam methane reforming (SMR) or autothermal reforming (ATR) processes in combination with CCUS (carbon capture, utilization, and storage) technology. In the course of its generation, natural gas is subjected to reactions with hot steam using a catalyst for creating hydrogen and carbon monoxide. Further, carbon monoxide undergoes conversion into carbon dioxide and more hydrogen in a water-gas shift reaction. In contrast to regular grey hydrogen, much of the carbon dioxide created during production is captured and used/stored, which makes blue hydrogen less polluting than other kinds of hydrogen fuels.
The Blue Hydrogen Market is growing at a fast pace owing to rising investments in hydrogen networks, favorable policies of the government, and high demand for sustainable energy in various sectors. Blue hydrogen is commonly utilized in the sectors of refining, chemical manufacturing, power generation, steel manufacturing, ammonia manufacturing, and heavy transport for enabling industrial decarbonization and reaching net-zero emissions goals. Rising utilization of carbon capture facilities, technological advancements in hydrogen manufacturing methods, and the setting up of hydrogen hubs are contributing to market growth even more. With countries becoming increasingly ambitious about their hydrogen strategies and plans for energy transition, the global blue hydrogen market is expected to grow considerably in coming years.
To know about the Research Methodology :- Request Free Sample Report
Blue Hydrogen Market Dynamics
Clean Hydrogen production to boost the Blue Hydrogen Market growth
The growing adoption of FCVs, especially for use in the heavy-duty segment, will contribute to the growth of the blue hydrogen market during the forecast period. Hydrogen fuel cells provide zero tailpipe emissions and have long ranges and quick refueling, which makes them ideal for buses, trucks, trains, and other commercial vehicles. As per the International Energy Agency (IEA), hydrogen consumption was estimated at XX million tonnes (Mt) in 2025, with transportation becoming an important area of growth for hydrogen as government investments in hydrogen and low-carbon mobility solutions continue.
North American, European, and Asia-Pacific governments are rapidly adopting hydrogen through financial incentives, hydrogen roadmaps, and construction of refueling stations. As stated by the Hydrogen Council, the pipeline for hydrogen projects globally is expanding with the amount of invested capital rising considerably as various nations strive for net-zero emissions and decarbonization of industries. Increasing deployments of hydrogen-powered commercial vehicles, along with supportive policies, will result in growing demand for blue hydrogen during the forecast period.
The primary impetus for the blue hydrogen market stems from the escalating demand for clean and sustainable energy sources. Clean hydrogen production methods, as exemplified by blue hydrogen projects, strive to mitigate the carbon emissions linked to hydrogen production. As global efforts intensify to decarbonize and curtail greenhouse gas emissions, the quest for cleaner hydrogen production methods becomes paramount. Advancements in hydrogen fuel technology are rapidly unfolding, with blue hydrogen playing a pivotal role in this evolution. It serves as a linchpin in the development of more environmentally friendly and efficient hydrogen fuel systems, thus fostering the expansion of the hydrogen economy. As hydrogen fuel technology matures and garners broader acceptance, the appeal of blue hydrogen as a clean and dependable energy source surges.
The execution of blue hydrogen projects, characterized by the capture and storage of carbon emissions generated during hydrogen production, constitutes a significant driving force in the market. These projects offer a sustainable and ecologically responsible approach to hydrogen production. Government bodies, industries, and research institutions are actively investing in and endorsing these initiatives to expedite the adoption of blue hydrogen. The development of advanced blue hydrogen production methods is pivotal for the market's expansion. Ongoing research and innovation in hydrogen production techniques, such as steam methane reforming with carbon capture and storage (SMR-CCS), amplifies the efficiency and sustainability of blue hydrogen production. These methods are instrumental in rendering blue hydrogen more economically viable and environmentally friendly.
The establishment of a robust network of blue hydrogen fueling stations is a fundamental driver for market growth. As the utilization of hydrogen as a clean energy carrier gains traction, the presence of a dependable refueling infrastructure is indispensable. These fueling stations facilitate the widespread adoption of hydrogen-powered vehicles and equipment, propelling the market's expansion as a green transportation fuel.
Challenges in Blue Hydrogen Production Methods to restraint the Blue Hydrogen Market growth
The complexity and cost associated with advanced Blue Hydrogen Production Methods is a major restraint of the Blue Hydrogen Industry. While these methods contribute to reducing carbon emissions, their implementation can be technically challenging and financially demanding. This complexity can hinder the widespread adoption of blue hydrogen, especially in regions where infrastructure and resources for carbon capture and storage are limited. The limited infrastructure of Blue Hydrogen Fueling Stations presents a notable constraint. For hydrogen to be a practical transportation fuel, a comprehensive network of refueling stations is required. The relatively low number of blue hydrogen fueling stations compared to traditional fossil fuel stations can restrict the accessibility and adoption of hydrogen-powered vehicles. This constraint needs to be addressed to promote the broader use of blue hydrogen in the transportation sector.
Within the broader energy market, blue hydrogen competes with other energy sources and technologies, including green hydrogen and fossil fuels. The ongoing evolution and expansion of alternative energy solutions can create challenges for blue hydrogen in terms of market share and consumer adoption. The energy market's diverse offerings make it essential for blue hydrogen to continuously prove its economic and environmental competitiveness. The cost of blue hydrogen production, including the expenses associated with carbon capture and storage, can be a significant restraint. While blue hydrogen offers environmental benefits, cost-effectiveness remains a critical factor for market acceptance. The economic feasibility of blue hydrogen in comparison to other energy sources influences its adoption, especially in price-sensitive markets.
Blue Hydrogen Market Segmentation
Based on Technology, the market is segmented into Steam Methane Reforming, Gas Partial Oxidation, and Auto Thermal Reforming. Steam methane reforming segment is dominated the market in 2023 and is expected to hold the largest Blue Hydrogen market share over the forecast period. The Steam Methane Reforming (SMR) segment within the Blue Hydrogen Market is instrumental in driving forward the objectives of Clean Hydrogen Production, hydrogen fuel technology, and the realization of Blue Hydrogen Projects. SMR stands as a prominent method for Clean Hydrogen Production.
This technique involves the conversion of natural gas into hydrogen while concurrently capturing and potentially storing carbon emissions. SMR aligns seamlessly with the industry's commitment to reducing carbon footprints and championing clean energy sources. Steam methane reforming is frequently integrated into the framework of Blue Hydrogen Projects. These visionary endeavors are engineered to yield hydrogen with markedly reduced carbon emissions by synergizing SMR with cutting-edge carbon capture and storage (CCS) technologies. The triumphant utilization of SMR in these projects plays a pivotal role in realizing the goals of Blue Hydrogen Projects, which aspire to offer a cleaner and environmentally conscientious approach to hydrogen production.

Based on End user, the market is segmented into Chemical, Refinery, Power Generation, and Others. Power generation segment held the largest Blue Hydrogen Market share in 2023 and is expected to dominate the market over the forecast period. The Power Generation segment within the Blue Hydrogen Market is a pivotal component that fosters the growth and sustainability of the broader Blue Hydrogen Energy Market. This segment is intricately linked with the establishment of an extensive network of Blue Hydrogen Fueling Stations and plays a central role in fulfilling the energy requirements of diverse sectors.

To facilitate the adoption of blue hydrogen as a power generation fuel source, the presence of a robust network of Blue Hydrogen Fueling Stations is indispensable. These stations serve as the linchpin for the efficient distribution and delivery of blue hydrogen, making it readily available for a wide array of applications, including power generation. The existence of these fueling stations is pivotal in propelling hydrogen into the forefront as a clean and dependable energy carrier for power generation needs.
Based on Transport Mode: The market is divided into Pipeline and Cryogenic Liquid Tankers segments. The Pipeline segment held the largest share of the Blue Hydrogen Market and is projected to continue dominating the market during the forecast period. Pipelines are considered to be the most cost-effective and efficient way of transporting large quantities of hydrogen in relatively shorter distances and between production sites, industrial zones, refineries, power plants, and hydrogen hubs. The increasing adoption of pipelines for the transport of hydrogen along with investments made in developing hydrogen pipeline network, repurposing of natural gas pipeline, and expansion of hydrogen infrastructure under national hydrogen strategies have aided the growth of this segment. On the other hand, Cryogenic Liquid Tankers are highly effective in the transportation of liquefied hydrogen through longer distances and regions which do not have pipeline connectivity.
On the Basis of Types: The market can be segmented into Ammonia, Methanol, and Others. The Ammonia segment is projected to have the highest Blue Hydrogen Market share in 2025. Ammonia production is one of the major uses of hydrogen, making blue hydrogen an important low-carbon feedstock for the production of fertilizers and industrial chemicals. Increasing demand for sustainable fertilizers, increasing investment in blue ammonia plants, and increasing usage of ammonia as a hydrogen carrier are some of the major factors contributing to the growth of the segment. On the other hand, the Methanol segment is registering continuous growth owing to increasing demand for low-carbon methanol in chemical manufacturing and marine fuel applications. Additionally, the Others segment, which comprises synthetic fuels and specialty chemicals, is projected to grow owing to the adoption of blue hydrogen in reducing carbon emissions.
Blue Hydrogen Market Regional Insight
The leading edge of imposing projects in Europe to boost the Blue Hydrogen Market growth
Europe leads the charge in the Blue Hydrogen Energy Market, holding a dominant 32.8% share, with rapid growth projected for the forecast period. The European region has been at the forefront of implementing progressive projects and regulations aimed at reducing greenhouse gas emissions. Almost all member states of the European Union (EU) have recognized the pivotal role of hydrogen in their regional energy and environmental policies, setting specific targets for hydrogen-based initiatives, particularly in the transportation sector. The European Union, in a significant move, introduced the EU Hydrogen Strategy in July 2022, which aims to bolster the development of clean hydrogen.
Simultaneously, the establishment of the European Clean Hydrogen Alliance serves as a collaborative platform that unites markets, public authorities, and civil society to coordinate investments in the sector. Furthermore, the EU actively supports research and innovation projects related to hydrogen through programs such as Horizon 2022 and Horizon Europe (2025-2032). The management of hydrogen initiatives is overseen by the Fuel Cell and Hydrogen Joint Venture (FCH JU), a public-private partnership with backing from the European Commission. The emergence of new startups in the region is poised to drive increased investment in blue hydrogen projects, fostering revenue growth within the regional markets.
The Asia-Pacific Blue Hydrogen Market is expected to experience substantial growth, driven by escalating demand for hydrogen in key industries like chemicals, fertilizers, and refineries, particularly in countries such as China, India, and South Korea. Notably, China leads both hydrogen consumption and production globally, with an annual consumption exceeding 24 million tonnes.
In the Middle East and Africa, the markets are set to witness rapid growth in sales with a favorable CAGR during the forecast period. The region's vast reserves of natural gas, the primary source for blue hydrogen production, fuel this growth. Heightened awareness of environmental concerns and a transition to green energy alternatives contribute to the positive trajectory of the blue hydrogen market in the Middle East and Africa. Several governments in the region have launched initiatives aimed at achieving zero emissions, with significant investments directed towards blue hydrogen production. For instance, the Saudi Arabian government is on track to become the first global exporter of blue hydrogen, marking a pivotal natural gas project's transition to green energy.
A substantial portion of the US$110 billion Jafurah development project focuses on blue hydrogen production. Similarly, the Abu Dhabi National Oil Co., a state-owned entity, has partnered with Mubadala Investment Co. and ADQ to create two sovereign wealth funds dedicated to the production and export of blue and green hydrogen. The Abu Dhabi National Oil Company's independent blue hydrogen development plans involve transitioning away from natural gas while capturing carbon dioxide emissions.
In North America, a stable CAGR is anticipated for the Blue Hydrogen Market during the forecast period, propelled by the rapidly growing demand for blue hydrogen. An increasing number of companies are engaged in the production and distribution of alternative clean energies, including blue hydrogen. Technological advancements and significant government investments across various regional countries are expected to drive profit growth in the market.
Blue Hydrogen Market Competitive Landscape
Companies within the Blue Hydrogen Market consistently push the boundaries of innovation to develop and implement advanced technologies that optimize the production, storage, and utilization of blue hydrogen. These innovations drive efficiency, sustainability, and cost-effectiveness. Collaborations and strategic partnerships are commonplace in this sector. These alliances bring together companies, research institutions, and public entities to jointly propel blue hydrogen projects, ensuring a coordinated and efficient approach to their development. Governments worldwide play a substantial role in advocating blue hydrogen as a clean energy solution. Various nations introduce policies, incentives, and funding opportunities to encourage the growth and adoption of blue hydrogen technologies.
From the competitive structure, it is evident that the Blue Hydrogen market is characterized by significant concentration and dominated by major energy integrated firms and industrial gases companies through five competitive parameters: Product Portfolio, Promotion, Technology, Research and Development Strength, and Application Diversity. Shell emerges as having the most favorable competitive position among the firms considered because it ranks highest in the categories of Product Portfolio, Technology, Promotion, and Research and Development Strength owing to its large project portfolio and integrated value chain of blue hydrogen projects. Air Products & Chemicals and Linde Plc are not too far behind and showcase significant capability in terms of product development, hydrogen production technology, and successful execution of projects globally. Air Liquide and BP Plc have performed well on all fronts owing to their investments in hydrogen hubs, carbon capture technology, and industrial projects.
The second level includes Equinor ASA, TotalEnergies, Saudi Aramco, Technip Energies, and Reliance Industries, all having their specific competitive advantages. The companies Equinor ASA and TotalEnergies possess advanced technology and R&D capacities owing to their decarbonization and CCUS projects, and the company Saudi Aramco has gained an advantage through its natural gas activities in the upstream segment and hydrogen investments. At the same time, Technip Energies has managed to differentiate itself from competitors with its technologies in engineering, EPC and hydrogen processing instead of having various products, while Reliance Industries has been increasing its hydrogen business through investments and collaborations. In terms of Application Variation, most leaders have consistently high scores, meaning that almost all competitors are engaged in offering hydrogen applications to a variety of sectors such as refineries, chemicals, electricity production, mobility and industrial sectors.

Blue Hydrogen Industry Ecosystem
Blue Hydrogen Market Scope: Inquire before buying
| Blue Hydrogen Market | |||
|---|---|---|---|
| Report Coverage | Details | ||
| Base Year: | 2025 | Forecast Period: | 2026-2034 |
| Historical Data: | 2020 to 2025 | Market Size in 2025: | USD 1.63 Bn. |
| Forecast Period 2026 to 2032 CAGR: | 12.89% | Market Size in 2034: | USD 4.85 Bn. |
| Segments Covered: | by Technology | Steam Methane Reforming Gas Partial Oxidation Auto Thermal Reforming |
|
| by Type | Ammonia Methanol Others |
||
| by Transportation Mode | Pipeline Cryogenic Liquid Tankers |
||
| by End-User | Chemical Refinery Power Generation Others |
||
Blue Hydrogen Market, by Region
North America (United States, Canada and Mexico)
Europe (UK, France, Germany, Italy, Spain, Sweden, Austria and Rest of Europe)
Asia Pacific (China, South Korea, Japan, India, Australia, Indonesia, Malaysia, Vietnam, Taiwan, Bangladesh, Pakistan and Rest of APAC)
Middle East and Africa (South Africa, GCC, Egypt, Nigeria and Rest of ME&A)
South America (Brazil, Argentina Rest of South America)
Blue Hydrogen Key Players Include
- Shell Plc
- Air Products & Chemicals
- Linde plc
- Air Liquide
- BP plc
- Equinor ASA
- TotalEnergies
- Reliance Industries
- Dastur Energy
- Aker Solutions
- Exxon Mobile Corporation
- Uniper SE
- TOPSOE
- Acquaterra Energy limited
- Petrofac Limited
- ENI
- Johnson Matthey
- Technip Energies N.V.
- Engie
- Thyssenkrupp AG
- INEOS
- The state Atomic Energy Corporation
- Xebec Adsorption Inc (Pax Solution)
- Bechtel Corporation
- John Wood Group
- ATCO ltd
- Saudi Arabian Oil company
- Siemens Energy
- Saipem
- SK E&S
- Woodside
- Others
Frequently Asked Questions:
1. What is blue hydrogen, and how is it produced?
Ans: Blue hydrogen is produced from natural gas through a process called steam methane reforming (SMR). In this process, natural gas is mixed with hot steam and a catalyst, leading to a chemical reaction that generates hydrogen and carbon monoxide. By adding water to this mixture, carbon monoxide is converted into carbon dioxide, resulting in "Blue Hydrogen." It is considered carbon-neutral when associated carbon emissions are captured and stored underground.
2. How does blue hydrogen contribute to reducing carbon emissions and combating climate change?
Ans: Blue hydrogen production involves capturing and storing carbon dioxide emissions, making it a cleaner alternative to grey hydrogen. By mitigating carbon emissions, blue hydrogen aligns with global efforts to reduce greenhouse gas emissions and address climate change, playing a pivotal role in the transition to sustainable hydrogen production.
3. What are the key drivers for the growth of the blue hydrogen market?
Ans: The growth of the blue hydrogen market is driven by the increasing emphasis on clean hydrogen production, advancements in hydrogen fuel technology, blue hydrogen projects, and the establishment of blue hydrogen fueling stations. The adoption of hydrogen in fuel cell vehicles also contributes to the market's growth.
4. Which regions are leading in the adoption of blue hydrogen and why?
Ans: Europe is at the forefront of blue hydrogen adoption, with significant projects and regulations focused on reducing greenhouse gas emissions. The Asia-Pacific region is experiencing rapid growth due to increased demand in key industries, while the Middle East and Africa regions are benefiting from substantial reserves of natural gas and a shift towards green energy alternatives.
5. What is the current global production capacity and consumption of blue hydrogen?
Ans: Currently, approximately 120 megatons of hydrogen are produced annually, with 75 megatons being pure hydrogen. The rest is mixed with other gases, primarily carbon monoxide (CO) in syngas (synthetic gas). The production of blue hydrogen continues to grow as its demand increases in various sectors.