3d Stacking Market: Global Industry Analysis and Forecast (2024-2030)

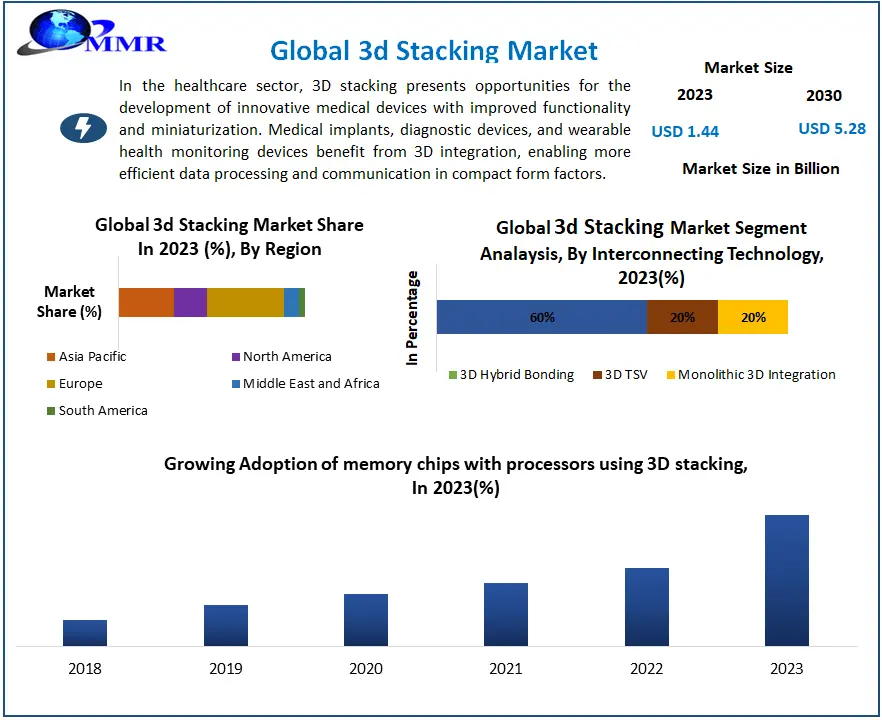
The 3d Stacking Market size was valued at USD 1.44 Billion in 2023 and the total 3d Stacking revenue is expected to grow at a CAGR of 20.4 % from 2024 to 2030, reaching nearly USD 5.28 Billion in 2030.

3d Stacking Market Overview

The MMR report provides a detailed analysis of 3D Stacking technology, and its significance across various industries, and outlines the objectives and scope of the study. The analysis of the market includes the global market size, growth projections, drivers, challenges, opportunities, and recent trends. It also offers an overview of 3D Stacking techniques in the technology landscape, detailing their advantages, limitations, and emerging innovations. Also, the report examines market segmentation by technology, application, end-user, and region, with a detailed analysis of each segment's market size, growth, and potential. It also provides a detailed examination of key application areas, market trends, drivers, and challenges, along with insights from end-user industries, including requirements, challenges, and adoption trends. The increasing demand for high-density, high-bandwidth memory, such as 3D NAND flash and HBM, drives significant investment. Emerging applications such as automotive electronics, AR/VR gadgets, and AI accelerators provide significant opportunities. Investing in technology improvements such as TSVs, interface innovations, and innovative materials can yield large benefits. Additionally, supporting infrastructure, design tools, and standardization projects in the ecosystem development space offer significant investment opportunities. These developments highlight a dynamic environment filled with potential for investors looking to profit from the growing market for memory devices and related technologies in a variety of application fields. 3d Stacking MarketTo know about the Research Methodology :- Request Free Sample Report Continuous innovation is driven by ongoing improvements in 3D Stacking technology, materials, and design techniques. The growing desire for smaller, lighter, and more powerful electronic equipment in a variety of applications drives the trend toward miniaturization. Also, integrating many components involving as CPUs, memory, and sensors into a single container allows for increased functionality and performance. Government measures in China and South Korea promote chip development and advanced packaging technologies, creating an atmosphere conducive to technological advancement and commercial expansion. These variables combine to create a dynamic ecosystem marked by rapid technical change and promising potential for industry stakeholders. 3D Stacking technology gains popularity in smartphones, wearables, and mobile devices, then grows into car electronics for ADAS and autonomous driving, and finally into AR/VR, medical devices, and industrial automation. It aims to reduce costs and improve thermal management, as well as standardize interfaces and design standards to facilitate ecosystem development.

3d Stacking Market Dynamics

Miniaturization and Form Factor Reduction 
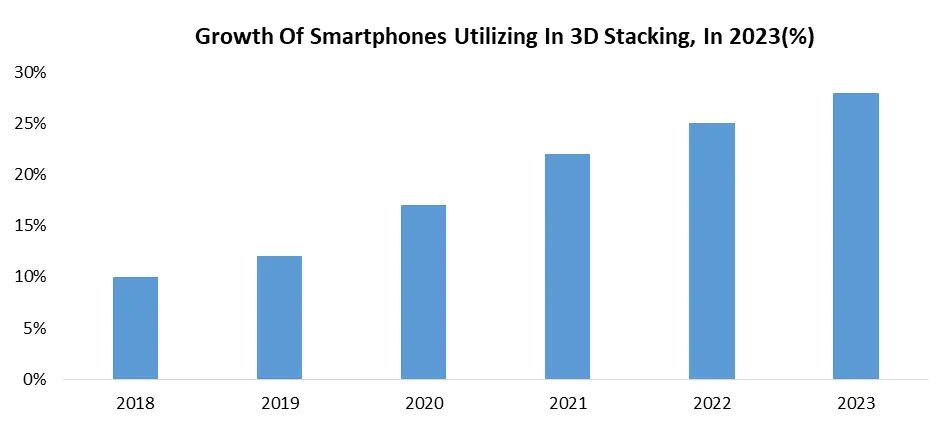
Stacking different components such as as processors, memory, and sensors in a single stack improves the capability of tiny devices. It minimizes device size and weight, which are essential to mobile, wearable, and IoT applications. Shorter signal paths inside a stack improve data transmission rates and device performance. Investments in downsizing drive developments in 3D Stacking technologies including through-silicon vias and interposers. 3D Stacking has uses beyond smartphones and PCs, including wearables, AR/VR devices, and IoT sensors. Established heavyweights such as TSMC and Samsung fight with start-ups, resulting in a dynamic market landscape.

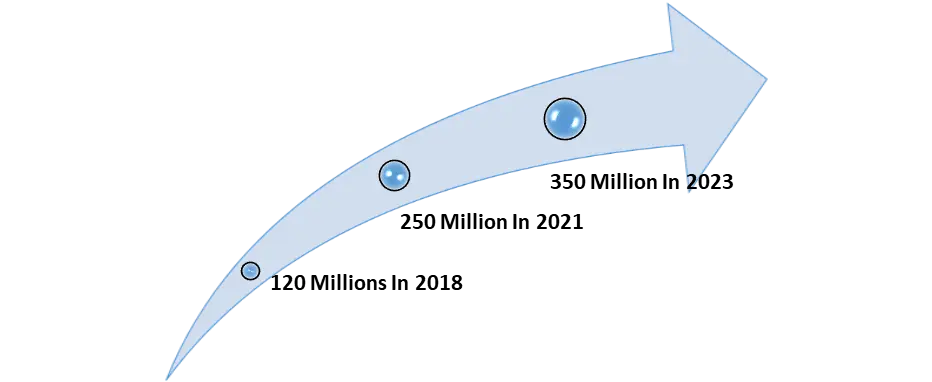
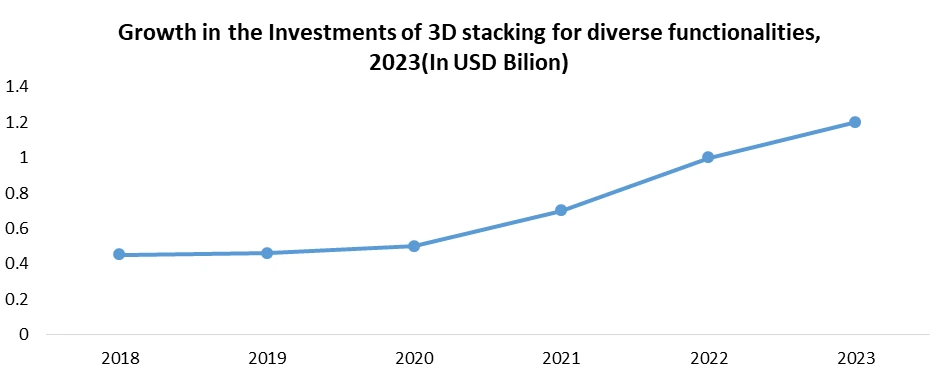
Growth of Venture capital funding in 3D Stacking start-ups

3d Stacking Market Integration of Diverse Functionalities 
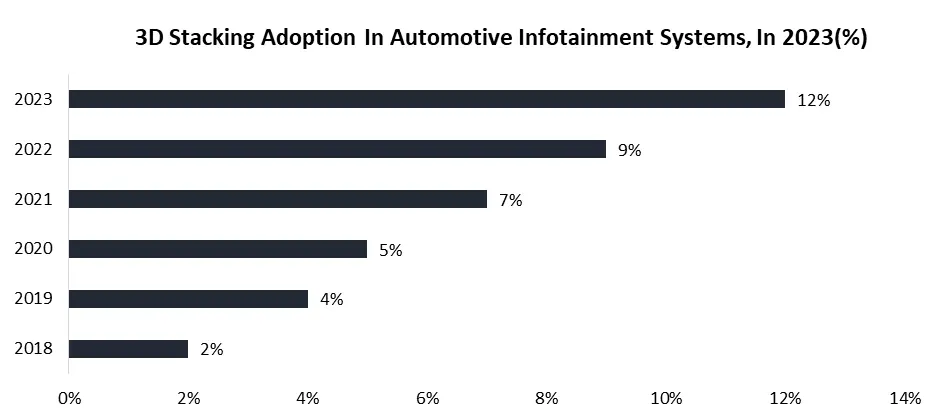
The 3D Stacking market's disruptive opportunity derives from its capacity to vertically stack several chip functionalities, revolutionizing gadget capabilities. Devices grow more feature-rich and functional by combining varied components such as processors, memory, sensors, and RF in a single box. Furthermore, shorter interconnects inside the stack improve data transfer speeds and overall device performance as compared to typical side-by-side positioning. Also, this technology improves the range of applications, making it easier to construct AI-powered devices, autonomous systems, and linked medical devices with a variety of features in small form factors. 3D Stacking's expansion into non-traditional sectors including automotive, healthcare, and AR/VR, driven by its capacity to integrate diverse functionalities, creates new market segments. The diversification amplifies market size, driven by the escalating demand for feature-rich devices across industries, anticipated to reach USD 47.4 billion by 2030. The pursuit of integrated solutions spurs innovation in 3D Stacking technologies, intensifying competition and developing a dynamic competitive landscape with the emergence of new players. The ecosystem of innovation and competition drives the continuous evolution and adoption of 3D Stacking across a broad spectrum of applications and industries. 3d Stacking Market Lack of Standardization and Ecosystem Development Limited interoperability due to the absence of standard protocols deters collaboration and wider adoption. Custom design efforts and increased costs arise from the lack of standards, complicating deployment. Market growth is slowed because of interoperability issues and ecosystem fragmentation, deterring investment in technology with uncertain compatibility. Despite technological advancements, concerns about interoperability limit widespread implementation. Investors are concerned about the lack of rules, which might stifle funding and innovation. The fragmented environment, defined by proprietary solutions from various competitors, results in a fractured market landscape with little collaboration. The absence of coordination stunts industry growth and impedes the development of complete solutions. To address these difficulties, we must work together to define common standards, encourage stakeholder collaboration, and promote investment in interoperable technologies. Only via such measures the sector overcome deployment bottlenecks, increase investor confidence, and realize the full potential of emerging technology. 3d Stacking Market

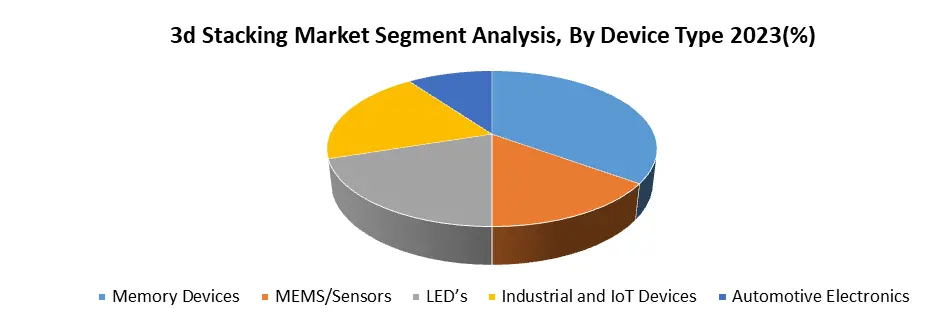
3d Stacking Market Segment Analysis

By Device Type, the Memory Devices segment accounts for an estimated 35% of the overall 3d Stacking Market. The increasing demand for memory in AI, high-performance computing, and mobile devices has outpaced the capacity of traditional 2D memory technology. To solve this, 3D Stacking encourages research and development in critical areas. TSVs provide vertical connections between memory levels, increasing density and bandwidth. Advances in interfaces such as CXL (Compute Express Link) are critical for efficient data transfer between stacked memory and CPUs. The ongoing research into new materials and technologies aims to provide denser and more efficient memory cells, satisfying the demand for high-density and high-bandwidth memory solutions in a variety of applications. Memory devices account for more than 30% of the 3D Stacking market, with significant expenditures from industry players such as Samsung, SK Hynix, Micron, and TSMC. Growing demand pushes funding for start-ups and collaborations between memory makers and system integrators to create and integrate 3D memory systems. 3D stacked memory improves high-performance computing (HPC) by making servers denser and faster, which is necessary for complicated simulations and data analysis. Integrated memory in mobile devices improves performance, power efficiency, and multitasking capabilities. In addition, 3D memory shows promise in emerging applications such as AI accelerators, driverless vehicles, and AR/VR devices, which require high bandwidth and density. 3d Stacking Market

3d Stacking Market Regional Insights

Asia Pacific accounted for over 45% of global 3D Stacking market revenue. The region has a strong electronics manufacturing sector, with companies including TSMC and Samsung driving innovation in technologies such as 3D Stacking. The strong basis encourages the deployment of innovative semiconductor solutions. The region's rapidly increasing demand for smartphones, smartwatches, and other electronic gadgets focuses on the importance of downsizing and improved performance, both of which 3D Stacking efficiently addresses. Also, government support from countries such as China and South Korea, in the form of financial incentives and infrastructure improvements, accelerates domestic chip development and the advancement of innovative packaging technologies, contributing to the electronics industry's long-term growth. TSMC has allocated USD 25 billion for 3D Stacking technology, increasing regional capacity and R&D. China increases 3D NAND flash output, increasing its market share. South Korea supports heterogeneous integration, which combines many chip types in a single stack to increase application potential while increasing industry focus on advanced semiconductor solutions. China influences the regional market share thanks to a strong manufacturing sector, government support, and rising domestic electronics demand. However, South Korea, Taiwan, and Japan show significant development potential, with increasing investments in 3D Stacking technologies, indicating more competition and innovation in the market. 1. According to MMR Analysis, Nikkei Asia's total investment in 3D Stacking start-ups in Asia Pacific reached 2.6 Billion in 2023 as compared to USD 1.1 Billion in 2020. 3d Stacking Market 3d Stacking Market Competitive Landscape In 2022, Taiwan-based TSMC announced a significant USD XX billion investment in 3D Stacking technology, indicating a strong commitment to progress in this industry. The expenditure seeks to increase TSMC's production capacity, improve its R&D activities, and strengthen its market position in the region. Similarly, Samsung of South Korea has budgeted USD XX billion for a new chip production plant in 2022, with a focus on advanced packaging, including 3D Stacking. The huge investment improves Samsung's production capacity and increases its competitiveness in the 3D Stacking market. In Japan, JCET (Jiangsu Changjiang Electronics Technology) has secured a USD XX Billion investment from the Development Bank of Japan in 2023 to assist in the development of 3D Stacking technology. The funding allows JCET to focus on research and development, potentially positioning them as a major competitor in the market. Ultimately, JCET in China received a significant USD 3.2 billion in government financing in 2021 to develop advanced packaging technologies such as 3D Stacking. It demonstrates substantial government backing for local chip development and establishes JCET as a major player in China's fast-growing 3D Stacking industry. Overall, these investments demonstrate the growing importance and competition among important companies in the worldwide 3D Stacking market.

3d Stacking Market Scope:Inquire Before Buying

Global 3d Stacking Market
Report Coverage Details
Base Year: 2023 Forecast Period: 2024-2030
Historical Data: 2018 to 2023 Market Size in 2023: US $ 1.44 Bn.
Forecast Period 2024 to 2030 CAGR: 20.4% Market Size in 2030: US $ 5.28 Bn.
Segments Covered: by Interconnecting Technology 3D Hybrid Bonding 3D TSV Monolithic 3D Integration
by Device Type Memory Devices MEMS/Sensors LED’s Industrial and IoT Devices Automotive Electronics
by Method Through-Silicon Vias (TSVs) Interposer-Based Stacking Die-to-Die Bonding Wafer-Level Stacking
by End-User Data Centers and Cloud Computing Automotive Electronics Telecommunications Industrial Applications Medical Devices

3d Stacking Market, by Region

North America (United States, Canada and Mexico) Europe (UK, France, Germany, Italy, Spain, Sweden, Austria and Rest of Europe) Asia Pacific (China, South Korea, Japan, India, Australia, Indonesia, Malaysia, Vietnam, Taiwan, Bangladesh, Pakistan and Rest of APAC) Middle East and Africa (South Africa, GCC, Egypt, Nigeria and Rest of ME&A) South America (Brazil, Argentina Rest of South America)

Key Players in the 3d Stacking Market

1. Samsung 2. Taiwan Semiconductor Manufacturing Company, Ltd. 3. Intel Corporation 4. UMC 5. Xperi 6. Tezzaron 7. Entegris 8. JCET 9. Intel 10. Micron 11. NAND flash 12. DRAM 13. Mobacommunity 14. meridian. all express 15. kuenz 16. optics 17. asia.nikkei 18. yolegroup 19. ednasia 20. 3dincites 21. semiconductor.Samsung FAQs: 1. What are some of the challenges associated with 3D Stacking implementation? Ans. Challenges of 3D Stacking implementation include technical hurdles such as thermal management, alignment and bonding issues, manufacturing complexity, cost considerations, and compatibility with existing semiconductor fabrication processes. 2. Which industries are driving the adoption of 3D Stacking technology? Ans. Industries such as consumer electronics, data centers, automotive, medical devices, industrial automation, and artificial intelligence (AI) accelerators are driving the adoption of 3D Stacking technology due to its potential to address the growing demand for higher-performance and compact electronic systems. 3. What is the projected market size & and growth rate of the 3D Stacking Market? Ans. The 3D Stacking Market size was valued at USD 1.44 Billion in 2023 and the total 3D Stacking revenue is expected to grow at a CAGR of 20.4% from 2023 to 2030, reaching nearly USD 5.28 Billion in 2030. 4. What segments are covered in the 3D Stacking Market report? Ans. The segments covered in the 3D Stacking market report are Interconnecting Technology, Device Type, Method and End-Users.
1. 3d Stacking Market Introduction 1.1. Study Assumption and Market Definition 1.2. Scope of the Study 1.3. Executive Summary 2. 3d Stacking Market: Dynamics 2.1. 3d Stacking Market Trends by Region 2.1.1. North America 3d Stacking Market Trends 2.1.2. Europe 3d Stacking Market Trends 2.1.3. Asia Pacific 3d Stacking Market Trends 2.1.4. Middle East and Africa 3d Stacking Market Trends 2.1.5. South America 3d Stacking Market Trends 2.2. 3d Stacking Market Dynamics by Region 2.2.1. North America 2.2.1.1. North America 3d Stacking Market Drivers 2.2.1.2. North America 3d Stacking Market Restraints 2.2.1.3. North America 3d Stacking Market Opportunities 2.2.1.4. North America 3d Stacking Market Challenges 2.2.2. Europe 2.2.2.1. Europe 3d Stacking Market Drivers 2.2.2.2. Europe 3d Stacking Market Restraints 2.2.2.3. Europe 3d Stacking Market Opportunities 2.2.2.4. Europe 3d Stacking Market Challenges 2.2.3. Asia Pacific 2.2.3.1. Asia Pacific 3d Stacking Market Drivers 2.2.3.2. Asia Pacific 3d Stacking Market Restraints 2.2.3.3. Asia Pacific 3d Stacking Market Opportunities 2.2.3.4. Asia Pacific 3d Stacking Market Challenges 2.2.4. Middle East and Africa 2.2.4.1. Middle East and Africa 3d Stacking Market Drivers 2.2.4.2. Middle East and Africa 3d Stacking Market Restraints 2.2.4.3. Middle East and Africa 3d Stacking Market Opportunities 2.2.4.4. Middle East and Africa 3d Stacking Market Challenges 2.2.5. South America 2.2.5.1. South America 3d Stacking Market Drivers 2.2.5.2. South America 3d Stacking Market Restraints 2.2.5.3. South America 3d Stacking Market Opportunities 2.2.5.4. South America 3d Stacking Market Challenges 2.3. PORTER’s Five Forces Analysis 2.4. PESTLE Analysis 2.5. Technology Roadmap 2.6. Regulatory Landscape by Region 2.6.1. North America 2.6.2. Europe 2.6.3. Asia Pacific 2.6.4. Middle East and Africa 2.6.5. South America 2.7. Key Opinion Leader Analysis For 3d Stacking Industry 2.8. Analysis of Government Schemes and Initiatives For 3d Stacking Industry 2.9. 3d Stacking Market Trade Analysis 2.10. The Global Pandemic Impact on 3d Stacking Market 3. 3d Stacking Market: Global Market Size and Forecast by Segmentation by Demand and Supply Side (by Value in USD Million) 2023-2030 3.1. 3d Stacking Market Size and Forecast, by Interconnecting Technology (2023-2030) 3.1.1. 3D Hybrid Bonding 3.1.2. 3D TSV 3.1.3. Monolithic 3D Integration 3.2. 3d Stacking Market Size and Forecast, by Device Type (2023-2030) 3.2.1. Memory Devices 3.2.2. MEMS/Sensors 3.2.3. LED’s 3.2.4. Industrial and IoT Devices 3.2.5. Automotive Electronics 3.3. 3d Stacking Market Size and Forecast, by Method (2023-2030) 3.3.1. Through-Silicon Vias (TSVs) 3.3.2. Interposer-Based Stacking 3.3.3. Die-to-Die Bonding 3.3.4. Wafer-Level Stacking 3.4. 3d Stacking Market Size and Forecast, by End Use (2023-2030) 3.4.1. Data Centers and Cloud Computing 3.4.2. Automotive Electronics 3.4.3. Telecommunications 3.4.4. Industrial Applications 3.4.5. Medical Devices 3.5. 3d Stacking Market Size and Forecast, by Region (2023-2030) 3.5.1. North America 3.5.2. Europe 3.5.3. Asia Pacific 3.5.4. Middle East and Africa 3.5.5. South America 4. North America 3d Stacking Market Size and Forecast by Segmentation (by Value in USD Million) 2023-2030 4.1. North America 3d Stacking Market Size and Forecast, by Interconnecting Technology (2023-2030) 4.1.1. 3D Hybrid Bonding 4.1.2. 3D TSV 4.1.3. Monolithic 3D Integration 4.2. North America 3d Stacking Market Size and Forecast, by Device Type (2023-2030) 4.2.1. Memory Devices 4.2.2. MEMS/Sensors 4.2.3. LED’s 4.2.4. Industrial and IoT Devices 4.2.5. Automotive Electronics 4.3. North America 3d Stacking Market Size and Forecast, by Method (2023-2030) 4.3.1. Through-Silicon Vias (TSVs) 4.3.2. Interposer-Based Stacking 4.3.3. Die-to-Die Bonding 4.3.4. Wafer-Level Stacking 4.4. North America 3d Stacking Market Size and Forecast, by End Use (2023-2030) 4.4.1. Data Centers and Cloud Computing 4.4.2. Automotive Electronics 4.4.3. Telecommunications 4.4.4. Industrial Applications 4.4.5. Medical Devices 4.5. North America 3d Stacking Market Size and Forecast, by Country (2023-2030) 4.5.1. United States 4.5.1.1. United States 3d Stacking Market Size and Forecast, by Interconnecting Technology (2023-2030) 4.5.1.1.1. 3D Hybrid Bonding 4.5.1.1.2. 3D TSV 4.5.1.1.3. Monolithic 3D Integration 4.5.1.2. United States 3d Stacking Market Size and Forecast, by Device Type (2023-2030) 4.5.1.2.1. Memory Devices 4.5.1.2.2. MEMS/Sensors 4.5.1.2.3. LED’s 4.5.1.2.4. Industrial and IoT Devices 4.5.1.2.5. Automotive Electronics 4.5.1.3. United States 3d Stacking Market Size and Forecast, by Method (2023-2030) 4.5.1.3.1. Through-Silicon Vias (TSVs) 4.5.1.3.2. Interposer-Based Stacking 4.5.1.3.3. Die-to-Die Bonding 4.5.1.3.4. Wafer-Level Stacking 4.5.1.4. United States 3d Stacking Market Size and Forecast, by End Use (2023-2030) 4.5.1.4.1. Data Centers and Cloud Computing 4.5.1.4.2. Automotive Electronics 4.5.1.4.3. Telecommunications 4.5.1.4.4. Industrial Applications 4.5.1.4.5. Medical Devices 4.5.2. Canada 4.5.2.1. Canada 3d Stacking Market Size and Forecast, by Interconnecting Technology (2023-2030) 4.5.2.1.1. 3D Hybrid Bonding 4.5.2.1.2. 3D TSV 4.5.2.1.3. Monolithic 3D Integration 4.5.2.2. Canada 3d Stacking Market Size and Forecast, by Device Type (2023-2030) 4.5.2.2.1. Memory Devices 4.5.2.2.2. MEMS/Sensors 4.5.2.2.3. LED’s 4.5.2.2.4. Industrial and IoT Devices 4.5.2.2.5. Automotive Electronics 4.5.2.3. Canada 3d Stacking Market Size and Forecast, by Method (2023-2030) 4.5.2.3.1. Through-Silicon Vias (TSVs) 4.5.2.3.2. Interposer-Based Stacking 4.5.2.3.3. Die-to-Die Bonding 4.5.2.3.4. Wafer-Level Stacking 4.5.2.4. Canada 3d Stacking Market Size and Forecast, by End Use (2023-2030) 4.5.2.4.1. Data Centers and Cloud Computing 4.5.2.4.2. Automotive Electronics 4.5.2.4.3. Telecommunications 4.5.2.4.4. Industrial Applications 4.5.2.4.5. Medical Devices 4.5.3. Mexico 4.5.3.1. Mexico 3d Stacking Market Size and Forecast, by Interconnecting Technology (2023-2030) 4.5.3.1.1. 3D Hybrid Bonding 4.5.3.1.2. 3D TSV 4.5.3.1.3. Monolithic 3D Integration 4.5.3.2. Mexico 3d Stacking Market Size and Forecast, by Device Type (2023-2030) 4.5.3.2.1. Memory Devices 4.5.3.2.2. MEMS/Sensors 4.5.3.2.3. LED’s 4.5.3.2.4. Industrial and IoT Devices 4.5.3.2.5. Automotive Electronics 4.5.3.3. Mexico 3d Stacking Market Size and Forecast, by Method (2023-2030) 4.5.3.3.1. Through-Silicon Vias (TSVs) 4.5.3.3.2. Interposer-Based Stacking 4.5.3.3.3. Die-to-Die Bonding 4.5.3.3.4. Wafer-Level Stacking 4.5.3.4. Mexico 3d Stacking Market Size and Forecast, by End Use (2023-2030) 4.5.3.4.1. Data Centers and Cloud Computing 4.5.3.4.2. Automotive Electronics 4.5.3.4.3. Telecommunications 4.5.3.4.4. Industrial Applications 4.5.3.4.5. Medical Devices 5. Europe 3d Stacking Market Size and Forecast by Segmentation (by Value in USD Million) 2023-2030 5.1. Europe 3d Stacking Market Size and Forecast, by Interconnecting Technology (2023-2030) 5.2. Europe 3d Stacking Market Size and Forecast, by Device Type (2023-2030) 5.3. Europe 3d Stacking Market Size and Forecast, by Method (2023-2030) 5.4. Europe 3d Stacking Market Size and Forecast, by End Use (2023-2030) 5.5. Europe 3d Stacking Market Size and Forecast, by Country (2023-2030) 5.5.1. United Kingdom 5.5.1.1. United Kingdom 3d Stacking Market Size and Forecast, by Interconnecting Technology (2023-2030) 5.5.1.2. United Kingdom 3d Stacking Market Size and Forecast, by Device Type (2023-2030) 5.5.1.3. United Kingdom 3d Stacking Market Size and Forecast, by Method (2023-2030) 5.5.1.4. United Kingdom 3d Stacking Market Size and Forecast, by End Use (2023-2030) 5.5.2. France 5.5.2.1. France 3d Stacking Market Size and Forecast, by Interconnecting Technology (2023-2030) 5.5.2.2. France 3d Stacking Market Size and Forecast, by Device Type (2023-2030) 5.5.2.3. France 3d Stacking Market Size and Forecast, by Method (2023-2030) 5.5.2.4. France 3d Stacking Market Size and Forecast, by End Use (2023-2030) 5.5.3. Germany 5.5.3.1. Germany 3d Stacking Market Size and Forecast, by Interconnecting Technology (2023-2030) 5.5.3.2. Germany 3d Stacking Market Size and Forecast, by Device Type (2023-2030) 5.5.3.3. Germany 3d Stacking Market Size and Forecast, by Method (2023-2030) 5.5.3.4. Germany 3d Stacking Market Size and Forecast, by End Use (2023-2030) 5.5.4. Italy 5.5.4.1. Italy 3d Stacking Market Size and Forecast, by Interconnecting Technology (2023-2030) 5.5.4.2. Italy 3d Stacking Market Size and Forecast, by Device Type (2023-2030) 5.5.4.3. Italy 3d Stacking Market Size and Forecast, by Method (2023-2030) 5.5.4.4. Italy 3d Stacking Market Size and Forecast, by End Use (2023-2030) 5.5.5. Spain 5.5.5.1. Spain 3d Stacking Market Size and Forecast, by Interconnecting Technology (2023-2030) 5.5.5.2. Spain 3d Stacking Market Size and Forecast, by Device Type (2023-2030) 5.5.5.3. Spain 3d Stacking Market Size and Forecast, by Method (2023-2030) 5.5.5.4. Spain 3d Stacking Market Size and Forecast, by End Use (2023-2030) 5.5.6. Sweden 5.5.6.1. Sweden 3d Stacking Market Size and Forecast, by Interconnecting Technology (2023-2030) 5.5.6.2. Sweden 3d Stacking Market Size and Forecast, by Device Type (2023-2030) 5.5.6.3. Sweden 3d Stacking Market Size and Forecast, by Method (2023-2030) 5.5.6.4. Sweden 3d Stacking Market Size and Forecast, by End Use (2023-2030) 5.5.7. Austria 5.5.7.1. Austria 3d Stacking Market Size and Forecast, by Interconnecting Technology (2023-2030) 5.5.7.2. Austria 3d Stacking Market Size and Forecast, by Device Type (2023-2030) 5.5.7.3. Austria 3d Stacking Market Size and Forecast, by Method (2023-2030) 5.5.7.4. Austria 3d Stacking Market Size and Forecast, by End Use (2023-2030) 5.5.8. Rest of Europe 5.5.8.1. Rest of Europe 3d Stacking Market Size and Forecast, by Interconnecting Technology (2023-2030) 5.5.8.2. Rest of Europe 3d Stacking Market Size and Forecast, by Device Type (2023-2030) 5.5.8.3. Rest of Europe 3d Stacking Market Size and Forecast, by Method (2023-2030) 5.5.8.4. Rest of Europe 3d Stacking Market Size and Forecast, by End Use (2023-2030) 6. Asia Pacific 3d Stacking Market Size and Forecast by Segmentation (by Value in USD Million) 2023-2030 6.1. Asia Pacific 3d Stacking Market Size and Forecast, by Interconnecting Technology (2023-2030) 6.2. Asia Pacific 3d Stacking Market Size and Forecast, by Device Type (2023-2030) 6.3. Asia Pacific 3d Stacking Market Size and Forecast, by Method (2023-2030) 6.4. Asia Pacific 3d Stacking Market Size and Forecast, by End Use (2023-2030) 6.5. Asia Pacific 3d Stacking Market Size and Forecast, by Country (2023-2030) 6.5.1. China 6.5.1.1. China 3d Stacking Market Size and Forecast, by Interconnecting Technology (2023-2030) 6.5.1.2. China 3d Stacking Market Size and Forecast, by Device Type (2023-2030) 6.5.1.3. China 3d Stacking Market Size and Forecast, by Method (2023-2030) 6.5.1.4. China 3d Stacking Market Size and Forecast, by End Use (2023-2030) 6.5.2. S Korea 6.5.2.1. S Korea 3d Stacking Market Size and Forecast, by Interconnecting Technology (2023-2030) 6.5.2.2. S Korea 3d Stacking Market Size and Forecast, by Device Type (2023-2030) 6.5.2.3. S Korea 3d Stacking Market Size and Forecast, by Method (2023-2030) 6.5.2.4. S Korea 3d Stacking Market Size and Forecast, by End Use (2023-2030) 6.5.3. Japan 6.5.3.1. Japan 3d Stacking Market Size and Forecast, by Interconnecting Technology (2023-2030) 6.5.3.2. Japan 3d Stacking Market Size and Forecast, by Device Type (2023-2030) 6.5.3.3. Japan 3d Stacking Market Size and Forecast, by Method (2023-2030) 6.5.3.4. Japan 3d Stacking Market Size and Forecast, by End Use (2023-2030) 6.5.4. India 6.5.4.1. India 3d Stacking Market Size and Forecast, by Interconnecting Technology (2023-2030) 6.5.4.2. India 3d Stacking Market Size and Forecast, by Device Type (2023-2030) 6.5.4.3. India 3d Stacking Market Size and Forecast, by Method (2023-2030) 6.5.4.4. India 3d Stacking Market Size and Forecast, by End Use (2023-2030) 6.5.5. Australia 6.5.5.1. Australia 3d Stacking Market Size and Forecast, by Interconnecting Technology (2023-2030) 6.5.5.2. Australia 3d Stacking Market Size and Forecast, by Device Type (2023-2030) 6.5.5.3. Australia 3d Stacking Market Size and Forecast, by Method (2023-2030) 6.5.5.4. Australia 3d Stacking Market Size and Forecast, by End Use (2023-2030) 6.5.6. Indonesia 6.5.6.1. Indonesia 3d Stacking Market Size and Forecast, by Interconnecting Technology (2023-2030) 6.5.6.2. Indonesia 3d Stacking Market Size and Forecast, by Device Type (2023-2030) 6.5.6.3. Indonesia 3d Stacking Market Size and Forecast, by Method (2023-2030) 6.5.6.4. Indonesia 3d Stacking Market Size and Forecast, by End Use (2023-2030) 6.5.7. Malaysia 6.5.7.1. Malaysia 3d Stacking Market Size and Forecast, by Interconnecting Technology (2023-2030) 6.5.7.2. Malaysia 3d Stacking Market Size and Forecast, by Device Type (2023-2030) 6.5.7.3. Malaysia 3d Stacking Market Size and Forecast, by Method (2023-2030) 6.5.7.4. Malaysia 3d Stacking Market Size and Forecast, by End Use (2023-2030) 6.5.8. Vietnam 6.5.8.1. Vietnam 3d Stacking Market Size and Forecast, by Interconnecting Technology (2023-2030) 6.5.8.2. Vietnam 3d Stacking Market Size and Forecast, by Device Type (2023-2030) 6.5.8.3. Vietnam 3d Stacking Market Size and Forecast, by Method (2023-2030) 6.5.8.4. Vietnam 3d Stacking Market Size and Forecast, by End Use (2023-2030) 6.5.9. Taiwan 6.5.9.1. Taiwan 3d Stacking Market Size and Forecast, by Interconnecting Technology (2023-2030) 6.5.9.2. Taiwan 3d Stacking Market Size and Forecast, by Device Type (2023-2030) 6.5.9.3. Taiwan 3d Stacking Market Size and Forecast, by Method (2023-2030) 6.5.9.4. Taiwan 3d Stacking Market Size and Forecast, by End Use (2023-2030) 6.5.10. Rest of Asia Pacific 6.5.10.1. Rest of Asia Pacific 3d Stacking Market Size and Forecast, by Interconnecting Technology (2023-2030) 6.5.10.2. Rest of Asia Pacific 3d Stacking Market Size and Forecast, by Device Type (2023-2030) 6.5.10.3. Rest of Asia Pacific 3d Stacking Market Size and Forecast, by Method (2023-2030) 6.5.10.4. Rest of Asia Pacific 3d Stacking Market Size and Forecast, by End Use (2023-2030) 7. Middle East and Africa 3d Stacking Market Size and Forecast by Segmentation (by Value in USD Million) 2023-2030 7.1. Middle East and Africa 3d Stacking Market Size and Forecast, by Interconnecting Technology (2023-2030) 7.2. Middle East and Africa 3d Stacking Market Size and Forecast, by Device Type (2023-2030) 7.3. Middle East and Africa 3d Stacking Market Size and Forecast, by Method (2023-2030) 7.4. Middle East and Africa 3d Stacking Market Size and Forecast, by End Use (2023-2030) 7.5. Middle East and Africa 3d Stacking Market Size and Forecast, by Country (2023-2030) 7.5.1. South Africa 7.5.1.1. South Africa 3d Stacking Market Size and Forecast, by Interconnecting Technology (2023-2030) 7.5.1.2. South Africa 3d Stacking Market Size and Forecast, by Device Type (2023-2030) 7.5.1.3. South Africa 3d Stacking Market Size and Forecast, by Method (2023-2030) 7.5.1.4. South Africa 3d Stacking Market Size and Forecast, by End Use (2023-2030) 7.5.2. GCC 7.5.2.1. GCC 3d Stacking Market Size and Forecast, by Interconnecting Technology (2023-2030) 7.5.2.2. GCC 3d Stacking Market Size and Forecast, by Device Type (2023-2030) 7.5.2.3. GCC 3d Stacking Market Size and Forecast, by Method (2023-2030) 7.5.2.4. GCC 3d Stacking Market Size and Forecast, by End Use (2023-2030) 7.5.3. Nigeria 7.5.3.1. Nigeria 3d Stacking Market Size and Forecast, by Interconnecting Technology (2023-2030) 7.5.3.2. Nigeria 3d Stacking Market Size and Forecast, by Device Type (2023-2030) 7.5.3.3. Nigeria 3d Stacking Market Size and Forecast, by Method (2023-2030) 7.5.3.4. Nigeria 3d Stacking Market Size and Forecast, by End Use (2023-2030) 7.5.4. Rest of ME&A 7.5.4.1. Rest of ME&A 3d Stacking Market Size and Forecast, by Interconnecting Technology (2023-2030) 7.5.4.2. Rest of ME&A 3d Stacking Market Size and Forecast, by Device Type (2023-2030) 7.5.4.3. Rest of ME&A 3d Stacking Market Size and Forecast, by Method (2023-2030) 7.5.4.4. Rest of ME&A 3d Stacking Market Size and Forecast, by End Use (2023-2030) 8. South America 3d Stacking Market Size and Forecast by Segmentation (by Value in USD Million) 2023-2030 8.1. South America 3d Stacking Market Size and Forecast, by Interconnecting Technology (2023-2030) 8.2. South America 3d Stacking Market Size and Forecast, by Device Type (2023-2030) 8.3. South America 3d Stacking Market Size and Forecast, by Method(2023-2030) 8.4. South America 3d Stacking Market Size and Forecast, by End Use (2023-2030) 8.5. South America 3d Stacking Market Size and Forecast, by Country (2023-2030) 8.5.1. Brazil 8.5.1.1. Brazil 3d Stacking Market Size and Forecast, by Interconnecting Technology (2023-2030) 8.5.1.2. Brazil 3d Stacking Market Size and Forecast, by Device Type (2023-2030) 8.5.1.3. Brazil 3d Stacking Market Size and Forecast, by Method (2023-2030) 8.5.1.4. Brazil 3d Stacking Market Size and Forecast, by End Use (2023-2030) 8.5.2. Argentina 8.5.2.1. Argentina 3d Stacking Market Size and Forecast, by Interconnecting Technology (2023-2030) 8.5.2.2. Argentina 3d Stacking Market Size and Forecast, by Device Type (2023-2030) 8.5.2.3. Argentina 3d Stacking Market Size and Forecast, by Method (2023-2030) 8.5.2.4. Argentina 3d Stacking Market Size and Forecast, by End Use (2023-2030) 8.5.3. Rest Of South America 8.5.3.1. Rest Of South America 3d Stacking Market Size and Forecast, by Interconnecting Technology (2023-2030) 8.5.3.2. Rest Of South America 3d Stacking Market Size and Forecast, by Device Type (2023-2030) 8.5.3.3. Rest Of South America 3d Stacking Market Size and Forecast, by Method (2023-2030) 8.5.3.4. Rest Of South America 3d Stacking Market Size and Forecast, by End Use (2023-2030) 9. Global 3d Stacking Market: Competitive Landscape 9.1. MMR Competition Matrix 9.2. Competitive Landscape 9.3. Key Players Benchmarking 9.3.1. Company Name 9.3.2. Business Segment 9.3.3. End-user Segment 9.3.4. Revenue (2022) 9.3.5. Company Locations 9.4. Leading 3d Stacking Market Companies, by market capitalization 9.5. Market Structure 9.5.1. Market Leaders 9.5.2. Market Followers 9.5.3. Emerging Players 9.6. Mergers and Acquisitions Details 10. Company Profile: Key Players 10.1. Samsung 10.1.1. Company Overview 10.1.2. Business Portfolio 10.1.3. Financial Overview 10.1.4. SWOT Analysis 10.1.5. Strategic Analysis 10.1.6. Scale of Operation (small, medium, and large) 10.1.7. Details on Partnership 10.1.8. Regulatory Accreditations and Certifications Received by Them 10.1.9. Awards Received by the Firm 10.1.10. Recent Developments 10.2. Taiwan Semiconductor Manufacturing Company, Ltd. 10.3. Intel Corporation 10.4. UMC 10.5. Xperi 10.6. Tezzaron 10.7. Entegris 10.8. JCET 10.9. Intel 10.10. Micron 10.11. NAND flash 10.12. DRAM 10.13. Mobacommunity 10.14. meridian. all express 10.15. kuenz 10.16. optics 10.17. asia.nikkei 10.18. yolegroup 10.19. ednasia 10.20. 3dincites 10.21. semiconductor.Samsung 11. Key Findings 12. Industry Recommendations 13. 3d Stacking Market: Research Methodology 14. Terms and Glossary
  • INQUIRE BEFORE BUYING