The Dairy Product Market size was valued at USD 569.67 Billion in 2024 and the total Dairy Product revenue is expected to grow at a CAGR of 4% from 2025 to 2032, reaching nearly USD 779.63 Billion. The food items produced from milk are referred to as dairy products also known as lacticinia. Water buffalo, ewe, nanny goat, and cow are the dairy animals, which are highly preferred for milk. Diary items include familiar foods found in grocery stores worldwide, such as cheese, milk, yogurt, and butter. To produce milk pasteurization process is used. There are several ways to prepare milk it be condensed, baked, evaporated, scaled, or powdered; the diverse products of milk propel the growth of the dairy product market. In addition, its types are khoa, buttermilk, and baby formula.To know about the Research Methodology :- Request Free Sample Report Production milk globally is 81% cow milk, 15% buffalo milk, and a total of 4% of goat and sheep. The internationally traded milk is in the form of processed dairy products. The prices of milk products vary from country to country. India is the largest milk producer in the world, the production has increased by 3.0% to 174 Mt, even though it have a slight impact on the world dairy market, as India trades only minimal quantities of dairy products. As per the MMR’s analysis, it is projected that India and Pakistan, the important milk producers, are expected to contribute more than half of the growth in global milk production in the next ten years, which is expected to boost the growth of dairy product market in the near future. Milk and dairy products play a vital role in human nutrition. Humans consume dairy products in their daily lives, cow milk is a complete food for humans, it almost covers all the needs of the human body. High consumption of milk and dairy products in human life spikes the growth of the global dairy product market. In addition, lactose-intolerant consumers a constraint for the market.
Dairy Products Market Dynamics:
Contribution of Milk to Human Nutrition The primary components of milk include proteins, fats, lactose, water, and salts. These components also define milk’s nutritional and commercial value. Its biological and technological qualities are determined by hundreds of additional constituents, including vitamins, enzymes, minerals, dissolved gasses, and other lipids, all of which are present in lesser concentrations than its primary constituents. It has a lot of calcium and lysine, which is an amino acid that’s frequently lacking in plant proteins. The elements that are most abundant in milk are calcium and phosphorus, which help the body absorb them. In addition, the newborn’s diet is solely composed of milk, indicating that milk is a source of all the nutrients they need. Therefore, the nutritional value of milk is propelling the growth of the global dairy product market and is expected to continue throughout the forecast period. Milk is the production of one or more healthy cows breast milk that is devoid of colostrum, with at least 3.15% fat and 8.25% solid fat-free components. The consumption of milk by adults meets the needs of the body perfectly because the milk’s nutrients are in digestible form. 1litre milk provides 700 calories and consuming 2litre of milk per day neutralizes the feeling of hunger if the person is on a weight loss diet. In addition, to the antioxidant’s synergistic effects, milk fat contains elements that fight cancer such as conjugated linoleic acid and vaccenic acid, which are naturally occurring trans isomers of fatty acids. Certain components of milk fat activate the gastrointestinal system. Since saturated fatty acids have been shown to have an antimicrobial impact, milk fat helps to reduce intestinal inflammation and prevent stomach ulcers. Milk’s nutritional feature supports the growth of the global dairy product market. Increasing Consumption of Dairy Products and Livestock Numerous factors influence the amount of dairy and other livestock products consumed per person, including social and cultural aspects, demographic factors like urbanization, and economic issues like income levels and comparable prices. In most of the emerging countries, the consumption of cattle products has been increasing thanks to economic extension and rising income levels. Demand for dairy and other livestock products is highly income-elasticity, particularly for those with low incomes, the price elasticity is expected to propel the market share of the global dairy product market. This implies that the amount spent on animal products increases significantly in response to a minor rise in income. Demand for dairy products is more responsive to income than that of most other food categories, including fish and meat. Also, when income levels rise, so do the elasticities of demand for all food categories, including dairy products. Therefore, it is estimated that rising dairy consumption respond sharply to rising incomes, particularly in underdeveloped and developing countries. Increasing demand for the Substitute Growing awareness of animal welfare, consumers are adopting plant-driven food. Plant-based dairy products including soy milk, almond milk, non-dairy ice cream, cheese substitutes, and whipped cream are quickly making their way into the mainstream retail market due to the belief that they are safer and healthier. Growth in the global dairy product market is projected to be impeded by the fast-paced development of dairy substitutes, such as non-dairy ice cream, cheese substitutes, and whipped creams. A rising proportion of people are not consuming lactose, which is impeding the growth of the global dairy product industry. In addition, it is expected that rising lactose intolerance, including allergies to milk or goods containing milk, as well as the trend toward vegan diets thanks to the possible health advantages of healthy living and vegan diets.Dairy Products Market Segment Analysis:
Based on Product Type, the Milk segment is significantly dominating the dairy product market with the highest market share of 4.83%. Constant supply of milk and higher production of milk and milk products are boosting the growth of the milk segment in the dairy product market. As per the MMR’s analysis, global milk production in 2022 was 930 million tonnes, increased by 0.6% from 2021, it is driven by the extension in Asia, Central America, and the Caribbean. The increasing population is fuelling the demand for milk over the globe; thus, production of milk is increasing which is boosting the growth of the milk segment in the dairy product market. In addition, the products that are created from milk such as butter, cheese, ghee, skimmed milk, and fermented products are expected to witness substantial growth in the forecast period. The butter segment size was valued at USD 46 billion in 2024. It is expected to grow at a CAGR of 7.8% throughout the forecast period. The rising consumption of butter in their daily diets is expected to increase the growth of the butter segment in the near future. The cheese segment size was valued at USD 733 Billion in 2024 and is expected to grow at a CAGR of 3.7% in the forecast period. The consumer preference for new recipes of cheese cuisines is projected to fuel the growth of the milk segment throughout the forecast period.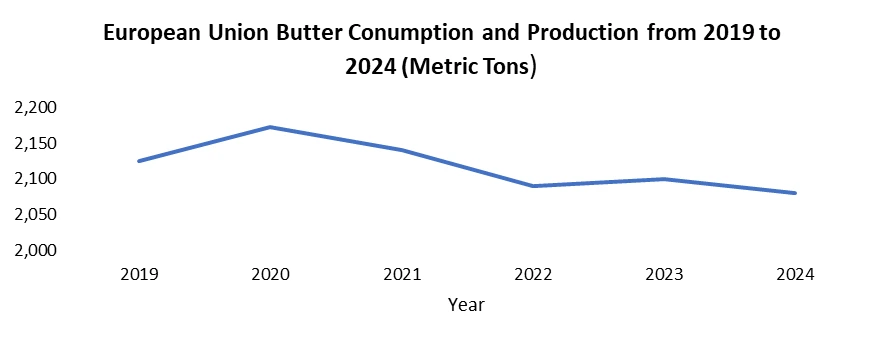
Dairy Product Market Regional Insights:
Asia-Pacific is significantly dominating the global dairy product market and is expected to continue the dominance throughout the forecast period. India ranked 3rd in dairy products in the Asia-Pacific region. The top 5 milk-producing states in India in 2021-22 are Rajasthan, Uttar Pradesh, Madhya Pradesh, Gujarat, and Andhra Pradesh. They together contribute 53.11% of total milk production in the country. Thus, the high production of milk in India is fuelling the growth of the dairy product market. In addition, the largest importer of dairy products in the world is China which boosts the dairy product market in Asia-Pacific. Australia is expected to increase cheese production by 5% to 445,000 tons in 2024, which is estimated to boost the dairy product market in Australia during the forecast period. In 2023, cheddar cheese output declined by 3% compared to previous years, but overall cheese production grew by 6%. The move toward the manufacturer of specialist cheese kinds tailored to the export market. Cheese exports are expected to increase in 2024, it is boosted by rising import demand and a resurgence in competitiveness in Japan, China, South Korea, and the Philippines.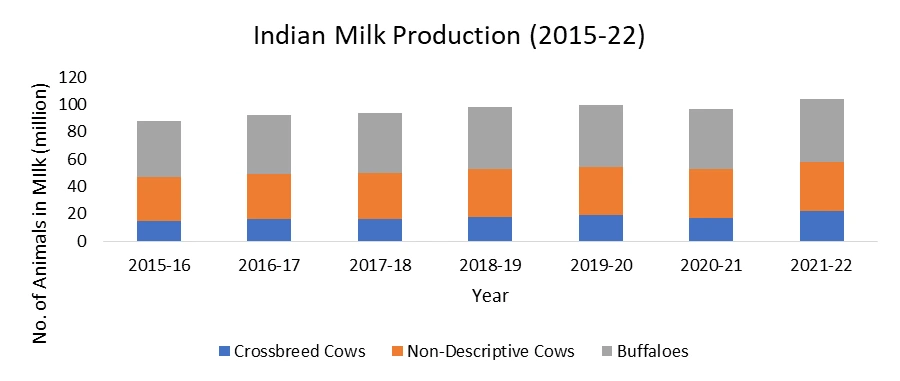
Dairy Product Market Scope: Inquire before buying
Global Dairy Product Market Report Coverage Details Base Year: 2024 Forecast Period: 2025-2032 Historical Data: 2019 to 2024 Market Size in 2024: USD 569.64 Billion. Forecast Period 2025 to 2032 CAGR: 4 % Market Size in 2032: USD 779.63 Billion. Segments Covered: by Product Type Milk Cheese Butter Yogurt Cream Milk Powder UTH Milk by Application Food and Beverages Bakery and Confectionary Clinical Nutrition by End User Supermarket Online Channel Speciality Stores Convenience Store Dairy Product Market, by Region
North America (United States, Canada and Mexico) Europe (UK, France, Germany, Italy, Spain, Sweden, Austria and Rest of Europe) Asia Pacific (China, South Korea, Japan, India, Australia, Indonesia, Malaysia, Vietnam, Taiwan, Bangladesh, Pakistan and Rest of APAC) Middle East and Africa (South Africa, GCC, Egypt, Nigeria and Rest of ME&A) South America (Brazil, Argentina Rest of South America)Dairy Products Market, Key Players:
North America 1. Fonterra Co-operative Group (U.S) 2. Dairy Farmers of America, Inc. (U.S) 3. Dairy Farmers of America (U.S) 4. Saputo Inc (U.S) 5. The Kraft Heinz Company (U.S) 6. Dean Foods Company (U.S) 7. Unilever N (U.S) Europe 1. Arla Foods amba (Denmark) 2. Danone (France) 3. Nestle S.A. (Switzerland) 4. Danone S.A. (France) 5. Royal FrieslandCampina (Netherland) 6. DMK Group (Germany) 7. Lactalis (France) 8. Parmalat S.P.A (Italy) Asia-Pacific 1. Amul (India) 2. China Mengniu Dairy Company Limited (China) 3. Britannia Industries Limited (India) 4. Meiji Holdings Co., Ltd. (Japan) South America 1. Sancor Cooperativas Unidas Limited (Argentina) FAQs 1. What are the growth drivers for the Dairy Products Market? Ans. The Rising adoption of Dairy Products in the Increasing Consumption of Dairy Products and Livestock and the contribution of milk to human nutrition is expected to be the major driver for the Dairy Products market. 2. What is the major restraint for the Dairy Products Market growth? Ans. The increasing demand for substitutes is expected to be the major restraining factor for the Dairy Products market growth. 3. Which region is expected to lead the global Dairy Products Market during the forecast period? Ans. Asia-Pacific is expected to lead the global Dairy Products market during the forecast period. 4. What is the projected market size & growth rate of the Dairy Products Market? Ans. The Dairy Product Market size was valued at USD 569.67 Billion in 2024 and the total Dairy Product revenue is expected to grow at a CAGR of 4% from 2025 to 2032, reaching nearly USD 779.63 Billion. 5. What segments are covered in the Dairy Products Market report? Ans. The segments covered in the Dairy Products market report are Components by Product, Application, End-User, and Region.
1. Dairy Products Market Introduction
1.1. Study Assumption and Market Definition
1.2. Scope of the Study
1.3. Executive Summary

2. Dairy Products Market: Dynamics
2.1. Dairy Products Market Trends by Region
2.1.1. North America Dairy Products Market Trends
2.1.2. Europe Dairy Products Market Trends
2.1.3. Asia Pacific Dairy Products Market Trends
2.1.4. Middle East and Africa Dairy Products Market Trends
2.1.5. South America Dairy Products Market Trends
2.2. Dairy Products Market Dynamics by Region
2.2.1. North America
2.2.1.1. North America Dairy Products Market Drivers
2.2.1.2. North America Dairy Products Market Restraints
2.2.1.3. North America Dairy Products Market Opportunities
2.2.1.4. North America Dairy Products Market Challenges
2.2.2. Europe
2.2.2.1. Europe Dairy Products Market Drivers
2.2.2.2. Europe Dairy Products Market Restraints
2.2.2.3. Europe Dairy Products Market Opportunities
2.2.2.4. Europe Dairy Products Market Challenges
2.2.3. Asia Pacific
2.2.3.1. Asia Pacific Dairy Products Market Drivers
2.2.3.2. Asia Pacific Dairy Products Market Restraints
2.2.3.3. Asia Pacific Dairy Products Market Opportunities
2.2.3.4. Asia Pacific Dairy Products Market Challenges
2.2.4. Middle East and Africa
2.2.4.1. Middle East and Africa Dairy Products Market Drivers
2.2.4.2. Middle East and Africa Dairy Products Market Restraints
2.2.4.3. Middle East and Africa Dairy Products Market Opportunities
2.2.4.4. Middle East and Africa Dairy Products Market Challenges
2.2.5. South America
2.2.5.1. South America Dairy Products Market Drivers
2.2.5.2. South America Dairy Products Market Restraints
2.2.5.3. South America Dairy Products Market Opportunities
2.2.5.4. South America Dairy Products Market Challenges
2.3. PORTER’s Five Forces Analysis
2.4. PESTLE Analysis
2.5. Technology Roadmap
2.6. Regulatory Landscape by Region
2.6.1. North America
2.6.2. Europe
2.6.3. Asia Pacific
2.6.4. Middle East and Africa
2.6.5. South America
2.7. Key Opinion Leader Analysis For Dairy Products Industry
2.8. Analysis of Government Schemes and Initiatives For Dairy Products Industry
2.9. Dairy Products Market Trade Analysis
2.10. The Global Pandemic Impact on Dairy Products Market

3. Dairy Products Market: Global Market Size and Forecast by Segmentation by Demand and Supply Side (by Value in USD Million) 2024-2032
3.1. Dairy Products Market Size and Forecast, by Product Type (2024-2032)
3.1.1. Milk
3.1.2. Cheese
3.1.3. Butter
3.1.4. Yogurt
3.1.5. Cream
3.1.6. Milk Powder
3.1.7. UTH Milk

3.2. Dairy Products Market Size and Forecast, by Application (2024-2032)
3.2.1. Food and Beverages
3.2.2. Bakery and Confectionary
3.2.3. Clinical Nutrition

3.3. Dairy Products Market Size and Forecast, by End User (2024-2032)
3.3.1. Supermarket
3.3.2. Online Channel
3.3.3. Speciality Stores
3.3.4. Convenience Store

3.4. Dairy Products Market Size and Forecast, by Region (2024-2032)
3.4.1. North America
3.4.2. Europe
3.4.3. Asia Pacific
3.4.4. Middle East and Africa
3.4.5. South America

4. North America Dairy Products Market Size and Forecast by Segmentation (by Value in USD Million) 2024-2032
4.1. North America Dairy Products Market Size and Forecast, by Product Type (2024-2032)
4.1.1. Milk
4.1.2. Cheese
4.1.3. Butter
4.1.4. Yogurt
4.1.5. Cream
4.1.6. Milk Powder
4.1.7. UTH Milk

4.2. North America Dairy Products Market Size and Forecast, by Application (2024-2032)
4.2.1. Food and Beverages
4.2.2. Bakery and Confectionary
4.2.3. Clinical Nutrition

4.3. North America Dairy Products Market Size and Forecast, by End User (2024-2032)
4.3.1. Supermarket
4.3.2. Online Channel
4.3.3. Speciality Stores
4.3.4. Convenience Store

4.4. North America Dairy Products Market Size and Forecast, by Country (2024-2032)
4.4.1. United States
4.4.1.1. United States Dairy Products Market Size and Forecast, by Product Type (2024-2032)
4.4.1.1.1. Milk
4.4.1.1.2. Cheese
4.4.1.1.3. Butter
4.4.1.1.4. Yogurt
4.4.1.1.5. Cream
4.4.1.1.6. Milk Powder
4.4.1.1.7. UTH Milk

4.4.1.2. United States Dairy Products Market Size and Forecast, by Application (2024-2032)
4.4.1.2.1. Food and Beverages
4.4.1.2.2. Bakery and Confectionary
4.4.1.2.3. Clinical Nutrition

4.4.1.3. United States Dairy Products Market Size and Forecast, by End User (2024-2032)
4.4.1.3.1. Supermarket
4.4.1.3.2. Online Channel
4.4.1.3.3. Speciality Stores
4.4.1.3.4. Convenience Store

4.4.2. Canada
4.4.2.1. Canada Dairy Products Market Size and Forecast, by Product Type (2024-2032)
4.4.2.1.1. Milk
4.4.2.1.2. Cheese
4.4.2.1.3. Butter
4.4.2.1.4. Yogurt
4.4.2.1.5. Cream
4.4.2.1.6. Milk Powder
4.4.2.1.7. UTH Milk

4.4.2.2. Canada Dairy Products Market Size and Forecast, by Application (2024-2032)
4.4.2.2.1. Food and Beverages
4.4.2.2.2. Bakery and Confectionary
4.4.2.2.3. Clinical Nutrition

4.4.2.3. Canada Dairy Products Market Size and Forecast, by End User (2024-2032)
4.4.2.3.1. Supermarket
4.4.2.3.2. Online Channel
4.4.2.3.3. Speciality Stores
4.4.2.3.4. Convenience Store

4.4.3. Mexico
4.4.3.1. Mexico Dairy Products Market Size and Forecast, by Product Type (2024-2032)
4.4.3.1.1. Milk
4.4.3.1.2. Cheese
4.4.3.1.3. Butter
4.4.3.1.4. Yogurt
4.4.3.1.5. Cream
4.4.3.1.6. Milk Powder
4.4.3.1.7. UTH Milk

4.4.3.2. Mexico Dairy Products Market Size and Forecast, by Application (2024-2032)
4.4.3.2.1. Food and Beverages
4.4.3.2.2. Bakery and Confectionary
4.4.3.2.3. Clinical Nutrition

4.4.3.3. Mexico Dairy Products Market Size and Forecast, by End User (2024-2032)
4.4.3.3.1. Supermarket
4.4.3.3.2. Online Channel
4.4.3.3.3. Speciality Stores
4.4.3.3.4. Convenience Store

5. Europe Dairy Products Market Size and Forecast by Segmentation (by Value in USD Million) 2024-2032
5.1. Europe Dairy Products Market Size and Forecast, by Product Type (2024-2032)
5.2. Europe Dairy Products Market Size and Forecast, by Application (2024-2032)
5.3. Europe Dairy Products Market Size and Forecast, by End User (2024-2032)
5.4. Europe Dairy Products Market Size and Forecast, by Country (2024-2032)
5.4.1. United Kingdom
5.4.1.1. United Kingdom Dairy Products Market Size and Forecast, by Product Type (2024-2032)
5.4.1.2. United Kingdom Dairy Products Market Size and Forecast, by Application (2024-2032)
5.4.1.3. United Kingdom Dairy Products Market Size and Forecast, by End User (2024-2032)
5.4.2. France
5.4.2.1. France Dairy Products Market Size and Forecast, by Product Type (2024-2032)
5.4.2.2. France Dairy Products Market Size and Forecast, by Application (2024-2032)
5.4.2.3. France Dairy Products Market Size and Forecast, by End User (2024-2032)
5.4.3. Germany
5.4.3.1. Germany Dairy Products Market Size and Forecast, by Product Type (2024-2032)
5.4.3.2. Germany Dairy Products Market Size and Forecast, by Application (2024-2032)
5.4.3.3. Germany Dairy Products Market Size and Forecast, by End User (2024-2032)
5.4.4. Italy
5.4.4.1. Italy Dairy Products Market Size and Forecast, by Product Type (2024-2032)
5.4.4.2. Italy Dairy Products Market Size and Forecast, by Application (2024-2032)
5.4.4.3. Italy Dairy Products Market Size and Forecast, by End User (2024-2032)
5.4.5. Spain
5.4.5.1. Spain Dairy Products Market Size and Forecast, by Product Type (2024-2032)
5.4.5.2. Spain Dairy Products Market Size and Forecast, by Application (2024-2032)
5.4.5.3. Spain Dairy Products Market Size and Forecast, by End User (2024-2032)
5.4.6. Sweden
5.4.6.1. Sweden Dairy Products Market Size and Forecast, by Product Type (2024-2032)
5.4.6.2. Sweden Dairy Products Market Size and Forecast, by Application (2024-2032)
5.4.6.3. Sweden Dairy Products Market Size and Forecast, by End User (2024-2032)
5.4.7. Austria
5.4.7.1. Austria Dairy Products Market Size and Forecast, by Product Type (2024-2032)
5.4.7.2. Austria Dairy Products Market Size and Forecast, by Application (2024-2032)
5.4.7.3. Austria Dairy Products Market Size and Forecast, by End User (2024-2032)
5.4.8. Rest of Europe
5.4.8.1. Rest of Europe Dairy Products Market Size and Forecast, by Product Type (2024-2032)
5.4.8.2. Rest of Europe Dairy Products Market Size and Forecast, by Application (2024-2032)
5.4.8.3. Rest of Europe Dairy Products Market Size and Forecast, by End User (2024-2032)

6. Asia Pacific Dairy Products Market Size and Forecast by Segmentation (by Value in USD Million) 2024-2032
6.1. Asia Pacific Dairy Products Market Size and Forecast, by Product Type (2024-2032)
6.2. Asia Pacific Dairy Products Market Size and Forecast, by Application (2024-2032)
6.3. Asia Pacific Dairy Products Market Size and Forecast, by End User (2024-2032)
6.4. Asia Pacific Dairy Products Market Size and Forecast, by Country (2024-2032)
6.4.1. China
6.4.1.1. China Dairy Products Market Size and Forecast, by Product Type (2024-2032)
6.4.1.2. China Dairy Products Market Size and Forecast, by Application (2024-2032)
6.4.1.3. China Dairy Products Market Size and Forecast, by End User (2024-2032)
6.4.2. S Korea
6.4.2.1. S Korea Dairy Products Market Size and Forecast, by Product Type (2024-2032)
6.4.2.2. S Korea Dairy Products Market Size and Forecast, by Application (2024-2032)
6.4.2.3. S Korea Dairy Products Market Size and Forecast, by End User (2024-2032)
6.4.3. Japan
6.4.3.1. Japan Dairy Products Market Size and Forecast, by Product Type (2024-2032)
6.4.3.2. Japan Dairy Products Market Size and Forecast, by Application (2024-2032)
6.4.3.3. Japan Dairy Products Market Size and Forecast, by End User (2024-2032)
6.4.4. India
6.4.4.1. India Dairy Products Market Size and Forecast, by Product Type (2024-2032)
6.4.4.2. India Dairy Products Market Size and Forecast, by Application (2024-2032)
6.4.4.3. India Dairy Products Market Size and Forecast, by End User (2024-2032)
6.4.5. Australia
6.4.5.1. Australia Dairy Products Market Size and Forecast, by Product Type (2024-2032)
6.4.5.2. Australia Dairy Products Market Size and Forecast, by Application (2024-2032)
6.4.5.3. Australia Dairy Products Market Size and Forecast, by End User (2024-2032)
6.4.6. Indonesia
6.4.6.1. Indonesia Dairy Products Market Size and Forecast, by Product Type (2024-2032)
6.4.6.2. Indonesia Dairy Products Market Size and Forecast, by Application (2024-2032)
6.4.6.3. Indonesia Dairy Products Market Size and Forecast, by End User (2024-2032)
6.4.7. Malaysia
6.4.7.1. Malaysia Dairy Products Market Size and Forecast, by Product Type (2024-2032)
6.4.7.2. Malaysia Dairy Products Market Size and Forecast, by Application (2024-2032)
6.4.7.3. Malaysia Dairy Products Market Size and Forecast, by End User (2024-2032)
6.4.8. Vietnam
6.4.8.1. Vietnam Dairy Products Market Size and Forecast, by Product Type (2024-2032)
6.4.8.2. Vietnam Dairy Products Market Size and Forecast, by Application (2024-2032)
6.4.8.3. Vietnam Dairy Products Market Size and Forecast, by End User (2024-2032)
6.4.9. Taiwan
6.4.9.1. Taiwan Dairy Products Market Size and Forecast, by Product Type (2024-2032)
6.4.9.2. Taiwan Dairy Products Market Size and Forecast, by Application (2024-2032)
6.4.9.3. Taiwan Dairy Products Market Size and Forecast, by End User (2024-2032)
6.4.10. Rest of Asia Pacific
6.4.10.1. Rest of Asia Pacific Dairy Products Market Size and Forecast, by Product Type (2024-2032)
6.4.10.2. Rest of Asia Pacific Dairy Products Market Size and Forecast, by Application (2024-2032)
6.4.10.3. Rest of Asia Pacific Dairy Products Market Size and Forecast, by End User (2024-2032)

7. Middle East and Africa Dairy Products Market Size and Forecast by Segmentation (by Value in USD Million) 2024-2032
7.1. Middle East and Africa Dairy Products Market Size and Forecast, by Product Type (2024-2032)
7.2. Middle East and Africa Dairy Products Market Size and Forecast, by Application (2024-2032)
7.3. Middle East and Africa Dairy Products Market Size and Forecast, by End User (2024-2032)
7.4. Middle East and Africa Dairy Products Market Size and Forecast, by Country (2024-2032)
7.4.1. South Africa
7.4.1.1. South Africa Dairy Products Market Size and Forecast, by Product Type (2024-2032)
7.4.1.2. South Africa Dairy Products Market Size and Forecast, by Application (2024-2032)
7.4.1.3. South Africa Dairy Products Market Size and Forecast, by End User (2024-2032)
7.4.2. GCC
7.4.2.1. GCC Dairy Products Market Size and Forecast, by Product Type (2024-2032)
7.4.2.2. GCC Dairy Products Market Size and Forecast, by Application (2024-2032)
7.4.2.3. GCC Dairy Products Market Size and Forecast, by End User (2024-2032)
7.4.3. Nigeria
7.4.3.1. Nigeria Dairy Products Market Size and Forecast, by Product Type (2024-2032)
7.4.3.2. Nigeria Dairy Products Market Size and Forecast, by Application (2024-2032)
7.4.3.3. Nigeria Dairy Products Market Size and Forecast, by End User (2024-2032)
7.4.4. Rest of ME&A
7.4.4.1. Rest of ME&A Dairy Products Market Size and Forecast, by Product Type (2024-2032)
7.4.4.2. Rest of ME&A Dairy Products Market Size and Forecast, by Application (2024-2032)
7.4.4.3. Rest of ME&A Dairy Products Market Size and Forecast, by End User (2024-2032)

8. South America Dairy Products Market Size and Forecast by Segmentation (by Value in USD Million) 2024-2032
8.1. South America Dairy Products Market Size and Forecast, by Product Type (2024-2032)
8.2. South America Dairy Products Market Size and Forecast, by Application (2024-2032)
8.3. South America Dairy Products Market Size and Forecast, by End User(2024-2032)
8.4. South America Dairy Products Market Size and Forecast, by Country (2024-2032)
8.4.1. Brazil
8.4.1.1. Brazil Dairy Products Market Size and Forecast, by Product Type (2024-2032)
8.4.1.2. Brazil Dairy Products Market Size and Forecast, by Application (2024-2032)
8.4.1.3. Brazil Dairy Products Market Size and Forecast, by End User (2024-2032)
8.4.2. Argentina
8.4.2.1. Argentina Dairy Products Market Size and Forecast, by Product Type (2024-2032)
8.4.2.2. Argentina Dairy Products Market Size and Forecast, by Application (2024-2032)
8.4.2.3. Argentina Dairy Products Market Size and Forecast, by End User (2024-2032)
8.4.3. Rest Of South America
8.4.3.1. Rest Of South America Dairy Products Market Size and Forecast, by Product Type (2024-2032)
8.4.3.2. Rest Of South America Dairy Products Market Size and Forecast, by Application (2024-2032)
8.4.3.3. Rest Of South America Dairy Products Market Size and Forecast, by End User (2024-2032)

9. Global Dairy Products Market: Competitive Landscape
9.1. MMR Competition Matrix
9.2. Competitive Landscape
9.3. Key Players Benchmarking
9.3.1. Company Name
9.3.2. Business Segment
9.3.3. End-user Segment
9.3.4. Revenue (2022)
9.3.5. Company Locations
9.4. Leading Dairy Products Market Companies, by market capitalization
9.5. Market Structure
9.5.1. Market Leaders
9.5.2. Market Followers
9.5.3. Emerging Players
9.6. Mergers and Acquisitions Details

10. Company Profile: Key Players
10.1. Fonterra Co-operative Group (U.S)
10.1.1. Company Overview
10.1.2. Business Portfolio
10.1.3. Financial Overview
10.1.4. SWOT Analysis
10.1.5. Strategic Analysis
10.1.6. Scale of Operation (small, medium, and large)
10.1.7. Details on Partnership
10.1.8. Regulatory Accreditations and Certifications Received by Them
10.1.9. Awards Received by the Firm
10.1.10. Recent Developments
10.2. Dairy Farmers of America, Inc. (U.S)
10.3. Dairy Farmers of America (U.S)
10.4. Saputo Inc (U.S)
10.5. The Kraft Heinz Company (U.S)
10.6. Dean Foods Company (U.S)
10.7. Unilever N (U.S)
10.8. Arla Foods amba (Denmark)
10.9. Danone (France)
10.10. Nestle S.A. (Switzerland)
10.11. Danone S.A. (France)
10.12. Royal FrieslandCampina (Netherland)
10.13. DMK Group (Germany)
10.14. Lactalis (France)
10.15. Parmalat S.P.A (Italy)
10.16. Amul (India)
10.17. China Mengniu Dairy Company Limited (China)
10.18. Britannia Industries Limited (India)
10.19. Meiji Holdings Co., Ltd. (Japan)
10.20. Sancor Cooperativas Unidas Limited (Argentina)

11. Key Findings

12. Industry Recommendations

13. Dairy Products Market: Research Methodology

14. Terms and Glossary
