Telecom Billing and Revenue Management Market – Industry Analysis and Forecast (2024-2030)

Telecom Billing and Revenue Management Market size was valued at US$ 16.28 Bn in 2023 and is expected to reach US$ 33.38 Bn in year 2030, at a CAGR of 10.8% during the forecast period.

Telecom Billing and Revenue Management Market Overview

The process of acquiring consumption data, aggregating it, adding necessary charges, and finally creating invoices for users is known as telecom billing. Receiving and recording payments from customers is also part of the procedure. Billing systems are sometimes referred to as accounts receivable since they aid in the collection of funds from clients. Revenue management aids in the prediction of customer behavior, which in turn aids in the improvement of product accessibility and price to maximize revenue. Global telecom operators and communication service providers (CSPs) have seen a considerable change in the number of end-users and their demands over the past few decades. In the future, Artificial Intelligence (AI) and automation are expected to play an increasingly crucial role in the Telecom Billing and Revenue Management Market. Blockchain technology is expected to find applications in the Telecom Billing and Revenue Management Industry to enhance security and transparency, and reducing fraud. The market is expected to remain a critical enabler of financial success and operational efficiency for telecommunications service providers due to the continuous innovations in the industry.Telecom Billing and Revenue Management Market
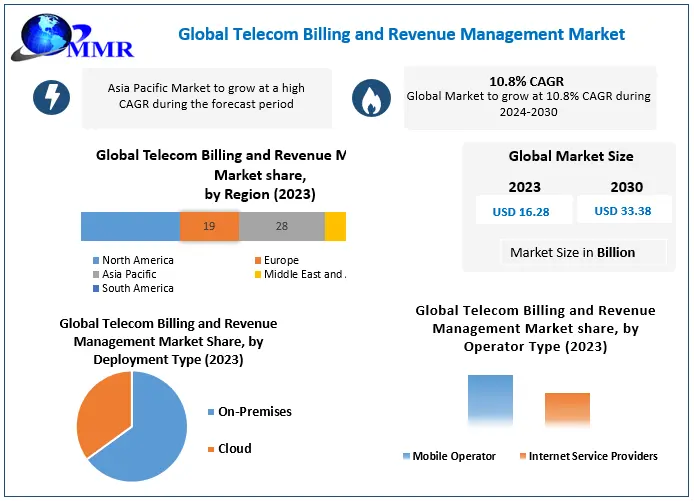
To know about the Research Methodology :- Request Free Sample Report

Telecom Billing and Revenue Management Market Dynamics

Driver: Growing Subscriber Base With the increase in demand for broadband and internet services, especially in developing markets, the subscriber base for telecom services is continuously growing. This is majorly necessitating robust billing and revenue management systems to accommodate diverse service offerings and billing models. Thus, resulting in contribution to the Telecom Billing and Revenue Management Market growth. Rogers, one of the leading Canadian telecommunications companies, surpassed quarterly profit expectations and achieved its highest-ever growth in wireless subscribers, driven by increased demand from a surge in students and immigrants entering the country. The company outperformed Visible Alpha's estimates by adding 225,000 monthly bill-paying wireless subscribers during the September quarter in 2023, surpassing the anticipated net additions of 186,210. In an effort to stimulate growth, telecom companies have implemented strategies such as offering bundled plans and heightened promotional activities. This move is particularly significant in a market where wireless charges rank among the highest globally. Telecom Billing and Revenue Management Market1 Opportunity: Data Monetization and Analytics BRM systems including advanced analytics capabilities enable telecom operators to derive valuable insights from customer data. Operators utilize these insights to refine pricing strategies, to launch targeted marketing campaigns, and to optimize network performance. Telecom operators explore opportunities to monetize customer data by providing anonymized and aggregated data to third-party advertisers, businesses, and researchers. These efforts telecom operators to monetize customer data is creating opportunities for the growth of Telecom Billing and Revenue Management Market. BRM systems play a crucial role in ensuring compliance with data protection regulations and enables data monetization initiatives. Challenge: Regulatory Compliance and Data Protection The telecom industry highly operates in a regulatory environment, with evolving standards and compliance requirements. Adapting to changes in data protection laws, consumer rights, and billing regulations poses a major challenge for operators and BRM solution providers. The adaption of these changes is key challenge for the Telecom Billing and Revenue Management Market. the As telecom operators are increasingly collecting and managing vast amounts of customer data, ensuring data security and privacy is becoming paramount. BRM systems are required to adhere to stringent security standards and protect sensitive customer information to reduce the risk of data breaches and regulatory penalties. Financial transactions are seldom isolated events; instead, they represent stages within the broader lifecycle of business operations, leading to a cascade of subsequent transactions. These transaction multipliers significantly increase the overall volume of financial transactions in today's dynamic business environment. Therefore, scalability requirements must encompass the potential outcomes of each individual transaction. Whether it's generating an invoice, creating a sales order, or undertaking any other transaction, the resultant output can range from just a few lines to potentially a thousand lines. For modern enterprises to thrive, they need the capacity to seamlessly manage the possibility of handling millions of financial transactions on a daily basis.

Telecom Billing and Revenue Management Market Segment Analysis

Based on Component: The market is segmented into Solutions, Services and Others. The Solutions segment dominated the global market with the largest Telecom Billing and Revenue Management Market share in 2023. Within the Solutions segment, the Billing and Charging segment held the dominant share. These solutions automate the billing process by accurately calculating and generating bills for the services that are provided to customers. They handle various billing models, such as prepaid, postpaid, and hybrid and ensure accurate and transparent invoicing.Telecom Billing and Revenue Management Market2 
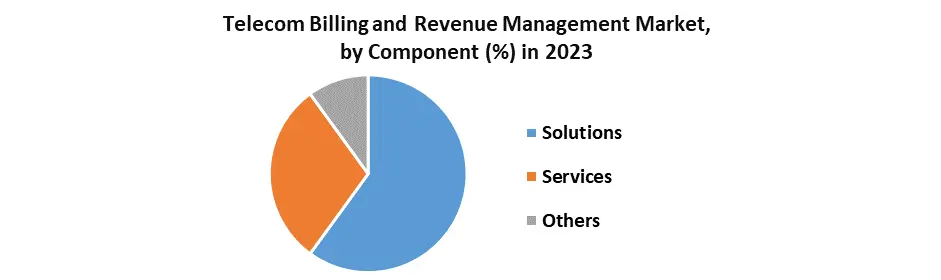
Based on Operator Type: The market is segmented into Mobile Operator and Internet Service Providers. The Mobile Operator held the largest Telecom Billing and Revenue Management Market share in 2023. This is attributed to the global surge in mobile penetration and the significant expansion of subscriber bases across diverse regions. Projections indicate that this segment is poised to experience the highest Compound Annual Growth Rate (CAGR) throughout the forecast period. In response to intensified competition, mobile operators are strategically focusing on optimizing service performance and enhancing customer experience management through proactive management of the network, end-user data, and service delivery.

Telecom Billing and Revenue Management Market Regional Insights

North American Telecom Billing and Revenue Management Market held the largest share in the global market in 2023. As a key player in the global telecommunications industry, the region presents a unique set of challenges and opportunities for operators, and the effective management of billing and revenue processes is important for success. The region is at the technologically advanced in the telecom sector. The increasing adoption of 5G, the Internet of Things (IoT), and advanced communication services is highly necessitating sophisticated BRM solutions to handle the complexities associated with these technologies. Asia Pacific Telecom Billing and Revenue Management Market to grow rapidly during the forecast period. The region includes a wide range of economies, from highly developed markets such as Japan and South Korea to emerging markets such as India, Indonesia, and Vietnam. This diversity is creating a complex landscape with varied regulatory environments, customer behaviors, and technological infrastructures. The diverse economies in the region is expected to continue to embrace digital transformation, telecom operators are seeking advanced solutions to effectively manage billing processes and optimize revenue streams during the forecast period. In 2023, SLT-Mobitel, the leading national ICT solutions provider in Sri Lanka, has chosen Netcracker Digital BSS and Professional Services for the enhancement of its billing system. This initiative aims to integrate upgraded fixed, mobile, and online charging capabilities within a unified framework. Netcracker Technology, renowned for providing mission-critical digital transformation solutions to global service providers, asserts that its comprehensive solution will play a pivotal role in enabling SLT-Mobitel to streamline its brands and consolidate its IT infrastructure. This strategic move aligns with the company's growth trajectory, facilitating efficient operations in an evolving Telecom Billing and Revenue Management Market.

Telecom Billing and Revenue Management Market Scope: Inquire before buying

Global Telecom Billing and Revenue Management Market
Report Coverage Details
Base Year: 2023 Forecast Period: 2024-2030
Historical Data: 2018 to 2023 Market Size in 2023: US $ 16.28 Bn.
Forecast Period 2024 to 2030 CAGR: 10.8% Market Size in 2030: US $ 33.38 Bn.
Segments Covered: By Component Solutions Mediation Billing and Charging Revenue Assurance Fraud Management Services Professional Services Managed Services Others
By Deployment Model On-premises Cloud
By Operator Type Mobile Operator Internet Service Providers

Global Telecom Billing and Revenue Management Market, by Region

North America (United States, Canada and Mexico) Europe (UK, France, Germany, Italy, Spain, Sweden, Austria and Rest of Europe) Asia Pacific (China, South Korea, Japan, India, Australia, Indonesia, Malaysia, Vietnam, Taiwan, Bangladesh, Pakistan and Rest of APAC) Middle East and Africa (South Africa, GCC, Egypt, Nigeria and Rest of ME&A) South America (Brazil, Argentina Rest of South America)

Telecom Billing and Revenue Management Key Players

Global 1. Amdocs Corporation - [Headquarters: Chesterfield, Missouri, USA] 2. Oracle Corporation - [Headquarters: Redwood City, California, USA] 3. CSG Systems International, Inc. - [Headquarters: Greenwood Village, Colorado, USA] North America: 1. HP Development Company, L.P. (Hewlett Packard Enterprise) - [Headquarters: Palo Alto, California, USA] 2. Netcracker Technology Corp. - [Headquarters: Waltham, Massachusetts, USA] 3. Optiva, Inc. - [Headquarters: Toronto, Ontario, Canada] Europe: 1. Accenture plc - [Headquarters: Dublin, Ireland] 2. Cerillion - [Headquarters: London, United Kingdom] 3. Comarch SA. - [Headquarters: Krakow, Poland] 4. Formula Telecom Solutions Ltd. - [Headquarters: London, United Kingdom] 5. Intracom Telecom - [Headquarters: Peania, Greece] 6. SAP SE - [Headquarters: Walldorf, Germany] 7. Openet Corporation - [Headquarters: Dublin, Ireland] Asia Pacific: 1. Huawei Technologies Co., Ltd. - [Headquarters: Shenzhen, China] 2. Mahindra Comviva - [Headquarters: Gurgaon, India] 3. Sterlite Tech - [Headquarters: Pune, India]

Frequently Asked Questions:

1. Which region held the largest Telecom Billing and Revenue Management Market share in 2023? Ans: Asia Pacific region held the largest market share in 2023. 2. What is the expected CAGR of Global Telecom Billing and Revenue Management Market during the forecast period? Ans: The Global Telecom Billing and Revenue Management Market is expected to grow at a CAGR of 10.8% during the forecast period. 3. What is scope of the Global Telecom Billing and Revenue Management Market report? Ans: Global Telecom Billing and Revenue Management Market report helps with the PESTLE, PORTER, COVID-19 Impact analysis, Recommendations for Investors & Leaders, and market estimation of the forecast period. 4. Who are the key players in Telecom Billing and Revenue Management Industry? Ans: The key players in the Telecom Billing and Revenue Management Industry are – Accenture plc, AmdocsCorporation, Cerillion, Comarch SA., CSG Systems International, Inc., Formula Telecom Solutions Ltd., HP Development Company, L.P., Huawei Technologies Co., Ltd., Intracom Telecom, Mahindra Comviva, Netcracker Technology Corp., Openet Corporation, Optiva, Inc., Oracle Corporation, SAP SE, Sterlite Tech, and Other Key Players 5. What is the forecast period of the Global Telecom Billing and Revenue Management Market report? Ans: The forecast period of the Global Telecom Billing and Revenue Management Market report is 2024-2030.
1. Telecom Billing and Revenue Management Market Introduction 1.1. Study Assumption and Market Definition 1.2. Scope of the Study 1.3. Executive Summary 2. Telecom Billing and Revenue Management Market: Dynamics 2.1. Telecom Billing and Revenue Management Market Trends 2.2. Telecom Billing and Revenue Management Market Dynamics by Region 2.2.1. Market Drivers 2.2.2. Market Restraints 2.2.3. Market Opportunities 2.2.4. Market Challenges 2.3. PORTER’s Five Types Analysis 2.4. PESTLE Analysis 2.5. Government Initiatives for the Telecom Billing and Revenue Management Industry 2.6. Regulatory Landscape by Region 2.6.1. North America 2.6.2. Europe 2.6.3. Asia Pacific 2.6.4. Middle East and Africa 2.6.5. South America 2.7. The Global Pandemic Impact on the Telecom Billing and Revenue Management Market 3. Telecom Billing and Revenue Management Market: Global Market Size and Forecast (by Value) (2023-2030) 3.1. Telecom Billing and Revenue Management Market Size and Forecast, by Component (2023-2030) 3.1.1. Solutions 3.1.1.1. Mediation 3.1.1.2. Billing and Charging 3.1.1.3. Revenue Assurance 3.1.1.4. Fraud Management 3.1.2. Services 3.1.2.1. Professional Services 3.1.2.2. Managed Services 3.1.3. Others 3.2. Telecom Billing and Revenue Management Market Size and Forecast, by Deployment Model (2023-2030) 3.2.1. On-premises 3.2.2. Cloud 3.3. Telecom Billing and Revenue Management Market Size and Forecast, Operator Type (2023-2030) 3.3.1. Mobile Operator 3.3.2. Internet Service Providers 3.4. Telecom Billing and Revenue Management Market Size and Forecast, by Region (2023-2030) 3.4.1. North America 3.4.2. Europe 3.4.3. Asia Pacific 3.4.4. Middle East and Africa 3.4.5. South America 4. North America Telecom Billing and Revenue Management Market Size and Forecast (by Value) (2023-2030) 4.1. North America Telecom Billing and Revenue Management Market Size and Forecast, by Component (2023-2030) 4.1.1. Solutions 4.1.1.1. Mediation 4.1.1.2. Billing and Charging 4.1.1.3. Revenue Assurance 4.1.1.4. Fraud Management 4.1.2. Services 4.1.2.1. Professional Services 4.1.2.2. Managed Services 4.1.3. Others 4.2. North America Telecom Billing and Revenue Management Market Size and Forecast, by Deployment Model (2023-2030) 4.2.1. On-premises 4.2.2. Cloud 4.3. North America Telecom Billing and Revenue Management Market Size and Forecast, Operator Type (2023-2030) 4.3.1. Mobile Operator 4.3.2. Internet Service Providers 4.4. North America Telecom Billing and Revenue Management Market Size and Forecast, by Country (2023-2030) 4.4.1. United States 4.4.1.1. United States Telecom Billing and Revenue Management Market Size and Forecast, by Component (2023-2030) 4.4.1.1.1. Solutions 4.4.1.1.1.1. Mediation 4.4.1.1.1.2. Billing and Charging 4.4.1.1.1.3. Revenue Assurance 4.4.1.1.1.4. Fraud Management 4.4.1.1.2. Services 4.4.1.1.2.1. Professional Services 4.4.1.1.2.2. Managed Services 4.4.1.1.3. Others 4.4.1.2. United States Telecom Billing and Revenue Management Market Size and Forecast, by Deployment Model (2023-2030) 4.4.1.2.1. On-premises 4.4.1.2.2. Cloud 4.4.1.3. United States Telecom Billing and Revenue Management Market Size and Forecast, Operator Type (2023-2030) 4.4.1.3.1. Mobile Operator 4.4.1.3.2. Internet Service Providers 4.4.2. Canada 4.4.2.1. Canada Telecom Billing and Revenue Management Market Size and Forecast, by Component (2023-2030) 4.4.2.1.1. Solutions 4.4.2.1.1.1. Mediation 4.4.2.1.1.2. Billing and Charging 4.4.2.1.1.3. Revenue Assurance 4.4.2.1.1.4. Fraud Management 4.4.2.1.2. Services 4.4.2.1.2.1. Professional Services 4.4.2.1.2.2. Managed Services 4.4.2.1.3. Others 4.4.2.2. Canada Telecom Billing and Revenue Management Market Size and Forecast, by Deployment Model (2023-2030) 4.4.2.2.1. On-premises 4.4.2.2.2. Cloud 4.4.2.3. Canada Telecom Billing and Revenue Management Market Size and Forecast, Operator Type (2023-2030) 4.4.2.3.1. Mobile Operator 4.4.2.3.2. Internet Service Providers 4.4.3. Mexico 4.4.3.1. Mexico Telecom Billing and Revenue Management Market Size and Forecast, by Component (2023-2030) 4.4.3.1.1. Solutions 4.4.3.1.1.1. Mediation 4.4.3.1.1.2. Billing and Charging 4.4.3.1.1.3. Revenue Assurance 4.4.3.1.1.4. Fraud Management 4.4.3.1.2. Services 4.4.3.1.2.1. Professional Services 4.4.3.1.2.2. Managed Services 4.4.3.1.3. Others 4.4.3.2. Mexico Telecom Billing and Revenue Management Market Size and Forecast, by Deployment Model (2023-2030) 4.4.3.2.1. On-premises 4.4.3.2.2. Cloud 4.4.3.3. Mexico Telecom Billing and Revenue Management Market Size and Forecast, by Deployment Model (2023-2030) 4.4.3.3.1. Mobile Operator 4.4.3.3.2. Internet Service Providers 5. Europe Telecom Billing and Revenue Management Market Size and Forecast (by Value in USD Million) (2023-2030) 5.1. Europe Telecom Billing and Revenue Management Market Size and Forecast, by Component (2023-2030) 5.2. Europe Telecom Billing and Revenue Management Market Size and Forecast, by Deployment Model (2023-2030) 5.3. Europe Telecom Billing and Revenue Management Market Size and Forecast, Operator Type (2023-2030) 5.4. Europe Telecom Billing and Revenue Management Market Size and Forecast, by Country (2023-2030) 5.4.1. United Kingdom 5.4.1.1. United Kingdom Telecom Billing and Revenue Management Market Size and Forecast, by Component (2023-2030) 5.4.1.2. United Kingdom Telecom Billing and Revenue Management Market Size and Forecast, by Deployment Model (2023-2030) 5.4.1.3. United Kingdom Telecom Billing and Revenue Management Market Size and Forecast, Operator Type (2023-2030) 5.4.2. France 5.4.2.1. France Telecom Billing and Revenue Management Market Size and Forecast, by Component (2023-2030) 5.4.2.2. France Telecom Billing and Revenue Management Market Size and Forecast, by Deployment Model (2023-2030) 5.4.2.3. France Telecom Billing and Revenue Management Market Size and Forecast, Operator Type (2023-2030) 5.4.3. Germany 5.4.3.1. Germany Telecom Billing and Revenue Management Market Size and Forecast, by Component (2023-2030) 5.4.3.2. Germany Telecom Billing and Revenue Management Market Size and Forecast, by Deployment Model (2023-2030) 5.4.3.3. Germany Telecom Billing and Revenue Management Market Size and Forecast, Operator Type (2023-2030) 5.4.4. Italy 5.4.4.1. Italy Telecom Billing and Revenue Management Market Size and Forecast, by Component (2023-2030) 5.4.4.2. Italy Telecom Billing and Revenue Management Market Size and Forecast, by Deployment Model (2023-2030) 5.4.4.3. Italy Telecom Billing and Revenue Management Market Size and Forecast, Operator Type (2023-2030) 5.4.5. Spain 5.4.5.1. Spain Telecom Billing and Revenue Management Market Size and Forecast, by Component (2023-2030) 5.4.5.2. Spain Telecom Billing and Revenue Management Market Size and Forecast, by Deployment Model (2023-2030) 5.4.5.3. Spain Telecom Billing and Revenue Management Market Size and Forecast, Operator Type (2023-2030) 5.4.6. Sweden 5.4.6.1. Sweden Telecom Billing and Revenue Management Market Size and Forecast, by Component (2023-2030) 5.4.6.2. Sweden Telecom Billing and Revenue Management Market Size and Forecast, by Deployment Model (2023-2030) 5.4.6.3. Sweden Telecom Billing and Revenue Management Market Size and Forecast, Operator Type (2023-2030) 5.4.7. Austria 5.4.7.1. Austria Telecom Billing and Revenue Management Market Size and Forecast, by Component (2023-2030) 5.4.7.2. Austria Telecom Billing and Revenue Management Market Size and Forecast, by Deployment Model (2023-2030) 5.4.7.3. Austria Telecom Billing and Revenue Management Market Size and Forecast, Operator Type (2023-2030) 5.4.8. Rest of Europe 5.4.8.1. Rest of Europe Telecom Billing and Revenue Management Market Size and Forecast, by Component (2023-2030) 5.4.8.2. Rest of Europe Telecom Billing and Revenue Management Market Size and Forecast, by Deployment Model (2023-2030) 5.4.8.3. Rest of Europe Telecom Billing and Revenue Management Market Size and Forecast, Operator Type (2023-2030) 6. Asia Pacific Telecom Billing and Revenue Management Market Size and Forecast (by Value in USD Million) (2023-2030) 6.1. Asia Pacific Telecom Billing and Revenue Management Market Size and Forecast, by Component (2023-2030) 6.2. Asia Pacific Telecom Billing and Revenue Management Market Size and Forecast, by Deployment Model (2023-2030) 6.3. Asia Pacific Telecom Billing and Revenue Management Market Size and Forecast, Operator Type (2023-2030) 6.4. Asia Pacific Telecom Billing and Revenue Management Market Size and Forecast, by Country (2023-2030) 6.4.1. China 6.4.1.1. China Telecom Billing and Revenue Management Market Size and Forecast, by Component (2023-2030) 6.4.1.2. China Telecom Billing and Revenue Management Market Size and Forecast, by Deployment Model (2023-2030) 6.4.1.3. China Telecom Billing and Revenue Management Market Size and Forecast, Operator Type (2023-2030) 6.4.2. S Korea 6.4.2.1. S Korea Telecom Billing and Revenue Management Market Size and Forecast, by Component (2023-2030) 6.4.2.2. S Korea Telecom Billing and Revenue Management Market Size and Forecast, by Deployment Model (2023-2030) 6.4.2.3. S Korea Telecom Billing and Revenue Management Market Size and Forecast, Operator Type (2023-2030) 6.4.3. Japan 6.4.3.1. Japan Telecom Billing and Revenue Management Market Size and Forecast, by Component (2023-2030) 6.4.3.2. Japan Telecom Billing and Revenue Management Market Size and Forecast, by Deployment Model (2023-2030) 6.4.3.3. Japan Telecom Billing and Revenue Management Market Size and Forecast, Operator Type (2023-2030) 6.4.4. India 6.4.4.1. India Telecom Billing and Revenue Management Market Size and Forecast, by Component (2023-2030) 6.4.4.2. India Telecom Billing and Revenue Management Market Size and Forecast, by Deployment Model (2023-2030) 6.4.4.3. India Telecom Billing and Revenue Management Market Size and Forecast, Operator Type (2023-2030) 6.4.5. Australia 6.4.5.1. Australia Telecom Billing and Revenue Management Market Size and Forecast, by Component (2023-2030) 6.4.5.2. Australia Telecom Billing and Revenue Management Market Size and Forecast, by Deployment Model (2023-2030) 6.4.5.3. Australia Telecom Billing and Revenue Management Market Size and Forecast, Operator Type (2023-2030) 6.4.6. Indonesia 6.4.6.1. Indonesia Telecom Billing and Revenue Management Market Size and Forecast, by Component (2023-2030) 6.4.6.2. Indonesia Telecom Billing and Revenue Management Market Size and Forecast, by Deployment Model (2023-2030) 6.4.6.3. Indonesia Telecom Billing and Revenue Management Market Size and Forecast, Operator Type (2023-2030) 6.4.7. Malaysia 6.4.7.1. Malaysia Telecom Billing and Revenue Management Market Size and Forecast, by Component (2023-2030) 6.4.7.2. Malaysia Telecom Billing and Revenue Management Market Size and Forecast, by Deployment Model (2023-2030) 6.4.7.3. Malaysia Telecom Billing and Revenue Management Market Size and Forecast, Operator Type (2023-2030) 6.4.8. Vietnam 6.4.8.1. Vietnam Telecom Billing and Revenue Management Market Size and Forecast, by Component (2023-2030) 6.4.8.2. Vietnam Telecom Billing and Revenue Management Market Size and Forecast, by Deployment Model (2023-2030) 6.4.8.3. Vietnam Telecom Billing and Revenue Management Market Size and Forecast, Operator Type (2023-2030) 6.4.9. Taiwan 6.4.9.1. Taiwan Telecom Billing and Revenue Management Market Size and Forecast, by Component (2023-2030) 6.4.9.2. Taiwan Telecom Billing and Revenue Management Market Size and Forecast, by Deployment Model (2023-2030) 6.4.9.3. Taiwan Telecom Billing and Revenue Management Market Size and Forecast, Operator Type (2023-2030) 6.4.10. Rest of Asia Pacific 6.4.10.1. Rest of Asia Pacific Telecom Billing and Revenue Management Market Size and Forecast, by Component (2023-2030) 6.4.10.2. Rest of Asia Pacific Telecom Billing and Revenue Management Market Size and Forecast, by Deployment Model (2023-2030) 6.4.10.3. Rest of Asia Pacific Telecom Billing and Revenue Management Market Size and Forecast, Operator Type (2023-2030) 7. Middle East and Africa Telecom Billing and Revenue Management Market Size and Forecast (by Value in USD Million) (2023-2030) 7.1. Middle East and Africa Telecom Billing and Revenue Management Market Size and Forecast, by Component (2023-2030) 7.2. Middle East and Africa Telecom Billing and Revenue Management Market Size and Forecast, by Deployment Model (2023-2030) 7.3. Middle East and Africa Telecom Billing and Revenue Management Market Size and Forecast, Operator Type (2023-2030) 7.4. Middle East and Africa Telecom Billing and Revenue Management Market Size and Forecast, by Country (2023-2030) 7.4.1. South Africa 7.4.1.1. South Africa Telecom Billing and Revenue Management Market Size and Forecast, by Component (2023-2030) 7.4.1.2. South Africa Telecom Billing and Revenue Management Market Size and Forecast, by Deployment Model (2023-2030) 7.4.1.3. South Africa Telecom Billing and Revenue Management Market Size and Forecast, Operator Type (2023-2030) 7.4.2. GCC 7.4.2.1. GCC Telecom Billing and Revenue Management Market Size and Forecast, by Component (2023-2030) 7.4.2.2. GCC Telecom Billing and Revenue Management Market Size and Forecast, by Deployment Model (2023-2030) 7.4.2.3. GCC Telecom Billing and Revenue Management Market Size and Forecast, Operator Type (2023-2030) 7.4.3. Nigeria 7.4.3.1. Nigeria Telecom Billing and Revenue Management Market Size and Forecast, by Component (2023-2030) 7.4.3.2. Nigeria Telecom Billing and Revenue Management Market Size and Forecast, by Deployment Model (2023-2030) 7.4.3.3. Nigeria Telecom Billing and Revenue Management Market Size and Forecast, Operator Type (2023-2030) 7.4.4. Rest of ME&A 7.4.4.1. Rest of ME&A Telecom Billing and Revenue Management Market Size and Forecast, by Component (2023-2030) 7.4.4.2. Rest of ME&A Telecom Billing and Revenue Management Market Size and Forecast, by Deployment Model (2023-2030) 7.4.4.3. Rest of ME&A Telecom Billing and Revenue Management Market Size and Forecast, Operator Type (2023-2030) 8. South America Telecom Billing and Revenue Management Market Size and Forecast (by Value in USD Million) (2023-2030) 8.1. South America Telecom Billing and Revenue Management Market Size and Forecast, by Component (2023-2030) 8.2. South America Telecom Billing and Revenue Management Market Size and Forecast, by Deployment Model (2023-2030) 8.3. South America Telecom Billing and Revenue Management Market Size and Forecast, Operator Type (2023-2030) 8.4. South America Telecom Billing and Revenue Management Market Size and Forecast, by Country (2023-2030) 8.4.1. Brazil 8.4.1.1. Brazil Telecom Billing and Revenue Management Market Size and Forecast, by Component (2023-2030) 8.4.1.2. Brazil Telecom Billing and Revenue Management Market Size and Forecast, by Deployment Model (2023-2030) 8.4.1.3. Brazil Telecom Billing and Revenue Management Market Size and Forecast, Operator Type (2023-2030) 8.4.2. Argentina 8.4.2.1. Argentina Telecom Billing and Revenue Management Market Size and Forecast, by Component (2023-2030) 8.4.2.2. Argentina Telecom Billing and Revenue Management Market Size and Forecast, by Deployment Model (2023-2030) 8.4.2.3. Argentina Telecom Billing and Revenue Management Market Size and Forecast, Operator Type (2023-2030) 8.4.3. Rest Of South America 8.4.3.1. Rest Of South America Telecom Billing and Revenue Management Market Size and Forecast, by Component (2023-2030) 8.4.3.2. Rest Of South America Telecom Billing and Revenue Management Market Size and Forecast, by Deployment Model (2023-2030) 8.4.3.3. Rest Of South America Telecom Billing and Revenue Management Market Size and Forecast, Operator Type (2023-2030) 9. Global Telecom Billing and Revenue Management Market: Competitive Landscape 9.1. MMR Competition Matrix 9.2. Competitive Landscape 9.3. Key Players Benchmarking 9.3.1. Company Name 9.3.2. Product Segment 9.3.3. End-user Segment 9.3.4. Revenue (2022) 9.3.5. Company Locations 9.4. Leading Telecom Billing and Revenue Management Market Companies, by market capitalization 9.5. Market Structure 9.5.1. Market Leaders 9.5.2. Market Followers 9.5.3. Emerging Players 9.6. Mergers and Acquisitions Details 10. Company Profile: Key Players 10.1. Accenture plc 10.1.1. Company Overview 10.1.2. Business Portfolio 10.1.3. Financial Overview 10.1.4. SWOT Analysis 10.1.5. Strategic Analysis 10.1.6. Details on Partnership 10.1.7. Recent Developments 10.2. AmdocsCorporation 10.3. Cerillion 10.4. Comarch SA. 10.5. CSG Systems International, Inc. 10.6. Formula Telecom Solutions Ltd. 10.7. HP Development Company, L.P. 10.8. Huawei Technologies Co., Ltd. 10.9. Intracom Telecom 10.10. Mahindra Comviva 10.11. Netcracker Technology Corp. 10.12. Openet Corporation 10.13. Optiva, Inc. 10.14. Oracle Corporation 10.15. SAP SE 11. Key Findings 12. Industry Recommendations 13. Telecom Billing and Revenue Management Market: Research Methodology 14. Terms and Glossary
  • INQUIRE BEFORE BUYING