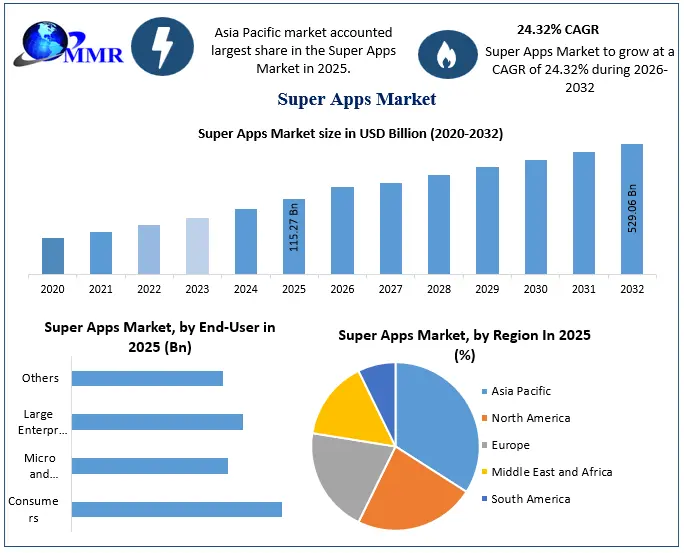
The Super Apps Market size was valued at USD 92.72 Bn. in 2024, and the total Super Apps revenue is expected to grow at a CAGR of 24.32% from 2025 to 2032, reaching nearly USD 529.06 Bn.Super Apps Market Overview
A super app is a mobile or web application that combines multiple services, such as payments, banking, e-commerce, and ride-hailing, into a single platform, offering an all-in-one experience. The e-commerce boom, with 72% of sales made via mobile ($4.5T), and shifting consumer preferences, 68% of whom prefer all-in-one platforms for convenience, drive the Super Apps Market. However, technological limitations in mid/low-end smartphones (e.g., 62% with <4GB RAM) restrain the Market growth. Opportunities lie in embedded finance (65% of users prefer in-app payments) and urbanization-driven demand. While high development costs challenge scalability. While Asia-Pacific leads adoption (1.8 B+ digital payment users), with giants like WeChat ($80B revenue) and Alipay. North America grows steadily, fueled by tech-savvy users and expanding ecosystems like Uber.Super Apps Market Recent Development
Company Date (2024) Region Country Recent Development Revolut June 20 Europe UK Added Revolut Stays, offering hotel bookings & rewards within its finance super app, marking a recent development in the super app market. Gojek (Go To) June 18 Southeast Asia Indonesia Partnered with Samsung Pay to enable seamless Go Pay transactions on Samsung devices, marking a recent development in the super app market. WeChat (Tencent) June 12 East Asia China Launched AI-powered shopping assistants within mini-programs & expanded cross-border payments to 10 new super apps, reflecting ongoing innovation by super app suppliers. Grab June 5 Southeast Asia Singapore Introduced the Grab Ultimate subscription plan, bundling ride-hailing, food delivery, and fintech discounts, showcasing strategic expansion by a leading super app manufacturer. To know about the Research Methodology :- Request Free Sample Report
Super Apps Market Dynamics
Growing E-Commerce Sector to Boost Super Apps Market Growth Mobile-aided shopping has driven rapid growth in the e-commerce market in recent years. Smartphones allow users to browse and select products easily. As m-commerce apps become more popular, the super apps market is expected to grow significantly.E-Commerce Growth Fueling Super Apps Market
Inadequate Technological Advancements in Smartphones to Create the market Restraints Smartphone manufacturers find it hard to keep up with mobile app developers. Many apps need advanced device features, which limits market growth. To solve this, consumers need to switch to more advanced devices that can run these apps smoothly.
Driver Global Impact (2024) Mobile Shopping Boom 72% of e-commerce sales via mobile ($4.5 trillion) Social Commerce Surge $1.2 trillion GMV from super app social features Embedded Payments 65% of super app users pay via in-app wallets Ultrafast Delivery Demand 55% of users expect delivery in <2 hours (e-grocery) BNPL Adoption 30% of super app transactions use buy-now-pay-later Cross-Border Shopping 40% growth in international purchases via super apps Global Smartphone Limitations Impacting the Super Apps Market
Changing Lifestyle and Consumer Preferences to Create Super Apps Market Opportunity Changing lifestyles and digital-first habits are boosting super app use, as 68% of users now prefer all-in-one platforms. Busy urban lives increase demand, with 55% of millennials using super apps for daily tasks and 42% valuing time-saving features. Buy Now, Pay Later use in super apps grew 90% year-over-year. Companies tapping into these trends see 30% more user engagement than single-service apps. High Cost of Super App Development to Create Super Apps Market Challenges Besides facilitating user activities with technological support, super apps require a high investment for their development. As smartphone super apps gain popularity, so does the demand for associated services, such as administration, maintenance, and infrastructure. All these factors are creating challenges in market growth.
Constraint High-End Devices Mid/Low-End Devices Impact on Super Apps Devices with <4GB RAM 5% 62% 40% higher crash rates 4G-Only Devices 8% 82% 5 G-only features (e.g., AR shopping) fail Storage <64GB 3% 58% 25% uninstall rate due to app bloat No AI Chipset (NPU) 12% 85% AI-driven recommendations lag Battery <4000mAh 18% 67% 30% of users abandon apps due to drain Super Apps Market Segment Analysis
Based on Service Type, the Super Apps Market is segmented into Payments & Financial Services, Commerce & Retail, Mobility & Logistics, Social & Communication, and Utilities & Lifestyle. The Payments & Financial Services segment dominated the Super Apps Market in 2024 and is expected to hold the largest market share over the forecast period. Due to holding over 45% of revenue share, driven by digital payment adoption and embedded finance. With 3.8 B+ global digital wallet users, super apps like Alipay and Paytm lead by integrating payments and insurance, boosting user retention. Mobile wallet transactions hit $14T in 2024, while 65% of super app users prefer in-app financial services. This dominance stems from high-frequency usage, regulatory push for cashless economies, and cross-selling fintech products. Based on the Business Model, the Super Apps Market is segmented into Transaction Fees, Subscription Services, Advertising, and Commission-Based. The Transaction Fees segment dominated the Super Apps Market in 2024 and is expected to hold the largest market share over the forecast period. Due to driven by digital payments and embedded finance. Government cashless policies (e.g., India’s UPI) boosted adoption, while BNPL grew 90% YoY. Subscriptions (15% share) and ads (12%) lagged due to low emerging-market uptake and ad fatigue. Commission-based models (8%) faced margin pressures. The dominance stems from high-frequency micropayments, though diversification into subscriptions and ads is rising for future growth.Based on End User, the market is segmented into Consumers (B2C) and Businesses (B2B). The consumers (B2C) segment dominated the Super Apps Market in 2024 and is expected to hold the largest market share over the forecast period. Due to the mass adoption of digital payments, shopping, and lifestyle services. Over 4.1B consumers used super apps for daily transactions (Statista), compared to only 22% B2B penetration (GSMA). Governments accelerated this via cashless initiatives (e.g., India’s UPI, Brazil’s Pix), while B2B growth lagged due to slower SME onboarding.
Super Apps Market Regional Analysis
Asia-Pacific Region Dominated the Global Super Apps Market in 2024 The Asia Pacific region dominates the global market and is poised for significant growth, driven by platforms like WeChat, Alipay, and Grab, which offer a wide range of services such as social networking and digital payments. Innovations are emerging, such as Indian Railways' super app, which consolidates multiple railway services, enhancing customer convenience and generating revenue. Collaborations among key players further stimulate market expansion, exemplified by Tencent Cloud's partnership with TribunNews to enhance the TribunX Super App in Indonesia. Asia-Pacific (APAC) Dominates Global Super Apps Market in 2024 – Key Statistics & Growth Drivers
Factor APAC Data Global Comparison Key Insight Mobile Penetration 95% smartphone adoption Global avg: 78% High accessibility to super apps Digital Payment Users 1.8 B+ (75% of global users) LatAm: 380M, Africa: 330M UPI (India), Alipay/WeChat Pay (China) drive adoption Super App Adoption Rate 68% of internet users North America: 32% Cultural preference for all-in-one apps E-Commerce GMV via Super Apps $2.8T (70% of global) Europe: $420B Integrated shopping, payments, and logistics Government Support UPI (India), Digital Yuan (China) Fragmented policies in the West National digital infrastructure boosts growth Fintech Integration 80% of super apps offer loans LatAm: 55%, Africa: 40% Embedded lending/insurance increases retention North America Is the Growing Region
North America is witnessing steady growth, with companies like Uber expanding their service ecosystems. Despite slower adoption compared to Asia, the region's tech-savvy consumers and high smartphone usage present opportunities for super app development, although regulatory and cultural factors will influence market dynamics. Overall, both regions are experiencing unique trajectories in the market, highlighting diverse opportunities and challenges.Super Apps Market Competitive Landscape
The global super app landscape is dominated by WeChat (Tencent) and Alipay (Ant Group), both headquartered in China. WeChat, with over $80 billion annual revenue, integrates messaging, payments, e-commerce, and mini-programs, serving 1.3 billion users. Alipay, generating $20+ billion yearly, leads in digital payments, lending, and lifestyle services with 1.2 billion users. While WeChat excels in social-commerce synergy, Alipay dominates financial services. Both face regional rivals like Grab (Southeast Asia) and Mercado Pago (South America), but their scale and ecosystem integration keep them unmatched in revenue and market penetration.Super Apps Market Scope: Inquire before buying
Super Apps Market Scope Report Coverage Details Base Year: 2024 Forecast Period: 2025-2032 Historical Data: 2019 to 2024 Market Size in 2024: USD 92.72 Bn. Forecast Period 2025 to 2032 CAGR: 24.32 % Market Size in 2032: USD 529.06 Bn. Segments Covered: by Service Type Payments & Financial Services E-Commerce & Retail Mobility & Logistics Social & Communication Utilities & Lifestyle by Business Model Type Transaction Fees (Payments, E-commerce) Subscription Services (Premium Features) Advertising (In-app promotions) by User Base Consumers (B2C) Businesses (B2B) Super Apps Market by Regions
North America (United States, Canada, and Mexico) Europe (UK, France, Germany, Italy, Spain, Sweden, Austria, and the Rest of Europe) Asia Pacific (China, South Korea, Japan, India, Australia, Indonesia, Malaysia, Vietnam, Philippines, Thailand, and the Rest of Asia Pacific) Middle East and Africa (South Africa, GCC, Egypt, Nigeria, and Rest of ME&A) South America (Brazil, Argentina, Rest of South America)Super Apps Market by Key Companies are:
North America 1. Uber – San Francisco, California, USA 2. X (formerly Twitter) – San Francisco, California, USA 3. Meta (Facebook, WhatsApp, Instagram) – Menlo Park, California, USA 4. PayPal & Venmo – San Jose, California, USA 5. Shopify – Ottawa, Ontario, Canada 6. RBC (Royal Bank of Canada) – Toronto, Ontario, Canada 7. Block (Square, Cash App) – Oakland, California, USA 8. Walmart (Walmart Pay, Walmart One) – Bentonville, Arkansas, USA 9. Revolut – London, UK Europe 1. Klarna – Stockholm, Sweden 2. Glovo – Barcelona, Spain 3. Bolt – Tallinn, Estonia 4. N26 – Berlin, Germany 5. Wise (formerly TransferWise) – London, UK 6. Vivid Money – Berlin, Germany 7. Lydia – Paris, France 8. PayPal (Europe Operations) – Luxembourg 9. Yandex Go (Expanding in Eastern Europe) – Amsterdam, Netherlands Asia Pacific 1. WeChat (Tencent) – Shenzhen, China 2. Alipay (Ant Group) – Hangzhou, China 3. Grab – Singapore 4. GoTo (Gojek + Tokopedia) – Jakarta, Indonesia 5. PayPay (SoftBank + Yahoo Japan) – Tokyo, Japan 6. Kakao (KakaoTalk, Kakao Pay, Kakao Bank) – Jeju, South Korea 7. Line (Line Pay, Line Bank) – Tokyo, Japan 8. Zalo (VNG Corporation) – Ho Chi Minh City, Vietnam 9. OVO (Grab-backed e-wallet) – Jakarta, Indonesia 10. PhonePe (Flipkart/Walmart-owned) – Bengaluru, India Middle East and Africa 1. Careem (Uber-owned) – Dubai, UAE 2. MNT-Halan (Egypt) – Cairo, Egypt 3. OPRappi – Bogotá, Colombia 4. Mercado Pago (Mercado Libre) – Buenos Aires, Argentina 5. PicPay – Vitória, Brazil 6. M-Pesa (Safaricom/Vodafone) – Nairobi, Kenya South America 1. Rappi – Bogotá, Colombia 2. Mercado Pago (Mercado Libre) – Buenos Aires, Argentina 3. PicPay – Vitória, Brazil 4. Ualá – Buenos Aires, ArgentinaFrequently Asked Questions
Q1. What was the Market Size of Super Apps Market in 2024? Ans. The global super apps market size was estimated at USD 92.72 billion in 2024. Q2. What is the Rate of super apps market growth? Ans. The super apps market is projected to grow at a compound annual growth rate of 24.32% from 2025 to 2032. Q3. Which region accounts for the largest super apps market share? Ans. On a regional level, the market has been classified into North America, Asia Pacific, Europe, Latin America, and Middle East, and Africa, where Asia Pacific currently dominates the global market. Q4. Which are the leading Key Players in the global super apps market? Ans. Some of the major players in the global Super Apps market include Alipay (Alibaba Group Holding Limited), Gojek Tech (Go to), Grab, Kakao Corp.
1. Super Apps Market Introduction 1.1. Study Assumptions and Market Definition 1.2. Scope of the Study 1.3. Executive Summary 2. Global Super Apps Market: Competitive Landscape 2.1. Ecosystem Analysis 2.2. MMR Competition Matrix 2.3. Competitive Landscape 2.4. Key Players Benchmarking 2.4.1. Company Name 2.4.2. Business Segment 2.4.3. End-user Segment 2.4.4. Revenue (2024) 2.4.5. Company Locations 2.5. Market Structure 2.5.1. Market Leaders 2.5.2. Market Followers 2.5.3. Emerging Players 2.6. Mergers and Acquisitions Details 3. Super Apps Market: Dynamics 3.1. Super Apps Market Trends by Region 3.1.1. North America Super Apps Market Trends 3.1.2. Europe Super Apps Market Trends 3.1.3. Asia Pacific Super Apps Market Trends 3.1.4. Middle East and Africa Super Apps Market Trends 3.1.5. South America Super Apps Market Trends 3.2. Super Apps Market Dynamics 3.2.1. Super Apps Market Drivers 3.2.2. Super Apps Market Restraints 3.2.3. Super Apps Market Opportunities 3.2.4. Super Apps Market Challenges 3.3. PORTER’s Five Forces Analysis 3.4. PESTLE Analysis 3.5. Regulatory Landscape by Region 3.5.1. North America 3.5.2. Europe 3.5.3. Asia Pacific 3.5.4. Middle East and Africa 3.5.5. South America 3.6. Key Opinion Leader Analysis for Super Apps Market Industry 4. Super Apps Market: Global Market Size and Forecast by Segmentation (by Value in USD Bn) (2024-2032) 4.1. Super Apps Market Size and Forecast, By Service Type (2024-2032) 4.1.1. Payments & Financial Services 4.1.2. E-Commerce & Retail 4.1.3. Mobility & Logistics 4.1.4. Social & Communication 4.1.5. Utilities & Lifestyle 4.2. Super Apps Market Size and Forecast, By Business Model Type (2024-2032) 4.2.1. Transaction Fees (Payments, E-commerce) 4.2.2. Subscription Services (Premium Features) 4.2.3. Advertising (In-app promotions) 4.2.4. Commission-Based (Third-party integrations) 4.3. Super Apps Market Size and Forecast, By User Base (2024-2032) 4.3.1. Consumers (B2C) 4.3.2. Businesses (B2B) 4.4. Super Apps Market Size and Forecast, By Region (2024-2032) 4.4.1. North America 4.4.2. Europe 4.4.3. Asia Pacific 4.4.4. Middle East and Africa 4.4.5. South America 5. North America Super Apps Market Size and Forecast by Segmentation (by Value in USD Bn) (2024-2032) 5.1. North America Super Apps Market Size and Forecast, By Service Type (2024-2032) 5.1.1. Payments & Financial Services 5.1.2. E-Commerce & Retail 5.1.3. Mobility & Logistics 5.1.4. Social & Communication 5.1.5. Utilities & Lifestyle 5.2. North America Super Apps Market Size and Forecast, By Business Model Type (2024-2032) 5.2.1. Transaction Fees (Payments, E-commerce) 5.2.2. Subscription Services (Premium Features) 5.2.3. Advertising (In-app promotions) 5.2.4. Commission-Based (Third-party integrations) 5.3. North America Super Apps Market Size and Forecast, By User Base (2024-2032) 5.3.1. Consumers (B2C) 5.3.2. Businesses (B2B) 5.4. North America Super Apps Market Size and Forecast, by Country (2024-2032) 5.4.1. United States 5.4.1.1. United States Super Apps Market Size and Forecast, By Service Type (2024-2032) 5.4.1.1.1. Payments & Financial Services 5.4.1.1.2. E-Commerce & Retail 5.4.1.1.3. Mobility & Logistics 5.4.1.1.4. Social & Communication 5.4.1.1.5. Utilities & Lifestyle 5.4.1.2. United States Super Apps Market Size and Forecast, By Business Model Type (2024-2032) 5.4.1.2.1. Transaction Fees (Payments, E-commerce) 5.4.1.2.2. Subscription Services (Premium Features) 5.4.1.2.3. Advertising (In-app promotions) 5.4.1.2.4. Commission-Based (Third-party integrations) 5.4.1.3. United States Super Apps Market Size and Forecast, By User Base (2024-2032) 5.4.1.3.1. Consumers (B2C) 5.4.1.3.2. Businesses (B2B) 5.4.2. Canada 5.4.2.1. Canada Super Apps Market Size and Forecast, By Service Type (2024-2032) 5.4.2.1.1. Payments & Financial Services 5.4.2.1.2. E-Commerce & Retail 5.4.2.1.3. Mobility & Logistics 5.4.2.1.4. Social & Communication 5.4.2.1.5. Utilities & Lifestyle 5.4.2.2. Canada Super Apps Market Size and Forecast, By Business Model Type (2024-2032) 5.4.2.2.1. Transaction Fees (Payments, E-commerce) 5.4.2.2.2. Subscription Services (Premium Features) 5.4.2.2.3. Advertising (In-app promotions) 5.4.2.2.4. Commission-Based (Third-party integrations) 5.4.3. Canada Super Apps Market Size and Forecast, By User Base Industry (2024-2032) 5.4.3.1.1. Consumers (B2C) 5.4.3.1.2. Businesses (B2B) 5.4.4. Mexico 5.4.4.1. Mexico Super Apps Market Size and Forecast, By Service Type (2024-2032) 5.4.4.1.1. Payments & Financial Services 5.4.4.1.2. E-Commerce & Retail 5.4.4.1.3. Mobility & Logistics 5.4.4.1.4. Social & Communication 5.4.4.1.5. Utilities & Lifestyle 5.4.4.2. Mexico Super Apps Market Size and Forecast, By Business Model Type (2024-2032) 5.4.4.2.1. Transaction Fees (Payments, E-commerce) 5.4.4.2.2. Subscription Services (Premium Features) 5.4.4.2.3. Advertising (In-app promotions) 5.4.4.2.4. Commission-Based (Third-party integrations) 5.4.4.3. Mexico Super Apps Market Size and Forecast, By User Base (2024-2032) 5.4.4.3.1. Consumers (B2C) 5.4.4.3.2. Businesses (B2B) 6. Europe Super Apps Market Size and Forecast by Segmentation (by Value in USD Bn) (2024-2032) 6.1. Europe Super Apps Market Size and Forecast, By Service Type (2024-2032) 6.2. Europe Super Apps Market Size and Forecast, By Business Model Type (2024-2032) 6.3. Europe Super Apps Market Size and Forecast, By User Base (2024-2032) 6.4. Europe Super Apps Market Size and Forecast, by Country (2024-2032) 6.4.1. United Kingdom 6.4.1.1. United Kingdom Super Apps Market Size and Forecast, By Service Type (2024-2032) 6.4.1.2. United Kingdom Super Apps Market Size and Forecast, By Business Model Type (2024-2032) 6.4.1.3. United Kingdom Super Apps Market Size and Forecast, By User Base (2024-2032) 6.4.2. France 6.4.2.1. France Super Apps Market Size and Forecast, By Service Type (2024-2032) 6.4.2.2. France Super Apps Market Size and Forecast, By Business Model Type (2024-2032) 6.4.2.3. France Super Apps Market Size and Forecast, By User Base (2024-2032) 6.4.3. Germany 6.4.3.1. Germany Super Apps Market Size and Forecast, By Service Type (2024-2032) 6.4.3.2. Germany Super Apps Market Size and Forecast, By Business Model Type (2024-2032) 6.4.3.3. Germany Super Apps Market Size and Forecast, By User Base (2024-2032) 6.4.4. Italy 6.4.4.1. Italy Super Apps Market Size and Forecast, By Service Type (2024-2032) 6.4.4.2. Italy Super Apps Market Size and Forecast, By Business Model Type (2024-2032) 6.4.4.3. Italy Super Apps Market Size and Forecast, By User Base (2024-2032) 6.4.5. Spain 6.4.5.1. Spain Super Apps Market Size and Forecast, By Service Type (2024-2032) 6.4.5.2. Spain Super Apps Market Size and Forecast, By Business Model Type (2024-2032) 6.4.5.3. Spain Super Apps Market Size and Forecast, By User Base (2024-2032) 6.4.6. Sweden 6.4.6.1. Sweden Super Apps Market Size and Forecast, By Service Type (2024-2032) 6.4.6.2. Sweden Super Apps Market Size and Forecast, By Business Model Type (2024-2032) 6.4.6.3. Sweden Super Apps Market Size and Forecast, By User Base (2024-2032) 6.4.7. Austria 6.4.7.1. Austria Super Apps Market Size and Forecast, By Service Type (2024-2032) 6.4.7.2. Austria Super Apps Market Size and Forecast, By Business Model Type (2024-2032) 6.4.7.3. Austria Super Apps Market Size and Forecast, By User Base (2024-2032) 6.4.8. Rest of Europe 6.4.8.1. Rest of Europe Super Apps Market Size and Forecast, By Service Type (2024-2032) 6.4.8.2. Rest of Europe Super Apps Market Size and Forecast, By Business Model Type (2024-2032) 6.4.8.3. Rest of Europe Super Apps Market Size and Forecast, By User Base (2024-2032) 7. Asia Pacific Super Apps Market Size and Forecast by Segmentation (by Value in USD Bn) (2024-2032) 7.1. Asia Pacific Super Apps Market Size and Forecast, By Service Type (2024-2032) 7.2. Asia Pacific Super Apps Market Size and Forecast, By Business Model Type (2024-2032) 7.3. Asia Pacific Super Apps Market Size and Forecast, By User Base (2024-2032) 7.4. Asia Pacific Super Apps Market Size and Forecast, by Country (2024-2032) 7.4.1. China 7.4.1.1. China Super Apps Market Size and Forecast, By Service Type (2024-2032) 7.4.1.2. China Super Apps Market Size and Forecast, By Business Model Type (2024-2032) 7.4.1.3. China Super Apps Market Size and Forecast, By User Base (2024-2032) 7.4.2. S Korea 7.4.2.1. S Korea Super Apps Market Size and Forecast, By Service Type (2024-2032) 7.4.2.2. S Korea Super Apps Market Size and Forecast, By Business Model Type (2024-2032) 7.4.2.3. S Korea Super Apps Market Size and Forecast, By User Base (2024-2032) 7.4.3. Japan 7.4.3.1. Japan Super Apps Market Size and Forecast, By Service Type (2024-2032) 7.4.3.2. Japan Super Apps Market Size and Forecast, By Business Model Type (2024-2032) 7.4.3.3. Japan Super Apps Market Size and Forecast, By User Base (2024-2032) 7.4.4. India 7.4.4.1. India Super Apps Market Size and Forecast, By Service Type (2024-2032) 7.4.4.2. India Super Apps Market Size and Forecast, By Business Model Type (2024-2032) 7.4.4.3. India Super Apps Market Size and Forecast, By User Base (2024-2032) 7.4.5. Australia 7.4.5.1. Australia Super Apps Market Size and Forecast, By Service Type (2024-2032) 7.4.5.2. Australia Super Apps Market Size and Forecast, By Business Model Type (2024-2032) 7.4.5.3. Australia Super Apps Market Size and Forecast, By User Base (2024-2032) 7.4.6. Indonesia 7.4.6.1. Indonesia Super Apps Market Size and Forecast, By Service Type (2024-2032) 7.4.6.2. Indonesia Super Apps Market Size and Forecast, By Business Model Type (2024-2032) 7.4.6.3. Indonesia Super Apps Market Size and Forecast, By User Base (2024-2032) 7.4.7. Philippines 7.4.7.1. Philippines Super Apps Market Size and Forecast, By Service Type (2024-2032) 7.4.7.2. Philippines Super Apps Market Size and Forecast, By Business Model Type (2024-2032) 7.4.7.3. Philippines Super Apps Market Size and Forecast, By User Base (2024-2032) 7.4.8. Malaysia 7.4.8.1. Malaysia Super Apps Market Size and Forecast, By Service Type (2024-2032) 7.4.8.2. Malaysia Super Apps Market Size and Forecast, By Business Model Type (2024-2032) 7.4.8.3. Malaysia Super Apps Market Size and Forecast, By User Base (2024-2032) 7.4.9. Vietnam 7.4.9.1. Vietnam Super Apps Market Size and Forecast, By Service Type (2024-2032) 7.4.9.2. Vietnam Super Apps Market Size and Forecast, By Business Model Type (2024-2032) 7.4.9.3. Vietnam Super Apps Market Size and Forecast, By User Base (2024-2032) 7.4.10. Thailand 7.4.10.1. Thailand Super Apps Market Size and Forecast, By Service Type (2024-2032) 7.4.10.2. Thailand Super Apps Market Size and Forecast, By Business Model Type (2024-2032) 7.4.10.3. Thailand Super Apps Market Size and Forecast, By User Base (2024-2032) 7.4.11. Rest of Asia Pacific 7.4.11.1. Rest of Asia Pacific Super Apps Market Size and Forecast, By Service Type (2024-2032) 7.4.11.2. Rest of Asia Pacific Super Apps Market Size and Forecast, By Business Model Type (2024-2032) 7.4.11.3. Rest of Asia Pacific Super Apps Market Size and Forecast, By User Base (2024-2032) 8. Middle East and Africa Super Apps Market Size and Forecast by Segmentation (by Value in USD Bn) (2024-2032) 8.1. Middle East and Africa Super Apps Market Size and Forecast, By Service Type (2024-2032) 8.2. Middle East and Africa Super Apps Market Size and Forecast, By Business Model Type (2024-2032) 8.3. Middle East and Africa Super Apps Market Size and Forecast, By User Base (2024-2032) 8.4. Middle East and Africa Super Apps Market Size and Forecast, by Country (2024-2032) 8.4.1. South Africa 8.4.1.1. South Africa Super Apps Market Size and Forecast, By Service Type (2024-2032) 8.4.1.2. South Africa Super Apps Market Size and Forecast, By Business Model Type (2024-2032) 8.4.1.3. South Africa Super Apps Market Size and Forecast, By User Base (2024-2032) 8.4.2. GCC 8.4.2.1. GCC Super Apps Market Size and Forecast, By Service Type (2024-2032) 8.4.2.2. GCC Super Apps Market Size and Forecast, By Business Model Type (2024-2032) 8.4.2.3. GCC Super Apps Market Size and Forecast, By User Base (2024-2032) 8.4.3. Nigeria 8.4.3.1. Nigeria Super Apps Market Size and Forecast, By Service Type (2024-2032) 8.4.3.2. Nigeria Super Apps Market Size and Forecast, By Business Model Type (2024-2032) 8.4.3.3. Nigeria Super Apps Market Size and Forecast, By User Base (2024-2032) 8.4.4. Rest of ME&A 8.4.4.1. Rest of ME&A Super Apps Market Size and Forecast, By Service Type (2024-2032) 8.4.4.2. Rest of ME&A Super Apps Market Size and Forecast, By Business Model Type (2024-2032) 8.4.4.3. Rest of ME&A Super Apps Market Size and Forecast, By User Base (2024-2032) 9. South America Super Apps Market Size and Forecast by Segmentation (by Value in USD Bn) (2024-2032) 9.1. South America Super Apps Market Size and Forecast, By Service Type (2024-2032) 9.2. South America Super Apps Market Size and Forecast, By Business Model Type (2024-2032) 9.3. South America Super Apps Market Size and Forecast, By User Base (2024-2032) 9.4. South America Super Apps Market Size and Forecast, by Country (2024-2032) 9.4.1. Brazil 9.4.1.1. Brazil Super Apps Market Size and Forecast, By Service Type (2024-2032) 9.4.1.2. Brazil Super Apps Market Size and Forecast, By Business Model Type (2024-2032) 9.4.1.3. Brazil Super Apps Market Size and Forecast, By User Base (2024-2032) 9.4.2. Argentina 9.4.2.1. Argentina Super Apps Market Size and Forecast, By Service Type (2024-2032) 9.4.2.2. Argentina Super Apps Market Size and Forecast, By Business Model Type (2024-2032) 9.4.2.3. Argentina Super Apps Market Size and Forecast, By User Base (2024-2032) 9.4.3. Rest Of South America 9.4.3.1. Rest Of South America Super Apps Market Size and Forecast, By Service Type (2024-2032) 9.4.3.2. Rest Of South America Super Apps Market Size and Forecast, By Business Model Type (2024-2032) 9.4.3.3. Rest Of South America Super Apps Market Size and Forecast, By User Base (2024-2032) 10. Company Profile: Key Players 10.1. WeChat 10.1.1. Company Overview 10.1.2. Business Portfolio 10.1.3. Financial Overview 10.1.4. SWOT Analysis 10.1.5. Strategic Analysis 10.1.6. Recent Developments 10.2. Alipay 10.3. X (formerly Twitter) 10.4. PayPal & Venmo 10.5. Uber 10.6. Shopify 10.7. Meta (Facebook, WhatsApp, Instagram) 10.8. RBC (Royal Bank of Canada) 10.9. Block (Square, Cash App) 10.10. Walmart (Walmart Pay, Walmart One) 10.11. Revolut 10.12. Klarna 10.13. Glovo 10.14. Bolt 10.15. N26 10.16. Wise 10.17. Vivid Money 10.18. Lydia 10.19. PayPal 10.20. Yandex Go 10.21. WeChat 10.22. Alipay 10.23. Grab 10.24. GoTo (Gojek + Tokopedia) 10.25. PayPay (SoftBank + Yahoo Japan) 10.26. Kakao (KakaoTalk, KakaoPay, KakaoBank) 10.27. Line (Line Pay, Line Bank) 10.28. Zalo (VNG Corporation) 10.29. OVO (Grab-backed e-wallet) 10.30. PhonePe (Flipkart/Walmart-owned) 10.31. Careem (Uber-owned) 10.32. MNT-Halan (Egypt) 10.33. OPay 10.34. M-Pesa 10.35. Rappi 10.36. Mercado Pago 10.37. PicPay 11. Key Findings 12. Analyst Recommendations 13. Super Apps Market: Research Methodology