Smart Hospitality Market: Global Industry Analysis and Forecast (2024-2030)

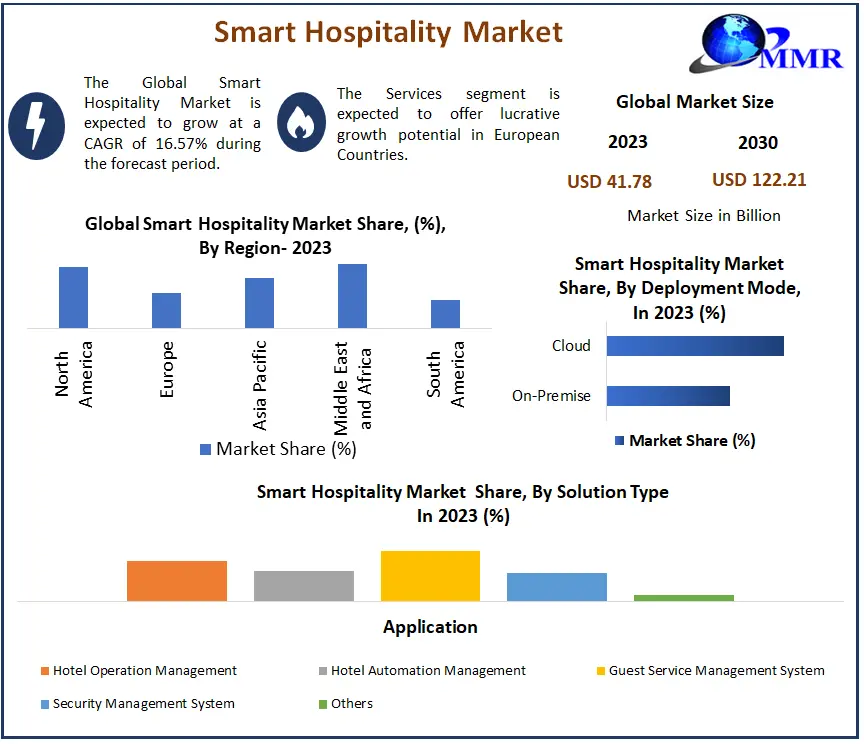
The Global Smart Hospitality Market is expected to grow from USD 41.78 billion in 2023 to USD 122.21 billion by 2030, at a CAGR of 16.57% during the forecast period. The smart hospitality market is the most rapidly evolving and transformative sector within the hospitality industry that merges advanced technologies with the aim of improving guest experience, simplifying operations, and maximizing efficiency. This pioneering method includes the use of modern technologies including Internet of Things (IoT) devices, artificial intelligence (AI), data analytics, etc. which can be used to build intelligent and connected ecosystems in hotels, resorts, and other places of accommodation. The major factors driving the growth of the smart hospitality market are rising investments in the hospitality sector, rising adoption of technology in the hospitality industry, and growing tourism industry. Smart Hospitality MarketTo know about the Research Methodology:-Request Free Sample Report For instance, Stayntouch, a key player in hotel property management systems, secured a $48 million strategic growth equity investment, thereby, streamlining hotel operations by integrating functions like reservations, payments, and multi-property management. The recent launch of Stayntouch 2.0 in October 2022 introduced an enhanced technology suite, including an end-to-end payments platform, customizable booking engine, channel manager, and comprehensive chain management capabilities. This significant investment underscores confidence in Stayntouch's innovative solutions and its dedication to advancing technology within the smart hospitality market. 
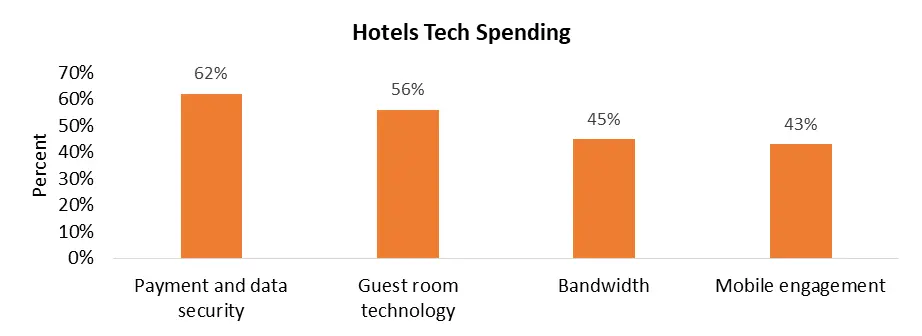
Moreover, the expected exponential increase in tech spending is directly correlated with the growth of the smart hospitality market. This surge in investment allows hotels to integrate innovative technologies like IoT, AI, and contactless systems, optimizing guest experiences and operational efficiency. The focus on smart building technologies and sustainability measures further aligns with the smart hospitality market goals. As the hospitality sector aims to cater to tech-savvy travelers and streamline operations, the substantial boost in tech spending is a catalyst for the continued growth and advancement of the smart hospitality market. The below graph shows the percentage of hotel spending on technology related to the smart hospitality market trends. Smart Hospitality Market Hospital smart solutions have a lot of advantages like personalized guest services, energy saving and management, automated check-in/out processes, and security through smart access control systems. In addition, the implementation of smart access control systems can further increase security measures in hospitality establishments. Biometric authentication, keyless entry systems, and facial recognition technologies enhance the safety and ease of access for hotel guests. These comprehensive security procedures not only safeguard both guests and their belongings but also add to the feeling of safety, a key factor for having a positive and trusting environment. Smart Hospitality Market 
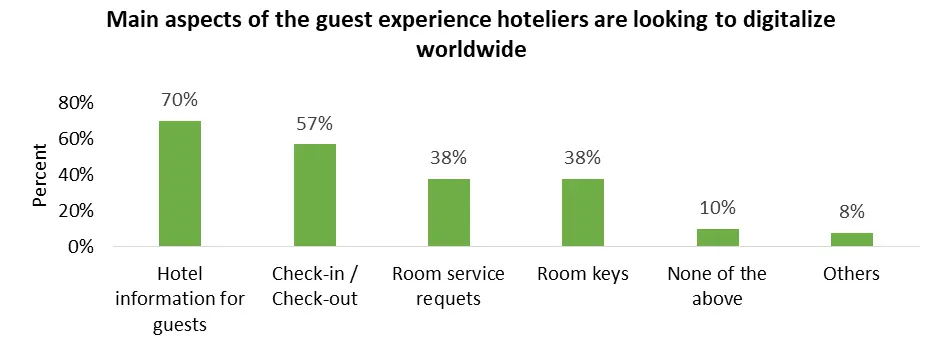
Hoteliers worldwide are actively pursuing digitalization in various aspects of the guest experience to enhance efficiency, convenience, and safety, thus driving the growth of the smart hospitality market. Key areas include digitizing hotel information for guests through mobile apps, websites, or in-room tablets, and providing details about amenities, services, and local attractions. Contactless check-in and check-out processes are a priority, leveraging mobile apps or self-service kiosks to streamline arrivals and departures. Room service requests are being digitized, allowing guests to place orders through mobile apps or in-room tablets. Keyless entry systems are gaining traction, enabling guests to access their rooms using smartphones, and eliminating the need for physical key cards. Additionally, hoteliers are exploring digital solutions for concierge services, virtual tours, and personalized marketing, enhancing the overall guest experience by embracing technology for convenience, personalization, and safety. The above graph shows major aspects of guest experiences that hoteliers are looking to digitalize the smart hospitality industry.

Smart Hospitality Market Dynamics

Growing tourism propels the smart hospitality market expansion Tourism acts as a key factor in the development of the smart hospitality industry, bringing about a mutually beneficial relationship where technological progress is used to improve the overall guest experience, while the rising smart hospitality industry, in turn, meets and satisfies the needs of the modern tourist. The interplay between tourism and smart hospitality is redefining the hospitality industry by propelling innovation and facilitating sustainable growth of the smart hospitality market. The tourism industry has witnessed unprecedented growth, driven by factors such as increased global connectivity, rising disposable incomes, and a growing desire for experiential travel. As more people embark on journeys around the world, their expectations for seamless, personalized, and tech-savvy experiences have also evolved. This shift in consumer behavior has spurred the demand for smart hospitality market solutions, which, in turn, propels the smart hospitality market's revenue. One of the key ways tourism fuels the smart hospitality market is by creating a diverse and dynamic consumer base with varied expectations. Modern travelers, whether for business or leisure, seek more than just a place to stay – they desire an immersive and tailored experience. Smart hospitality technologies, such as Internet of Things (IoT) devices, artificial intelligence (AI), and mobile applications, address these evolving expectations by offering convenience, personalization, and connectivity. For instance, IoT devices enable hotels to create intelligent environments that respond to guests' needs in real-time. Smart thermostats adjust room temperatures based on guest preferences, connected lighting systems offer customizable ambiance, and smart TVs provide personalized content recommendations. These features enhance the overall guest experience, creating a sense of comfort and control that aligns with the expectations of today's tech-savvy travelers. Artificial intelligence further elevates the guest experience by analyzing vast amounts of data to understand individual preferences and behaviors. This data-driven approach enables hotels to offer personalized services, from customized room settings to curated recommendations for dining, entertainment, and activities. As tourists increasingly seek unique and memorable experiences, AI-driven insights contribute to the creation of tailored offerings that set smart hospitality market establishments apart. The global nature of tourism also contributes to the widespread adoption of smart hospitality market solutions. As travelers move across borders, they bring with them diverse expectations and preferences. Smart hotels, with their ability to tailor services based on individual needs, are better equipped to cater to this diverse clientele. Language preferences, cultural nuances, and specific requirements can be seamlessly integrated into the guest experience through the use of technology, creating a more inclusive and welcoming environment for international tourists. The collaborative nature of the tourism ecosystem also fosters the growth of the smart hospitality market. Destination management organizations, travel agencies, and online travel platforms play a crucial role in promoting accommodations that offer innovative and tech-driven experiences. As these entities recognize the value of smart hospitality in attracting and retaining customers, they actively encourage the adoption of such technologies among their partner establishments. Thus, tourism serves as a powerful driver for the growth of the smart hospitality market. The evolving expectations of modern travelers, the competitive dynamics within the tourism industry, and the global nature of travel contribute to the increasing demand for smart hospitality market solutions. Rise in government initiatives in the smart hospitality sector drives the market growth The rise in government initiatives is a significant driving factor for the growth of the smart hospitality market. Governments are increasingly recognizing the potential of smart technologies to enhance the efficiency, safety, and sustainability of the hospitality sector. With a strategic focus on building smart cities and fostering innovation, governments are investing in digital infrastructure, creating an environment conducive to the widespread adoption of advanced technologies within the smart hospitality market. This includes initiatives to improve connectivity, promote data-driven decision-making, and encourage the implementation of Internet of Things (IoT) solutions. For instance, in 2022, the hospitality sector in India experienced a significant rebound in hotel investment volumes accounting for a total deal volume of USD 73 million, marking a substantial increase compared to the previous two pandemic years. Thus, such a rise in investment volume is expected to fuel the growth of the smart hospitality market. Further, governments play a strategic role in promoting innovation and collaboration within the hospitality sector through a variety of support mechanisms, thereby driving the smart hospitality market growth. Financial incentives, such as tax credits and grants, encourage hotels and resorts to embrace smart technologies, driving the adoption of solutions ranging from energy-efficient systems to advanced guest services. Moreover, regulatory frameworks are evolving to facilitate the seamless integration of smart solutions, providing a supportive environment for technology implementation. By actively engaging with industry stakeholders, governments ensure that policies evolve in tandem with technological advancements, fostering a regulatory landscape that encourages responsible innovation in the smart hospitality market. In addition to economic and regulatory support, governments are increasingly recognizing the importance of sustainability in the hospitality sector. Many government initiatives emphasize the implementation of eco-friendly and energy-efficient technologies. This includes incentivizing the use of renewable energy sources, promoting green building practices, and encouraging the adoption of smart systems that contribute to reduced environmental impact. For instance, the UK Government's support for the TechEmerge Sustainable Cooling Innovation Program in the Indian hospitality sector provides financial support and also offers innovators market access and a substantial pool of up to $500,000 in grant funding. The focus on reducing high energy usage and climate impacts associated with cooling systems aligns with broader global efforts to combat climate change and underscores the UK's commitment to fostering sustainable practices in the smart hospitality market growth. The alignment of government policies with sustainability goals not only reflects a commitment to environmental responsibility but also resonates with the growing eco-conscious preferences of modern travelers. Thus, the convergence of government initiatives with technological advancements creates a synergistic effect, fostering a dynamic and rapidly evolving landscape in the smart hospitality market.

Global Smart Hospitality Market Segment Analysis

Based on solution type, the guest service management system (GSMS) segment accounted for the majority share of the smart hospitality market and is expected to remain dominant during the forecast period. This is due to its ability to personalize guest experiences through mobile apps, streamline operations with automated services, and foster guest loyalty through personalized interactions and proactive service. Based on deployment mode, the cloud segment accounted for the largest share of the smart hospitality market and is expected to remain dominant during the forecast period. Cloud mode eliminates the upfront costs of hardware and software, and ongoing maintenance expenses compared to on-premise systems. Cloud-based systems are inherently scalable, allowing hotels to easily adjust their resource usage based on guest occupancy or seasonal fluctuations. This flexibility is particularly valuable for hotels with varying guest numbers, as they can avoid over-investing in on-premise infrastructure that may not be used year-round. Further, the cloud mode is accessible from anywhere with an internet connection, empowering both remote management and guest self-service. This allows hotels to offer greater flexibility to staff and guests, regardless of their location. Staff can manage operations remotely, and guests can access features and services through mobile apps, even outside the hotel. Cloud providers invest heavily in security measures and maintain robust infrastructure to safeguard data. This can potentially offer a more secure environment compared to on-premise solutions, which may require individual hotels to invest in building and maintaining their own security systems. Based on the end user, the hotel segment dominated the smart hospitality market in terms of revenue and is expected to remain dominant during the forecast period. Hotels, being a foundational component of the hospitality industry, have been at the forefront of adopting smart technologies to enhance guest experiences, optimize operational efficiency, and stay competitive in a rapidly evolving market. The diverse range of smart solutions, including smart room controls, automated check-in/check-out processes, and personalized guest services, aligns well with the diverse needs of hotels catering to various customer preferences and expectations.

Smart Hospitality Market Regional Insights

Region-wise, North America accounted for largest share of the smart hospitality market in terms of revenue and is expected to remain dominant during the forecast period. North American consumers generally exhibit a strong interest in adopting new technologies, including those that enhance their travel experiences. This translates to a higher demand for smart hospitality market solutions in the region. North American hospitality businesses often prioritize delivering exceptional guest experiences, making them more receptive to investing in smart solutions that personalize services, increase convenience, and elevate guest satisfaction. The presence of leading tech companies and a generally strong economic environment in North America often translates to higher investments in research and development (R&D) for innovative technologies. This has lead to faster adoption of cutting-edge solutions within the smart hospitality market.

Smart Hospitality Market Scope: Inquire before buying

Global Smart Hospitality Market
Report Coverage Details
Base Year: 2023 Forecast Period: 2024-2030
Historical Data: 2018 to 2023 Market Size in 2023: US $ 41.78 Bn.
Forecast Period 2024 to 2030 CAGR: 16.57% Market Size in 2030: US $ 122.21 Bn.
Segments Covered: by Component Solution Services
by Solution Type Hotel Operation Management Hotel Automation Management Guest Service Management System Security Management System Others
by Deployment Mode On-Premise Cloud
by End-User Hotels Cruises Luxury Yachts Others

Smart Hospitality Market, by Region

North America (United States, Canada and Mexico) Europe (UK, France, Germany, Italy, Spain, Sweden, Austria and Rest of Europe) Asia Pacific (China, South Korea, Japan, India, Australia, Indonesia, Malaysia, Vietnam, Taiwan, Bangladesh, Pakistan and Rest of APAC) Middle East and Africa (South Africa, GCC, Egypt, Nigeria and Rest of ME&A) South America (Brazil, Argentina Rest of South America) Smart Hospitality Market Key Players Global 1. IBM Corporation (United States) 2. Schneider Electric (France) 3. Siemens AG (Germany) 4. Honeywell International (United States) 5. Cisco Systems, Inc. (United States) 6. Oracle Corporation (United States) 7. Huawei Technologies (China) 8. NEC Corporation (Japan) 9. SAMSUNG (South Korea) 10. Qualsoft Systems Pvt. Ltd. (India) 11. Control4Corporation (United States) 12. Cloudbeds (United States) North America 1. BuildingIQ (United States) 2. Johnson Controls (United States) 3. Infor, Inc. (United States) 4. WiSuite (United States) 5. Frontdesk (United States) Europe 1.Winhotel Solutions (Spain) 2. BLAZON HOTELS (Dubai) 3.Guestline (United Kingdom) Frequently Asked Questions 1. Which region has the largest share in the Global Smart Hospitality Market? Ans: North America accounted for the largest share in terms of revenue in the Smart Hospitality Market in 2023. 2. What is the growth rate of the Global Smart Hospitality Market? Ans: The Global Smart Hospitality Market is growing at a CAGR of 16.57% during the forecasting period 2024-2029. 3. What is the scope of the Global Smart Hospitality Market report? Ans: The Global Smart Hospitality Market report helps with the PESTEL, PORTER, COVID-19 Impact analysis, Recommendations for Investors & Leaders, and market estimation for the forecast period. 4. Who are the key players in the Global Smart Hospitality Market? Ans: The important key players in the Global Smart Hospitality Market are Schneider Electric, Siemens AG, IBM Corporation, BuildingIQ, Honeywell International, Winhotel Solutions, Cisco Systems, Inc., Oracle Corporation, Huawei Technologies, Johnson Controls, NEC Corporation, Infor, Inc., Winhotel Solution SL, BuildingIQ, WiSuite, Qualsoft Systems Pvt. Ltd., SAMSUNG, BLAZON HOTELS, Control4Corporation, Guestline, Cloudbeds, Frontdesk 5. What is the study period of the Smart Hospitality Market? Ans: The Global Smart Hospitality Market is studied from 2023 to 2030.
1. Smart Hospitality Market Introduction 1.1. Study Assumption and Market Definition 1.2. Scope of the Study 1.3. Executive Summary 2. Smart Hospitality Market: Dynamics 2.1. Smart Hospitality Market Trends by Region 2.1.1. North America Smart Hospitality Market Trends 2.1.2. Europe Smart Hospitality Market Trends 2.1.3. Asia Pacific Smart Hospitality Market Trends 2.1.4. Middle East and Africa Smart Hospitality Market Trends 2.1.5. South America Smart Hospitality Market Trends 2.2. Smart Hospitality Market Dynamics by Region 2.2.1. North America 2.2.1.1. North America Smart Hospitality Market Drivers 2.2.1.2. North America Smart Hospitality Market Restraints 2.2.1.3. North America Smart Hospitality Market Opportunities 2.2.1.4. North America Smart Hospitality Market Challenges 2.2.2. Europe 2.2.2.1. Europe Smart Hospitality Market Drivers 2.2.2.2. Europe Smart Hospitality Market Restraints 2.2.2.3. Europe Smart Hospitality Market Opportunities 2.2.2.4. Europe Smart Hospitality Market Challenges 2.2.3. Asia Pacific 2.2.3.1. Asia Pacific Smart Hospitality Market Drivers 2.2.3.2. Asia Pacific Smart Hospitality Market Restraints 2.2.3.3. Asia Pacific Smart Hospitality Market Opportunities 2.2.3.4. Asia Pacific Smart Hospitality Market Challenges 2.2.4. Middle East and Africa 2.2.4.1. Middle East and Africa Smart Hospitality Market Drivers 2.2.4.2. Middle East and Africa Smart Hospitality Market Restraints 2.2.4.3. Middle East and Africa Smart Hospitality Market Opportunities 2.2.4.4. Middle East and Africa Smart Hospitality Market Challenges 2.2.5. South America 2.2.5.1. South America Smart Hospitality Market Drivers 2.2.5.2. South America Smart Hospitality Market Restraints 2.2.5.3. South America Smart Hospitality Market Opportunities 2.2.5.4. South America Smart Hospitality Market Challenges 2.3. PORTER’s Five Forces Analysis 2.4. PESTLE Analysis 2.5. Technology Roadmap 2.6. Regulatory Landscape by Region 2.6.1. North America 2.6.2. Europe 2.6.3. Asia Pacific 2.6.4. Middle East and Africa 2.6.5. South America 2.7. Key Opinion Leader Analysis For Smart Hospitality Industry 2.8. Analysis of Government Schemes and Initiatives For Smart Hospitality Industry 2.9. Smart Hospitality Market Trade Analysis 2.10. The Global Pandemic Impact on Smart Hospitality Market 3. Smart Hospitality Market: Global Market Size and Forecast by Segmentation by Demand and Supply Side (by Value in USD Million) 2023-2030 3.1. Smart Hospitality Market Size and Forecast, by Component (2023-2030) 3.1.1. Solution 3.1.2. Services 3.2. Smart Hospitality Market Size and Forecast, by Solution Type (2023-2030) 3.2.1. Hotel Operation Management 3.2.2. Hotel Automation Management 3.2.3. Guest Service Management System 3.2.4. Security Management System 3.2.5. Others 3.3. Smart Hospitality Market Size and Forecast, by Deployment Mode (2023-2030) 3.3.1. On-Premise 3.3.2. Cloud 3.4. Smart Hospitality Market Size and Forecast, by End Users (2023-2030) 3.4.1. Hotels 3.4.2. Cruises 3.4.3. Luxury Yachts 3.4.4. Others 3.5. Smart Hospitality Market Size and Forecast, by Region (2023-2030) 3.5.1. North America 3.5.2. Europe 3.5.3. Asia Pacific 3.5.4. Middle East and Africa 3.5.5. South America 4. North America Smart Hospitality Market Size and Forecast by Segmentation (by Value in USD Million) 2023-2030 4.1. North America Smart Hospitality Market Size and Forecast, by Component (2023-2030) 4.1.1. Solution 4.1.2. Services 4.2. North America Smart Hospitality Market Size and Forecast, by Solution Type (2023-2030) 4.2.1. Hotel Operation Management 4.2.2. Hotel Automation Management 4.2.3. Guest Service Management System 4.2.4. Security Management System 4.2.5. Others 4.3. North America Smart Hospitality Market Size and Forecast, by Deployment Mode (2023-2030) 4.3.1. On-Premise 4.3.2. Cloud 4.4. North America Smart Hospitality Market Size and Forecast, by End Users (2023-2030) 4.4.1. Hotels 4.4.2. Cruises 4.4.3. Luxury Yachts 4.4.4. Others 4.5. North America Smart Hospitality Market Size and Forecast, by Country (2023-2030) 4.5.1. United States 4.5.1.1. United States Smart Hospitality Market Size and Forecast, by Component (2023-2030) 4.5.1.1.1. Solution 4.5.1.1.2. Services 4.5.1.2. United States Smart Hospitality Market Size and Forecast, by Solution Type (2023-2030) 4.5.1.2.1. Hotel Operation Management 4.5.1.2.2. Hotel Automation Management 4.5.1.2.3. Guest Service Management System 4.5.1.2.4. Security Management System 4.5.1.2.5. Others 4.5.1.3. United States Smart Hospitality Market Size and Forecast, by Deployment Mode (2023-2030) 4.5.1.3.1. On-Premise 4.5.1.3.2. Cloud 4.5.1.4. United States Smart Hospitality Market Size and Forecast, by End Users (2023-2030) 4.5.1.4.1. Hotels 4.5.1.4.2. Cruises 4.5.1.4.3. Luxury Yachts 4.5.1.4.4. Others 4.5.2. Canada 4.5.2.1. Canada Smart Hospitality Market Size and Forecast, by Component (2023-2030) 4.5.2.1.1. Solution 4.5.2.1.2. Services 4.5.2.2. Canada Smart Hospitality Market Size and Forecast, by Solution Type (2023-2030) 4.5.2.2.1. Hotel Operation Management 4.5.2.2.2. Hotel Automation Management 4.5.2.2.3. Guest Service Management System 4.5.2.2.4. Security Management System 4.5.2.2.5. Others 4.5.2.3. Canada Smart Hospitality Market Size and Forecast, by Deployment Mode (2023-2030) 4.5.2.3.1. On-Premise 4.5.2.3.2. Cloud 4.5.2.4. Canada Smart Hospitality Market Size and Forecast, by End Users (2023-2030) 4.5.2.4.1. Hotels 4.5.2.4.2. Cruises 4.5.2.4.3. Luxury Yachts 4.5.2.4.4. Others 4.5.3. Mexico 4.5.3.1. Mexico Smart Hospitality Market Size and Forecast, by Component (2023-2030) 4.5.3.1.1. Solution 4.5.3.1.2. Services 4.5.3.2. Mexico Smart Hospitality Market Size and Forecast, by Solution Type (2023-2030) 4.5.3.2.1. Hotel Operation Management 4.5.3.2.2. Hotel Automation Management 4.5.3.2.3. Guest Service Management System 4.5.3.2.4. Security Management System 4.5.3.2.5. Others 4.5.3.3. Mexico Smart Hospitality Market Size and Forecast, by Deployment Mode (2023-2030) 4.5.3.3.1. On-Premise 4.5.3.3.2. Cloud 4.5.3.4. Mexico Smart Hospitality Market Size and Forecast, by End Users (2023-2030) 4.5.3.4.1. Hotels 4.5.3.4.2. Cruises 4.5.3.4.3. Luxury Yachts 4.5.3.4.4. Others 5. Europe Smart Hospitality Market Size and Forecast by Segmentation (by Value in USD Million) 2023-2030 5.1. Europe Smart Hospitality Market Size and Forecast, by Component (2023-2030) 5.2. Europe Smart Hospitality Market Size and Forecast, by Solution Type (2023-2030) 5.3. Europe Smart Hospitality Market Size and Forecast, by Deployment Mode (2023-2030) 5.4. Europe Smart Hospitality Market Size and Forecast, by End Users (2023-2030) 5.5. Europe Smart Hospitality Market Size and Forecast, by Country (2023-2030) 5.5.1. United Kingdom 5.5.1.1. United Kingdom Smart Hospitality Market Size and Forecast, by Component (2023-2030) 5.5.1.2. United Kingdom Smart Hospitality Market Size and Forecast, by Solution Type (2023-2030) 5.5.1.3. United Kingdom Smart Hospitality Market Size and Forecast, by Deployment Mode (2023-2030) 5.5.1.4. United Kingdom Smart Hospitality Market Size and Forecast, by End Users (2023-2030) 5.5.2. France 5.5.2.1. France Smart Hospitality Market Size and Forecast, by Component (2023-2030) 5.5.2.2. France Smart Hospitality Market Size and Forecast, by Solution Type (2023-2030) 5.5.2.3. France Smart Hospitality Market Size and Forecast, by Deployment Mode (2023-2030) 5.5.2.4. France Smart Hospitality Market Size and Forecast, by End Users (2023-2030) 5.5.3. Germany 5.5.3.1. Germany Smart Hospitality Market Size and Forecast, by Component (2023-2030) 5.5.3.2. Germany Smart Hospitality Market Size and Forecast, by Solution Type (2023-2030) 5.5.3.3. Germany Smart Hospitality Market Size and Forecast, by Deployment Mode (2023-2030) 5.5.3.4. Germany Smart Hospitality Market Size and Forecast, by End Users (2023-2030) 5.5.4. Italy 5.5.4.1. Italy Smart Hospitality Market Size and Forecast, by Component (2023-2030) 5.5.4.2. Italy Smart Hospitality Market Size and Forecast, by Solution Type (2023-2030) 5.5.4.3. Italy Smart Hospitality Market Size and Forecast, by Deployment Mode (2023-2030) 5.5.4.4. Italy Smart Hospitality Market Size and Forecast, by End Users (2023-2030) 5.5.5. Spain 5.5.5.1. Spain Smart Hospitality Market Size and Forecast, by Component (2023-2030) 5.5.5.2. Spain Smart Hospitality Market Size and Forecast, by Solution Type (2023-2030) 5.5.5.3. Spain Smart Hospitality Market Size and Forecast, by Deployment Mode (2023-2030) 5.5.5.4. Spain Smart Hospitality Market Size and Forecast, by End Users (2023-2030) 5.5.6. Sweden 5.5.6.1. Sweden Smart Hospitality Market Size and Forecast, by Component (2023-2030) 5.5.6.2. Sweden Smart Hospitality Market Size and Forecast, by Solution Type (2023-2030) 5.5.6.3. Sweden Smart Hospitality Market Size and Forecast, by Deployment Mode (2023-2030) 5.5.6.4. Sweden Smart Hospitality Market Size and Forecast, by End Users (2023-2030) 5.5.7. Austria 5.5.7.1. Austria Smart Hospitality Market Size and Forecast, by Component (2023-2030) 5.5.7.2. Austria Smart Hospitality Market Size and Forecast, by Solution Type (2023-2030) 5.5.7.3. Austria Smart Hospitality Market Size and Forecast, by Deployment Mode (2023-2030) 5.5.7.4. Austria Smart Hospitality Market Size and Forecast, by End Users (2023-2030) 5.5.8. Rest of Europe 5.5.8.1. Rest of Europe Smart Hospitality Market Size and Forecast, by Component (2023-2030) 5.5.8.2. Rest of Europe Smart Hospitality Market Size and Forecast, by Solution Type (2023-2030) 5.5.8.3. Rest of Europe Smart Hospitality Market Size and Forecast, by Deployment Mode (2023-2030) 5.5.8.4. Rest of Europe Smart Hospitality Market Size and Forecast, by End Users (2023-2030) 6. Asia Pacific Smart Hospitality Market Size and Forecast by Segmentation (by Value in USD Million) 2023-2030 6.1. Asia Pacific Smart Hospitality Market Size and Forecast, by Component (2023-2030) 6.2. Asia Pacific Smart Hospitality Market Size and Forecast, by Solution Type (2023-2030) 6.3. Asia Pacific Smart Hospitality Market Size and Forecast, by Deployment Mode (2023-2030) 6.4. Asia Pacific Smart Hospitality Market Size and Forecast, by End Users (2023-2030) 6.5. Asia Pacific Smart Hospitality Market Size and Forecast, by Country (2023-2030) 6.5.1. China 6.5.1.1. China Smart Hospitality Market Size and Forecast, by Component (2023-2030) 6.5.1.2. China Smart Hospitality Market Size and Forecast, by Solution Type (2023-2030) 6.5.1.3. China Smart Hospitality Market Size and Forecast, by Deployment Mode (2023-2030) 6.5.1.4. China Smart Hospitality Market Size and Forecast, by End Users (2023-2030) 6.5.2. S Korea 6.5.2.1. S Korea Smart Hospitality Market Size and Forecast, by Component (2023-2030) 6.5.2.2. S Korea Smart Hospitality Market Size and Forecast, by Solution Type (2023-2030) 6.5.2.3. S Korea Smart Hospitality Market Size and Forecast, by Deployment Mode (2023-2030) 6.5.2.4. S Korea Smart Hospitality Market Size and Forecast, by End Users (2023-2030) 6.5.3. Japan 6.5.3.1. Japan Smart Hospitality Market Size and Forecast, by Component (2023-2030) 6.5.3.2. Japan Smart Hospitality Market Size and Forecast, by Solution Type (2023-2030) 6.5.3.3. Japan Smart Hospitality Market Size and Forecast, by Deployment Mode (2023-2030) 6.5.3.4. Japan Smart Hospitality Market Size and Forecast, by End Users (2023-2030) 6.5.4. India 6.5.4.1. India Smart Hospitality Market Size and Forecast, by Component (2023-2030) 6.5.4.2. India Smart Hospitality Market Size and Forecast, by Solution Type (2023-2030) 6.5.4.3. India Smart Hospitality Market Size and Forecast, by Deployment Mode (2023-2030) 6.5.4.4. India Smart Hospitality Market Size and Forecast, by End Users (2023-2030) 6.5.5. Australia 6.5.5.1. Australia Smart Hospitality Market Size and Forecast, by Component (2023-2030) 6.5.5.2. Australia Smart Hospitality Market Size and Forecast, by Solution Type (2023-2030) 6.5.5.3. Australia Smart Hospitality Market Size and Forecast, by Deployment Mode (2023-2030) 6.5.5.4. Australia Smart Hospitality Market Size and Forecast, by End Users (2023-2030) 6.5.6. Indonesia 6.5.6.1. Indonesia Smart Hospitality Market Size and Forecast, by Component (2023-2030) 6.5.6.2. Indonesia Smart Hospitality Market Size and Forecast, by Solution Type (2023-2030) 6.5.6.3. Indonesia Smart Hospitality Market Size and Forecast, by Deployment Mode (2023-2030) 6.5.6.4. Indonesia Smart Hospitality Market Size and Forecast, by End Users (2023-2030) 6.5.7. Malaysia 6.5.7.1. Malaysia Smart Hospitality Market Size and Forecast, by Component (2023-2030) 6.5.7.2. Malaysia Smart Hospitality Market Size and Forecast, by Solution Type (2023-2030) 6.5.7.3. Malaysia Smart Hospitality Market Size and Forecast, by Deployment Mode (2023-2030) 6.5.7.4. Malaysia Smart Hospitality Market Size and Forecast, by End Users (2023-2030) 6.5.8. Vietnam 6.5.8.1. Vietnam Smart Hospitality Market Size and Forecast, by Component (2023-2030) 6.5.8.2. Vietnam Smart Hospitality Market Size and Forecast, by Solution Type (2023-2030) 6.5.8.3. Vietnam Smart Hospitality Market Size and Forecast, by Deployment Mode (2023-2030) 6.5.8.4. Vietnam Smart Hospitality Market Size and Forecast, by End Users (2023-2030) 6.5.9. Taiwan 6.5.9.1. Taiwan Smart Hospitality Market Size and Forecast, by Component (2023-2030) 6.5.9.2. Taiwan Smart Hospitality Market Size and Forecast, by Solution Type (2023-2030) 6.5.9.3. Taiwan Smart Hospitality Market Size and Forecast, by Deployment Mode (2023-2030) 6.5.9.4. Taiwan Smart Hospitality Market Size and Forecast, by End Users (2023-2030) 6.5.10. Rest of Asia Pacific 6.5.10.1. Rest of Asia Pacific Smart Hospitality Market Size and Forecast, by Component (2023-2030) 6.5.10.2. Rest of Asia Pacific Smart Hospitality Market Size and Forecast, by Solution Type (2023-2030) 6.5.10.3. Rest of Asia Pacific Smart Hospitality Market Size and Forecast, by Deployment Mode (2023-2030) 6.5.10.4. Rest of Asia Pacific Smart Hospitality Market Size and Forecast, by End Users (2023-2030) 7. Middle East and Africa Smart Hospitality Market Size and Forecast by Segmentation (by Value in USD Million) 2023-2030 7.1. Middle East and Africa Smart Hospitality Market Size and Forecast, by Component (2023-2030) 7.2. Middle East and Africa Smart Hospitality Market Size and Forecast, by Solution Type (2023-2030) 7.3. Middle East and Africa Smart Hospitality Market Size and Forecast, by Deployment Mode (2023-2030) 7.4. Middle East and Africa Smart Hospitality Market Size and Forecast, by End Users (2023-2030) 7.5. Middle East and Africa Smart Hospitality Market Size and Forecast, by Country (2023-2030) 7.5.1. South Africa 7.5.1.1. South Africa Smart Hospitality Market Size and Forecast, by Component (2023-2030) 7.5.1.2. South Africa Smart Hospitality Market Size and Forecast, by Solution Type (2023-2030) 7.5.1.3. South Africa Smart Hospitality Market Size and Forecast, by Deployment Mode (2023-2030) 7.5.1.4. South Africa Smart Hospitality Market Size and Forecast, by End Users (2023-2030) 7.5.2. GCC 7.5.2.1. GCC Smart Hospitality Market Size and Forecast, by Component (2023-2030) 7.5.2.2. GCC Smart Hospitality Market Size and Forecast, by Solution Type (2023-2030) 7.5.2.3. GCC Smart Hospitality Market Size and Forecast, by Deployment Mode (2023-2030) 7.5.2.4. GCC Smart Hospitality Market Size and Forecast, by End Users (2023-2030) 7.5.3. Nigeria 7.5.3.1. Nigeria Smart Hospitality Market Size and Forecast, by Component (2023-2030) 7.5.3.2. Nigeria Smart Hospitality Market Size and Forecast, by Solution Type (2023-2030) 7.5.3.3. Nigeria Smart Hospitality Market Size and Forecast, by Deployment Mode (2023-2030) 7.5.3.4. Nigeria Smart Hospitality Market Size and Forecast, by End Users (2023-2030) 7.5.4. Rest of ME&A 7.5.4.1. Rest of ME&A Smart Hospitality Market Size and Forecast, by Component (2023-2030) 7.5.4.2. Rest of ME&A Smart Hospitality Market Size and Forecast, by Solution Type (2023-2030) 7.5.4.3. Rest of ME&A Smart Hospitality Market Size and Forecast, by Deployment Mode (2023-2030) 7.5.4.4. Rest of ME&A Smart Hospitality Market Size and Forecast, by End Users (2023-2030) 8. South America Smart Hospitality Market Size and Forecast by Segmentation (by Value in USD Million) 2023-2030 8.1. South America Smart Hospitality Market Size and Forecast, by Component (2023-2030) 8.2. South America Smart Hospitality Market Size and Forecast, by Solution Type (2023-2030) 8.3. South America Smart Hospitality Market Size and Forecast, by Deployment Mode(2023-2030) 8.4. South America Smart Hospitality Market Size and Forecast, by End Users (2023-2030) 8.5. South America Smart Hospitality Market Size and Forecast, by Country (2023-2030) 8.5.1. Brazil 8.5.1.1. Brazil Smart Hospitality Market Size and Forecast, by Component (2023-2030) 8.5.1.2. Brazil Smart Hospitality Market Size and Forecast, by Solution Type (2023-2030) 8.5.1.3. Brazil Smart Hospitality Market Size and Forecast, by Deployment Mode (2023-2030) 8.5.1.4. Brazil Smart Hospitality Market Size and Forecast, by End Users (2023-2030) 8.5.2. Argentina 8.5.2.1. Argentina Smart Hospitality Market Size and Forecast, by Component (2023-2030) 8.5.2.2. Argentina Smart Hospitality Market Size and Forecast, by Solution Type (2023-2030) 8.5.2.3. Argentina Smart Hospitality Market Size and Forecast, by Deployment Mode (2023-2030) 8.5.2.4. Argentina Smart Hospitality Market Size and Forecast, by End Users (2023-2030) 8.5.3. Rest Of South America 8.5.3.1. Rest Of South America Smart Hospitality Market Size and Forecast, by Component (2023-2030) 8.5.3.2. Rest Of South America Smart Hospitality Market Size and Forecast, by Solution Type (2023-2030) 8.5.3.3. Rest Of South America Smart Hospitality Market Size and Forecast, by Deployment Mode (2023-2030) 8.5.3.4. Rest Of South America Smart Hospitality Market Size and Forecast, by End Users (2023-2030) 9. Global Smart Hospitality Market: Competitive Landscape 9.1. MMR Competition Matrix 9.2. Competitive Landscape 9.3. Key Players Benchmarking 9.3.1. Company Name 9.3.2. Business Segment 9.3.3. End-user Segment 9.3.4. Revenue (2022) 9.3.5. Company Locations 9.4. Leading Smart Hospitality Market Companies, by market capitalization 9.5. Market Structure 9.5.1. Market Leaders 9.5.2. Market Followers 9.5.3. Emerging Players 9.6. Mergers and Acquisitions Details 10. Company Profile: Key Players 10.1. IBM Corporation (United States) 10.1.1. Company Overview 10.1.2. Business Portfolio 10.1.3. Financial Overview 10.1.4. SWOT Analysis 10.1.5. Strategic Analysis 10.1.6. Scale of Operation (small, medium, and large) 10.1.7. Details on Partnership 10.1.8. Regulatory Accreditations and Certifications Received by Them 10.1.9. Awards Received by the Firm 10.1.10. Recent Developments 10.2. Schneider Electric (France) 10.3. Siemens AG (Germany) 10.4. Honeywell International (United States) 10.5. Cisco Systems, Inc. (United States) 10.6. Oracle Corporation (United States) 10.7. Huawei Technologies (China) 10.8. NEC Corporation (Japan) 10.9. SAMSUNG (South Korea) 10.10. Qualsoft Systems Pvt. Ltd. (India) 10.11. Control4Corporation (United States) 10.12. Cloudbeds (United States) 10.13. BuildingIQ (United States) 10.14. Johnson Controls (United States) 10.15. Infor, Inc. (United States) 10.16. WiSuite (United States) 10.17. Frontdesk (United States) 10.18. Winhotel Solutions (Spain) 10.19. BLAZON HOTELS (Dubai) 10.20. Guestline (United Kingdom) 11. Key Findings 12. Industry Recommendations 13. Smart Hospitality Market: Research Methodology 14. Terms and Glossary
  • INQUIRE BEFORE BUYING