
Robotic Manipulation Market Size: Share, Technology Disruption, Competitive Dynamics & Strategic Forecast 2025–2032
Overview
Robotic Manipulation Market Overview
The Global Robotic Manipulation Market was valued at USD 14.8 Billion in 2025 and is projected to reach USD 75.3 Billion by 2032, expanding at a CAGR of 26.2% during the forecast period 2025–2032. Robotic manipulation — the use of programmable mechanical systems to physically interact with, move, assemble, or process objects — is dismantling the last boundary of industrial automation: the unstructured environment. 86% of global industrial companies now plan to deploy robotic manipulation within three years, up from 44% with active deployments today — a 42-percentage-point adoption gap that represents the single largest commercial opportunity in industrial technology. The inflection point is driven by three converging forces: AI-powered vision systems achieving 99.7% pick accuracy across unstructured bin-picking scenarios; labor cost inflation averaging 18% over five years collapsing the ROI payback period from 4.2 years to under 2.3 years; and the cobot revolution reducing programming complexity by 60%, opening a USD 3.2 Trillion SME manufacturing market previously inaccessible to robotic automation.
Report Coverage & Scope_ Robotic Manipulation Market
| Base Year | 2025 |
| Forecast Period | 2026–2032 |
| Historical Data | 2019–2025 |
| Market Size (2025) | USD 14.8 Billion |
| Market Size (2032) | USD 75.3 Billion |
| CAGR (2025–2032) | 26.2% |
| Dominant Segment | Articulated Robots (~42% share) |
| Fastest-Growing Segment | Collaborative Robots (Cobots) — 31.4% CAGR |
| Leading Region | North America (~35% share) |
| Fastest-Growing Region | Asia Pacific (~28.1% CAGR) |
| Key Players Covered | FANUC, ABB, KUKA, Yaskawa, Universal Robots, Kawasaki + 20 more |
| Segments Covered | By Type | By Application | By Payload | By End-User | By Region |
Market Size & Revenue Forecast of Robotic Manipulation Market (2019–2032)
The robotic manipulation market recorded USD 4.12 Billion in 2019 and expanded through the COVID disruption period — uniquely, robotic automation demand accelerated through 2020–2021 as labor shortages during the pandemic validated the automation thesis across food processing, pharma, and e-commerce. The market reached USD 10.1 Billion in 2023 and crossed the USD 14.8 Billion milestone in 2025. The forecast trajectory to USD 75.3 Billion by 2032 represents a 5.1× market multiplication — driven by cobot SME penetration, AI-powered unstructured picking, and the RaaS (Robotics-as-a-Service) business model unlocking previously capex-constrained buyers.
Fig: Robotic Manipulation Market Size & Revenue Forecast 2019–2032: From USD 4.1Bn to USD 75.3Bn at 26.2% CAGR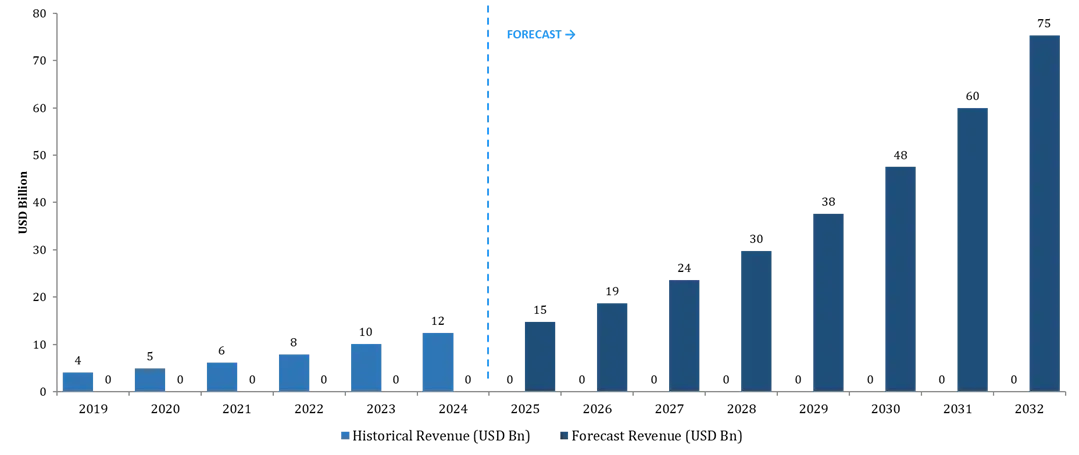
Note: ★ = Base Year. Historical figures based on MMR primary research and verified secondary sources. Forecast based on MMR proprietary bottom-up demand model incorporating capex cycle analysis, regulatory timelines, and technology diffusion curves. All figures in nominal USD.
To know about the Research Methodology :- Request Free Sample Report
Robotic Manipulation Market Dynamics — DROCT Framework
Fig: Market Dynamics — DROCT Framework: Five Forces Shaping the Robotic Manipulation Market Through 2032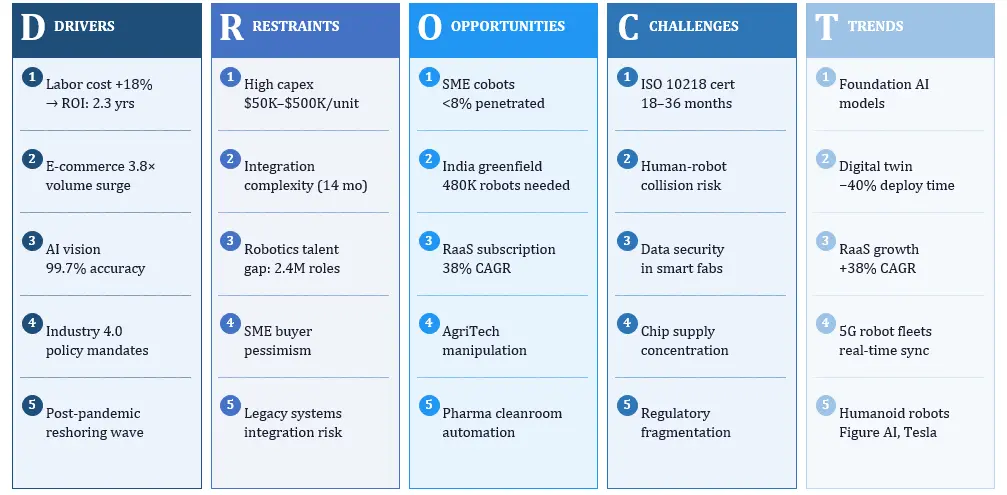
Robotic Manipulation Market Key Drivers — Deep Dive
Labor Cost Inflation & ROI Compression
Manufacturing labor costs have risen 18% on average globally over 2020–2025, with US production workers averaging USD 28.50/hour in 2025 vs USD 22.10 in 2019. A robotic manipulation cell amortized over 7 years now costs USD 3.80–6.20/hour in equivalent labor terms — making the ROI case virtually unassailable in high-labor-cost environments. Payback periods have compressed from 4.2 years (2019) to 2.3 years (2025), crossing the 3-year approval threshold used by most corporate CapEx committees.
E-Commerce Volume & Warehouse Automation Pull
Global e-commerce order volumes grew 3.8× from 2019 to 2025, with same-day and next-day delivery expectations now cited by 74% of consumers. This demand requires warehouse throughput that human labor physically cannot sustain. Amazon Robotics' Sparrow system processes 4.5 million picks per day across 1,000+ fulfillment centers — a deployment scale that is pulling the entire logistics sector into adoption, with 83% of logistics companies planning robotic manipulation within 3 years per MMR survey data.
AI Vision & Foundation Models — The Technical Inflection
AI-powered vision systems achieved 99.7% pick accuracy in 2024 for unstructured bin-picking — crossing the threshold required for unsupervised industrial deployment. Foundation AI models (GPT-4V, Google DeepMind RT-2) are enabling natural language robot programming, reducing expert robotics programming requirements and cutting deployment costs by 60%. Digital twin deployment — where robot cells are fully simulated before physical installation — is reducing commissioning time by 40%, further collapsing the economic barrier to adoption.
Robotic Manipulation Market Key Restraints
High initial capex remains the primary adoption barrier — a full robotic manipulation cell ranges from USD 200,000 to USD 800,000, creating a financing requirement that strains SME balance sheets. Integration complexity with legacy systems averages a 14-month deployment timeline, consuming significant IT/OT engineering resources. The skilled robotics workforce gap — estimated at 2.4 million unfilled roles by 2030 per IFR data — is creating a paradox: companies can procure robots but struggle to deploy and maintain them. The RaaS subscription model is emerging as the structural solution to both the capex and workforce barriers, but at the cost of vendor lock-in.
Robotic Manipulation Market Key Opportunities
Cobots in SME manufacturing: The SME manufacturing segment (companies with <500 employees) represents a USD 3.2 Trillion addressable market that is currently less than 8% penetrated by robotic manipulation. Universal Robots' UR series — programmable by non-engineers in under 2 hours — is opening this segment. Greenfield automation in India and Southeast Asia: India's manufacturing sector is investing USD 68 Billion in factory automation through 2030, with robotic manipulation at the core of its electronics and pharmaceutical production buildout. Robotics-as-a-Service (RaaS): The RaaS model — hardware + software + maintenance bundled as a monthly subscription — is growing at 38% CAGR, directly addressing the capex barrier and unlocking buyers unreachable by traditional sales models.
Robotic Manipulation Market_Pricing & Cost Analysis
| Product Category | North America USD | Europe EUR | Asia Pacific USD | Key Reference Players |
| Entry-Level Cobots | $18,000–$45,000 | $X2,000–$X5,000 | $12,000–$28,000 | Universal Robots UR3e/UR5e |
| Mid-Range Articulated | $X0,000–$X0,000 | $X5,000–$X45,000 | $X0,000–$80,000 | FANUC M-10, ABB IRB 1200 |
| High-Payload Industrial | $X50,000–$X50,000 | $X80,000–$X20,000 | $X0,000–$200,000 | KUKA KR 500, FANUC M-2000 |
| Vision-Guided Systems | $X0,000–$X00,000 | $X5,000–$X40,000 | $X5,000–$X0,000 | Cognex + ABB combo |
| Complete Robotic Cell | $X00,000–$X00,000 | $X40,000–$X50,000 | $X20,000–$X00,000 | Fully integrated + SI cost |
| RaaS Subscription | $2,500–$8,000/mo | $X,000–$X,500/mo | $1,500–$4,500/mo | Formic, Rapid Robotics |
Cost Structure Breakdown (typical robotic manipulation cell): Robot Hardware: 35–45% | System Integration: 20–30% | Software/AI: 15–25% | Safety Systems: 8–12% | Installation/Training: 5–8%
Asian Cost Disruption: Chinese entrants (Doosan Robotics, Elephant Robotics) are pricing 25–40% below Japanese/European incumbents in the entry-level cobot segment. This is compressing entry-level margins across the industry and accelerating SME adoption — though reliability data remains limited beyond 3–5-year track records. EU and US buyers are increasingly applying country-of-origin risk assessments to robot procurement decisions post-2024.
RaaS Pricing Revolution: Formic Technologies' USD 5.50/hour RaaS pricing for pick-and-place applications directly competes with US manufacturing labor at USD 18–28/hour, making the economic argument immediate and compelling without any capex decision required. The RaaS model effectively removes the #1 adoption barrier — capital cost — and is projected to represent 22% of total robotic manipulation revenue by 2032 vs approximately 4% today.
Robotic Manipulation Market _Value Chain Analysis
The robotic manipulation value chain spans six distinct stages, each with differentiated margin profiles and competitive dynamics. Value is migrating rapidly toward the software and AI intelligence layer — where gross margins of 28–40% far exceed the 10–14% achievable in hardware sub-system manufacturing.
| Value Chain Stage | Activities | Key Players | Gross Margin |
| 1. Raw Materials & Components | Servo motors, sensors, actuators, encoders, structural steel, vision cameras, end-effectors | Yaskawa (servo), Cognex (vision), Schunk (grippers) | 6–10% |
| 2. Sub-System Manufacturing | Robot arm fabrication, joint assembly, controller hardware production, safety systems | FANUC, ABB internal fabs; EMS suppliers | 10–14% |
| 3. Robot OEM Assembly | Full robot integration, software/firmware, quality testing, certification (ISO 10218) | FANUC, ABB, KUKA, Yaskawa, Universal Robots | 25–35% |
| 4. System Integration | Application engineering, cell design, line commissioning, PLC/SCADA integration | Rockwell, Siemens, regional SIs | 18–25% |
| 5. Software & AI Layer | Programming platforms, vision AI, digital twins, ROS2, cloud connectivity | Realtime Robotics, Veo Robotics, RightHand Robotics | 28–40% |
| 6. Distribution & Service | Channel management, spare parts, predictive maintenance, training, upgrades | Regional distributors, OEM service arms | 15–20% |
Profit Pool Concentration: The highest margins in the robotic manipulation value chain are concentrated in the software & AI layer (28–40% gross margin) — yet this layer currently captures only ~12% of total market revenue. As companies like Covariant (AI-powered manipulation), Realtime Robotics (motion planning), and RightHand Robotics (AI grasping) scale, the value center of gravity will shift from hardware OEM to intelligence platform — mirroring the automotive industry's migration from powertrain to software-defined vehicle architecture.
Critical Control Points: (1) End-effector/gripper design — customization creates 18–36 month switching costs; (2) AI vision model training data — proprietary datasets become defensible IP moats; (3) Digital twin libraries — pre-configured simulation environments accelerate deployment and lock in recurring software revenue.
Robotic Manipulation Market _Demand-Supply & Trade Analysis
Production Geography
Japan dominates robot manufacturing with ~45% of global robot production output (FANUC, Yaskawa, Kawasaki, Denso). Germany accounts for ~18% (KUKA, Stäubli, Schunk components). China is accelerating production capacity, targeting 70% domestic supply of industrial robots by 2030 under the Made in China 2025 strategic plan — currently at approximately 38% domestic supply ratio.
Import-Export Dynamics
Key trade flow: Japan → North America and Europe (premium robots); China → Southeast Asia and LatAm (value segment); Germany → EU and US (system integration expertise). The US-China trade war created a $340 Mn annual tariff burden on robot imports into the US from China, accelerating nearshoring of robot manufacturing to Mexico — Mexican robot production capacity grew 28% in 2024. EU supply dependency: European buyers source ~62% of robot hardware from non-EU suppliers (Japan: 38%, China: 15%, US: 9%), creating supply chain resilience concerns under the EU Critical Raw Materials Act.
Supply Chain Concentration Risk
The servo motor market is 68% controlled by three Japanese suppliers (Yaskawa, Mitsubishi, Panasonic), creating single-source risk for robot OEMs. The 2021–2023 semiconductor shortage delayed robot deliveries by 6–12 months across the industry. Post-2024, OEMs are building 4–6 months of chip inventory buffers, adding ~3–5% to working capital requirements.
Robotic Manipulation Market _Technology & Innovation
AI-Powered Vision and Grasping
AI vision-guided manipulation is the single most disruptive technology development of the 2023–2025 period. Systems using convolutional neural networks and transformer architectures are achieving 99.7% pick accuracy for unstructured bin-picking — up from ~85% for rule-based vision in 2019. Covariant's foundation model approach, trained on 1 billion+ robot interaction data points, enables a single AI model to generalize across thousands of object types without task-specific retraining — eliminating the historic barrier of per-SKU programming that limited automation to structured environments.
Digital Twin & Simulation
Digital twin technology — full simulation of robot cell physics, kinematics, and interactions before physical deployment — is reducing commissioning time by 40% and reducing integration failures by 65%. NVIDIA's Omniverse platform, ABB's RobotStudio, and FANUC's ROBOGUIDE are the dominant platforms. ABB's 2025 partnership with NVIDIA on Omniverse-powered digital twins represents the convergence of industrial robot OEM expertise with hyperscaler AI infrastructure — a partnership architecture that smaller players cannot replicate.
Humanoid Robots — The Next Frontier
Humanoid robots capable of manipulation in human-designed environments represent a USD 38 Billion opportunity by 2035 (MMR estimate). Figure AI (Figure 02), Tesla (Optimus Gen 2), and Agility Robotics (Digit) are the leading contenders in the commercial humanoid race. Figure AI's demonstration of autonomous box manipulation in Amazon fulfillment centers in early 2025 marked the first commercial-scale humanoid manipulation deployment — a proof point that compresses the market's timeline expectation for unstructured environment automation by 3–5 years.
Robotics-as-a-Service (RaaS) Platform Innovation
The RaaS model — hardware + AI software + maintenance + monitoring as a subscription — is growing at 38% CAGR and directly resolves the two largest market adoption barriers (capex and expertise). Formic Technologies, Rapid Robotics, and Symbotic are the leading RaaS providers. The model shifts robot economics from capital deployment to operational expenditure — making robotic manipulation accessible to SME manufacturers with <100 employees for the first time.
Fig: Technology Segment Analysis — Articulated Robots Lead Revenue; Cobots Register Fastest Growth at 31.4% CAGR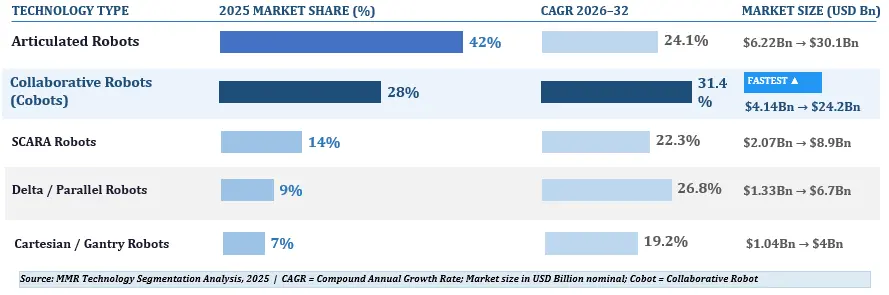
Robotic Manipulation Market _ Market Segmentation
Segment of Robotic Manipulation Market By Robot Type
| Robot Type | 2025 Share | 2025 Size (USD Bn) | 2032 Size (USD Bn) | CAGR | Primary Application | Key Players |
| Articulated Robots | ~X2% | $X.22Bn | $X0.1Bn | ~X4.1% | Auto assembly, heavy-payload handling | FANUC, KUKA, Yaskawa |
| Collaborative Robots (Cobots) | ~X8% | $X.14Bn | $X4.2Bn | ~X1.4% | SME assembly, QA, light-payload | Universal Robots, ABB |
| SCARA Robots | ~X4% | $X.07Bn | $X.9Bn | ~X2.3% | Electronics, pharma, precision insert | Epson, FANUC, Yaskawa |
| Delta / Parallel Robots | ~X% | $X.33Bn | $X.7Bn | ~X6.8% | High-speed pick & place, food | ABB, FANUC, Adept |
| Cartesian / Gantry Robots | ~X% | $X.04Bn | $X.0Bn | ~X9.2% | Material handling, large-area ops | Güdel, Rollon, Yamaha |
Segment of Robotic Manipulation Market by Application
Fig: Key Use Cases for Robotic Manipulation — Likelihood of Deployment by Application (% of Respondents, N=450)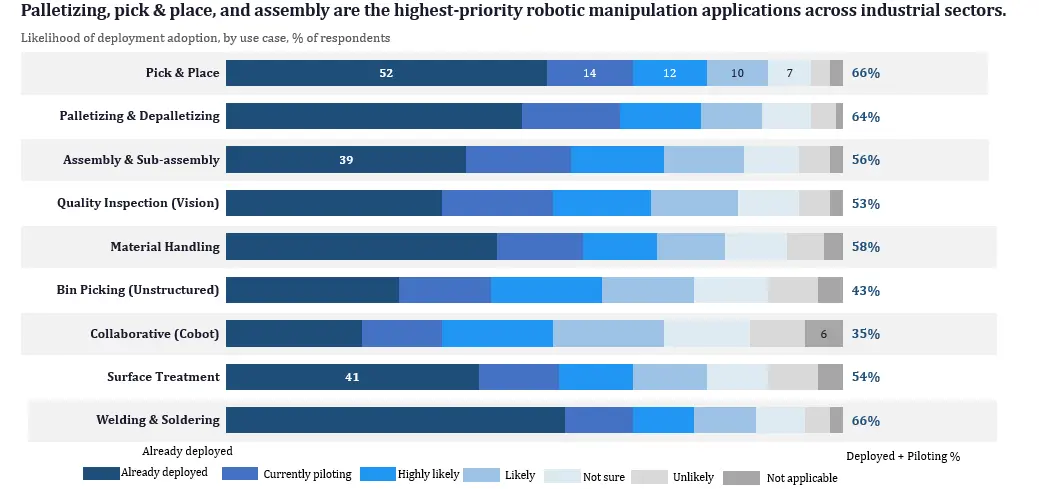
| Application | 2025 Share | Key Industries | Growth Driver | CAGR |
| Pick & Place | ~X1% | E-commerce, electronics, food | AI vision unlocking unstructured bins | ~X8.4% |
| Assembly & Sub-assembly | ~X2% | Automotive, electronics, pharma | Cobot democratization in SME assembly | ~X7.1% |
| Material Handling | ~X8% | Logistics, automotive, steel | Warehouse automation mega-investment | ~X4.8% |
| Palletizing / Depalletizing | ~X1% | FMCG, food & beverage, retail | Labor replacement at scale | ~X.6% |
| Quality Inspection | ~X% | Electronics, pharma, aerospace | AI vision for defect detection | ~X.8% |
| Welding & Surface Treatment | ~X% | Automotive, aerospace, construction | Precision + safety requirements | ~X9.4% |
| Others | ~X% | Cleanroom, medical, specialty | Medical robot manipulation emerging | ~X6.2% |
Segment of Robotic Manipulation Market by End-User Industry
Automotive remains the largest historical vertical at 38% market share — but its relative dominance is declining as e-commerce/logistics (fastest-growing) and electronics manufacturing rapidly expand their robotic manipulation footprint.
| Industry Vertical | Adoption Maturity | Key Use Cases | 3-Year Deployment Plan % |
| Automotive | Mature | Welding, assembly, paint, inspection | 88% of players |
| Electronics Manufacturing | Growth | PCB handling, precision insertion, QA | 85% of players |
| E-commerce & Logistics | High Growth | Pick & place, palletizing, sorting | 91% of players |
| Food & Beverage | Early Growth | Packaging, portioning, palletizing | 79% of players |
| Healthcare & Pharma | Emerging | Cleanroom handling, dispensing, surgery | 74% of players |
| Aerospace & Defense | Niche-Specialist | Drilling, riveting, composite handling | 68% of players |
| Others | Early Stage | AgriTech, construction, retail | Variable |
Fig: All Industries Show a Gap Between Current Robotic Manipulation Deployment and 3-Year Implementation Plans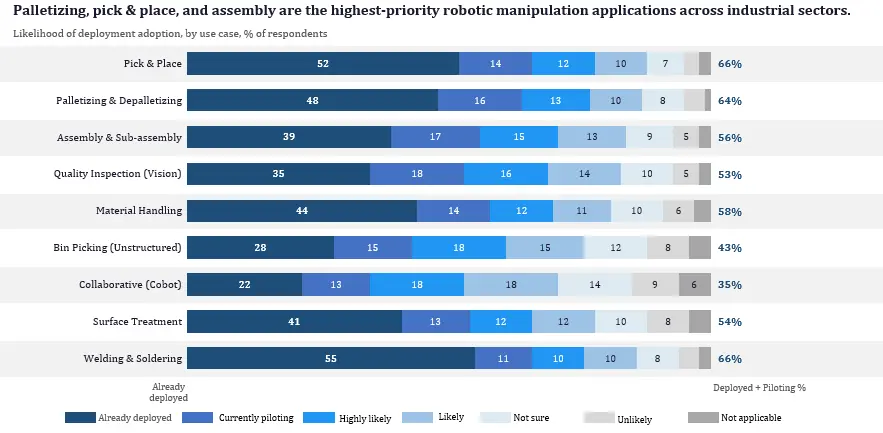
Robotic Manipulation Market _Regional Analysis
| Region | 2025 Share | 2025 Size | 2032 Size | CAGR | Top Verticals | Key Opportunity |
| North America | ~X5% | ~$X.18Bn | ~$24.8Bn | ~X4.8% | Automotive, E-commerce, Aerospace | Cobot regulatory clarity; RaaS models scaling |
| Asia Pacific | ~31% | ~$X.59Bn | ~$23.1Bn | ~X8.1% | Electronics, Auto, Consumer Goods | FASTEST GROWING — China + India greenfield |
| Europe | ~X6% | ~$X.85Bn | ~$18.5Bn | ~X2.9% | Automotive, Pharma, Food & Bev | EU AI Act compliance driving safety-certified cobots |
| Middle East & Africa | ~X% | ~$X.59Bn | ~$4.1Bn | ~XX.3% | Oil & Gas, Logistics | Smart city + Vision 2030 investment inflows |
| Latin America | ~4% | ~$X.59Bn | ~$4.8Bn | ~XX.8% | Automotive, Food Processing | Nearshoring investment from North America |
North America — Market Leader in Robotic Manipulation Market
North America commands ~35% global revenue share ($5.18 Billion in 2025), driven by the world's largest e-commerce infrastructure (Amazon, Walmart), the most advanced automotive robotics deployment base (Detroit corridor, Tesla Gigafactories), and the highest cobot penetration per manufacturing employee. The US CHIPS and Science Act ($52.7 Billion) and IIJA infrastructure investments are catalyzing semiconductor and battery manufacturing buildout — both high-automation intensity sectors.
Asia Pacific — Fastest Growing at 28.1% CAGR in Robotic Manipulation Market
Asia Pacific is the fastest-growing regional market at 28.1% CAGR — reaching an estimated $23.1 Billion by 2032. China's "14th Five-Year Plan" robot density target of 500 robots per 10,000 workers by 2030 (currently ~392) requires deployment of ~1.2 million additional robots. India's PLI (Production-Linked Incentive) scheme is driving USD 68 Billion in manufacturing investment with robotic manipulation at its automation core. Japan's robot-native culture and aging workforce challenge make it structurally the most automation-receptive major economy globally.
Europe — Regulatory Tailwinds + Automotive Heritage in Robotic Manipulation Market
Germany alone accounts for ~48% of European robotic manipulation revenue, driven by automotive OEM density (BMW, Mercedes, Volkswagen, Audi) and the strongest Industry 4.0 adoption in the world. The EU Machinery Regulation 2023/1230 (effective January 2027) will mandate updated safety certifications for all robot systems deployed in EU workplaces — creating both a compliance-driven replacement cycle and a barrier to non-certified entrants.
Robotic Manipulation Market _Competitive Landscape
Fig: Competitive Landscape — Top 10 Players by Estimated Revenue Share & Strategic Position: FANUC, ABB & KUKA Lead with 48.5% Combined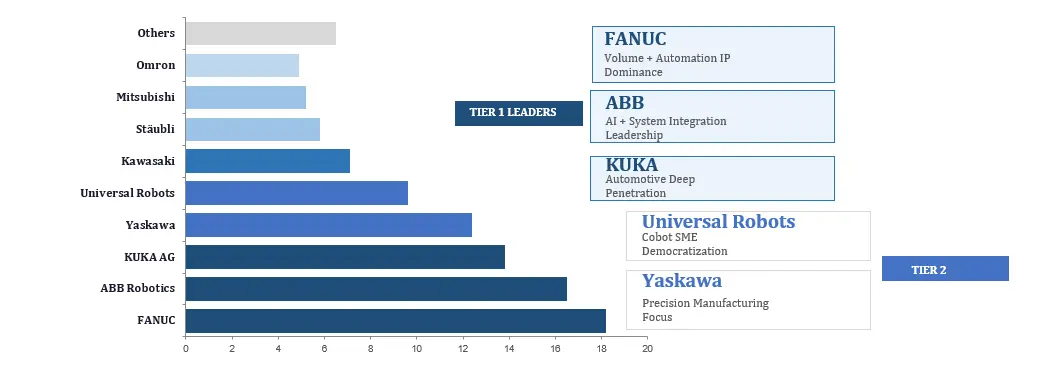
| Company | HQ | 2025 Rev. Share | Core Strength | Key Strategy | CAGR Outlook |
| FANUC Corporation | Japan | ~X8.2% | CNC + Robot IP, zero-downtime engineering | Volume + Precision Dominance | ~X2% |
| ABB Robotics | Switzerland | ~X6.5% | System integration + AI-guided manipulation | AI + Electrification Convergence | ~X5% |
| KUKA AG (Midea) | Germany/China | ~XX.8% | Automotive line automation, HMI excellence | Automotive Deep Penetration | ~X4% |
| Yaskawa Electric | Japan | ~XX.4% | Servo + motion control precision | Precision Manufacturing Focus | ~X3% |
| Universal Robots (Teradyne) | Denmark | ~XX.6% | Cobot democratization, ease of programming | SME Cobot Market Capture | ~XX% |
| Kawasaki Robotics | Japan | ~X.1% | Heavy-payload, pharma + food robotics | Pharma + Food Vertical Focus | ~XX% |
| Stäubli Robotics | Switzerland | ~XX.8% | Cleanroom & textile precision manipulation | Niche Premium Vertical | ~X0% |
| Mitsubishi Electric | Japan | ~X.2% | FA integration, compact robot systems | Factory Automation Ecosystem | ~X2% |
Competitive Concentration: The top 5 players (FANUC, ABB, KUKA, Yaskawa, Universal Robots) control an estimated 70.5% of global revenue — but the AI/software layer is fragmented among 100+ startups competing for the highest-margin segment of the value chain. The incumbent advantage is eroding in software: legacy robot OEMs' proprietary programming languages (FANUC's Karel, ABB's RAPID, KUKA's KRL) are losing relevance as ROS2 (Robot Operating System) and open AI manipulation frameworks enable application portability across robot brands — shifting value from hardware lock-in to intelligence platform.
Investment & Opportunity Analysis in Robotic Manipulation Market
Venture and strategic investment in robotic manipulation reached $2.8 Billion in 2024 alone — the highest annual figure in the sector's history. The humanoid robot sub-sector drew $1.2 Billion+ of that total, with Figure AI ($675 Mn), Apptronik ($350 Mn), and Agility Robotics ($150 Mn) completing landmark rounds. Investment is concentrating around three ROI theses: (1) AI foundation models for manipulation (Covariant, Physical Intelligence, 1X Technologies); (2) RaaS business model companies (Formic, Rapid Robotics, Symbotic); (3) Hardware-AI convergence platforms (Realtime Robotics, Veo Robotics, Robust.AI).
| Company | HQ | Funding | Year | Round | Strategic Focus |
| Figure AI | USA | $XX Mn | 2024 | Series B | Humanoid robot manipulation — Microsoft, OpenAI, Nvidia, Amazon backed |
| Agility Robotics | USA | $XX Mn | 2024 | Series B | Bipedal robot for warehouse manipulation; Amazon deployment underway |
| Apptronik | USA | $XX Mn | 2024 | Series A | Apollo humanoid robot; NASA + commercial logistics focus |
| Machina Labs | USA | $XX Mn | 2024 | Series B | AI-driven sheet metal forming via robotic manipulation |
| Mujin | Japan | $X5 Mn | 2023 | Series C | Autonomous robot intelligence for logistics manipulation |
| Realtime Robotics | USA | $XX Mn | 2023 | Series B | Real-time motion planning chip for multi-robot coordination |
| Right Hand Robotics | USA | $XX Mn | 2023 | Series C | AI-powered piece-picking for e-commerce fulfillment |
| Covariant | USA | $XX Mn | 2024 | Series D | Foundation model for universal robot manipulation; Ocado partnership |
Highest ROI Opportunity Pockets by 2032:
• SME Cobot Market: Currently <8% penetrated — TAM of USD 3.2 Trillion; cobot ASP declining 8% annually
• RaaS Subscriptions: From 4% of revenue today to projected 22% by 2032 — highest margin SaaS-like model
• AI Vision & Foundation Models: Gross margins of 70–80%+ for software-only AI manipulation platforms
• Humanoid Robotics: USD 38 Billion opportunity by 2035 — currently pre-commercial; highest venture IRR potential
• India & Southeast Asia Greenfield: <50 robots per 10,000 workers vs Japan's 399 — 8× expansion headroom
Strategic Insights — MMR Consulting Recommendations
Insight 1: The RaaS Window Is Now — Capex Models Will Lose
What companies should do: Robot OEMs and system integrators that build RaaS-compatible hardware and service architectures in 2025–2026 will capture the SME market before competitors. The first major OEM to offer a credible RaaS product at $3,500–$6,000/month for a complete robotic manipulation cell will unlock a buyer segment 3× larger than the current addressable capex market. Universal Robots and ABB are closest — but neither has made a decisive RaaS product commitment. The window is approximately 18–24 months before a pure-play RaaS provider scales to dominant share.
Insight 2: Software Is the New Moat — Hardware is the Distribution Vehicle
What companies should do: Legacy robot OEMs must aggressively open their hardware to third-party AI platforms (ROS2, NVIDIA Jetson, Covariant AI) or risk being commoditized to hardware margin providers for AI software companies that will capture 5× their revenue per robot. The companies building proprietary AI manipulation datasets today are building the defensible moat of 2030. Every pick-and-place interaction generates training data — companies with the most robot deployments will compound their AI advantage exponentially, mirroring Google's data network effect in search.
Insight 3: Eastern Europe and India Are the Under-Indexed Growth Theatres
What companies should do: Poland, Czech Republic, and Hungary are receiving USD 84 Billion in EU cohesion fund investment through 2027, with industrial automation explicitly prioritized. Robot density in these markets is 70–80% below Western Europe — creating a structural replacement and new-installation demand wave. Simultaneously, India's "Make in India" manufacturing buildout requires an estimated 480,000 industrial robots by 2028 against a current installed base of ~42,000. The companies establishing distribution, application engineering, and service networks in Poland and India before 2026 will capture disproportionate share of markets that will be 3–5× larger and significantly harder to enter by 2028.
Key Recent Developments: M&A, Partnerships, and Product Launches in Robotic Manipulation Market (2024–2025)
| Date | Company | Type | Development |
| Jan 2025 | FANUC | Product Launch | FANUC CRX-25iA — highest payload cobot (25 kg) launched for heavy-duty assembly lines |
| Feb 2025 | ABB Robotics | Partnership | ABB × NVIDIA collaboration on Omniverse-powered digital twin for robotic manipulation cells |
| Mar 2025 | Universal Robots | Product Launch | UR30 — 30 kg payload cobot targeting palletizing and machine-tending applications |
| Apr 2025 | Covariant | Partnership | Partnership with Ocado for AI-powered grocery fulfillment manipulation at scale |
| Q1 2025 | Figure AI | Funding | $675 Mn raised; humanoid robot (Figure 02) demonstrated autonomous box manipulation |
| 2024 Full Year | KUKA AG | Expansion | KUKA opened new smart factory in Augsburg — 60% robotic production of robots itself |
| Oct 2024 | Yaskawa Electric | Product Launch | GP series robots with integrated AI vision — real-time bin-picking at 99.4% accuracy |
| Sep 2024 | Realtime Robotics | Technology | RapidPlan 2.0 — 10× faster motion planning reducing cobot deployment time from weeks to hours |
| 2024 | EU Commission | Regulatory | EU Machinery Regulation 2023/1230 passed — effective January 2027 for all robot systems |
| Aug 2024 | Amazon Robotics | Deployment | Sparrow robot system expanded to 1,000+ fulfillment centers — 4.5 Mn picks/day milestone |
Key Players in Robotics Manipulation Market
| Sr. No. | Company | HQ | Core Specialisation & Strategic Position |
| 1 | FANUC Corporation | Japan | Market leader — 18.2% share; zero-downtime automation engineering; FANUC CRX cobot line |
| 2 | ABB Robotics | Switzerland | NVIDIA Omniverse digital twin partnership (2025); IRB series + YuMi cobot; ABB AbilityTM platform |
| 3 | KUKA AG (Midea Group) | Germany | Strongest automotive OEM penetration globally; iiwa cobot; KUKA.Sim digital twin |
| 4 | Yaskawa Electric Corporation | Japan | Motoman GP series with AI vision (2024); 99.4% bin-picking accuracy; servo motor IP leadership |
| 5 | Universal Robots (Teradyne) | Denmark | 68% pure-play cobot market share; UR3e–UR30 range; 2-hour setup without robotics engineer |
| 6 | Kawasaki Robotics | Japan | duAro dual-arm cobot; pharma cleanroom validated systems; RS series heavy-payload |
| 7 | Stäubli International AG | Switzerland | TX2 series cleanroom certified; TS2 SCARA; strongest EU pharma and semiconductor penetration |
| 8 | Mitsubishi Electric Corporation | Japan | MELFA FR series; RV series SCARA; integrated FA ecosystem with PLCs and HMIs |
| 9 | Omron Corporation | Japan | TM series cobots; LD mobile robot + manipulation stack; vision-guided autonomous systems |
| 10 | Epson Robots (Seiko Epson) | Japan | World's fastest SCARA (LS series); compact 6-axis for electronics assembly; force sensing IP |
| 11 | Fanuc America Corporation | USA | Largest installed base in North America; LR Mate series; ROBOGUIDE simulation platform |
| 12 | Denso Robotics (Toyota Group) | Japan | World's smallest 6-axis robot (VS series); automotive heritage; high-speed assembly |
| 13 | Comau S.p.A. (Stellantis) | Italy | AURA cobot (highest payload — 110kg); REBEL-S compact cobot; deep automotive OEM relationships |
| 14 | Nachi-Fujikoshi Corporation | Japan | SRA series welding robots; MC series machining; proprietary spindle + robot integration |
| 15 | Doosan Robotics | South Korea | M-series cobots at 25–40% below incumbents; 15kg highest payload in class; growing EU presence |
| 16 | Techman Robot (Quanta Storage) | Taiwan | TM series with embedded vision — no external camera required; fastest-growing in electronics |
| 17 | Franka Emika (Agile Robots) | Germany | Panda research robot (20,000+ universities); Gen3 industrial; torque-sensing at every joint |
| 18 | Realtime Robotics | USA | RapidPlan 2.0 chip — 10× faster motion planning; reduces deployment from weeks to hours |
| 19 | Covariant AI | USA | $1.5Bn implied valuation; 1Bn+ robot-object interaction training points; Ocado EU deployment |
| 20 | RightHand Robotics | USA | 350 SKU/hour AI picking; RightPick 3 platform; deployed at DHL, XPO, Ingram Micro |
| 21 | Agility Robotics (Hybrid Robotics) | USA | Digit humanoid — Amazon fulfillment pilot; $150Mn Series B (2024); walking + manipulation |
| 22 | Figure AI | USA | $675Mn raised (Microsoft, NVIDIA, OpenAI, Amazon); Figure 02 autonomous box manipulation demo |
| 23 | Symbotic Inc. | USA | Walmart deployment — 42 DCs; Symbotic AI + robotic manipulation at $70Bn+ contract backlog |
| 24 | Formic Technologies | USA | $5.50/hour RaaS pricing vs $18–28/hour US labor; pay-per-use manipulation — no capex required |
| 25 | Mujin Corporation | Japan/USA | MujinController AI; deployed at Uniqlo, Honda, Amazon Japan; $85Mn Series C (2023) |
Frequently Asked Questions - Robotic Manipulation Market
Q1. What is the size of the Global Robotic Manipulation Market in 2025?
A: The Global Robotic Manipulation Market is valued at USD 14.8 Billion in 2025 and is projected to reach USD 75.3 Billion by 2032, growing at a CAGR of 26.2% during 2025–2032.
Q2. Which robot type segment dominates?
A: Articulated robots dominate with ~42% revenue share ($6.22 Billion in 2025). However, Collaborative Robots (Cobots) are the fastest-growing segment at 31.4% CAGR, driven by SME democratization and ease-of-programming advances.
Q3. Which region leads and which is fastest growing?
A: North America leads with ~35% revenue share. Asia Pacific is the fastest-growing region at ~28.1% CAGR, powered by China's robot density targets, India's manufacturing buildout, and Japan's automation-native industrial culture.
Q4. What are the key drivers of robotic manipulation market growth?
A: Key drivers include: (1) Labor cost inflation +18% in 5 years compressing ROI payback to 2.3 years; (2) AI vision achieving 99.7% pick accuracy; (3) E-commerce volume growing 3.8× since 2019; (4) EU/US industrial automation policy support; (5) Cobot democratization opening USD 3.2 Trillion SME market.
Q5. What is Robotics-as-a-Service (RaaS) and why does it matter?
A: RaaS packages robot hardware, AI software, maintenance, and monitoring into a monthly subscription (typically USD 2,500–$8,000/month). Growing at 38% CAGR, RaaS directly eliminates the #1 adoption barrier (capex) and is projected to represent 22% of total market revenue by 2032 vs ~4% today. Companies including Formic, Rapid Robotics, and Symbotic are leading this structural market transition.
Q6. Who are the top players in the Robotic Manipulation Market?
A: Key players include FANUC Corporation (~18.2% share), ABB Robotics (~16.5%), KUKA AG (~13.8%), Yaskawa Electric (~12.4%), Universal Robots (~9.6%) plus emerging AI-native challengers including Covariant, Figure AI, Realtime Robotics, and Right Hand Robotics.
Q7. What is the most important trend shaping the market through 2032?
A: The convergence of foundation AI models with robotic manipulation hardware — enabling robots to generalize across thousands of object types without task-specific programming. This trend collapses the structural barrier between structured-environment automation (current) and unstructured-environment automation (the entire remaining market) — unlocking a USD 3.2 Trillion addressable market currently beyond automation's reach.