Physical Security Market: Global Industry Analysis and Forecast (2023-2029)

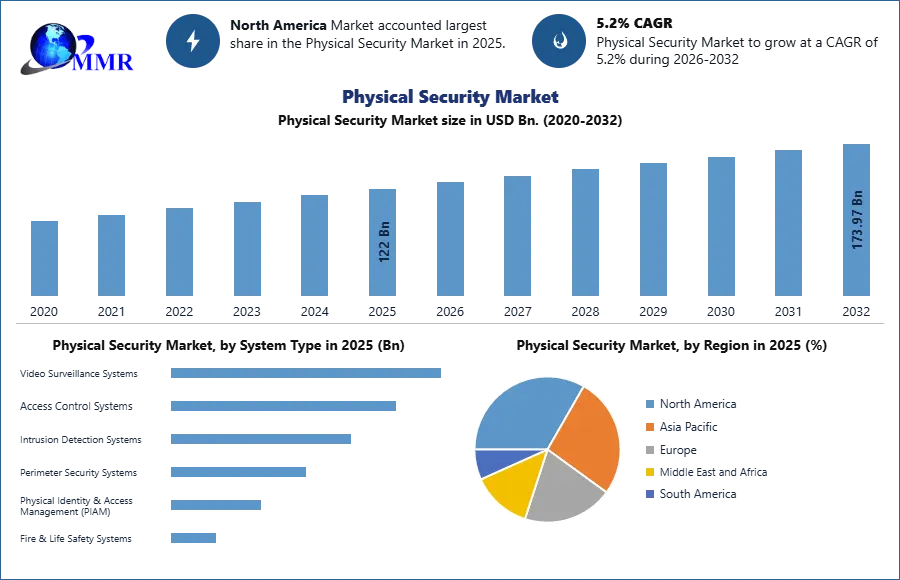
Physical Security Market size was valued at US$ 103.47 Bn. in 2022 and the total revenue is expected to grow at a CAGR of 5.2% through 2023 to 2029, reaching nearly US$ 147.55 Bn.

Global Physical Security Market Overview:

The Global Physical Security market was valued at US $ 103.47 Bn. in 2022, and it is expected to reach US $147.55 Bn. by 2029 with a CAGR of 5.2% during the forecast period. Physical security comprises the protection of assets like, hardware, software, data, personnel, and networks against physical events and actions, which may possibly cause damage or loss to an organization. Physical security encompasses three crucial elements, which contain access control, surveillance, and testing. The physical places are protected against attacks, adverse coincidences, or environmental calamities by the use of locks, biometric access control systems, access control cards, fire sensors, and alarm systems.Physical Security MarketTo know about the Research Methodology :- Request Free Sample Report

Global Physical Security Market Dynamics:

Physical locations are also supervised by monitoring cameras and notification systems, including heat & smoke sensors, and interloping detection sensors. With an interval of time disaster recovery techniques and policies always needed inspection to ensure superior safety and moderate the time engaged for recovering from disasters. Physical security uses multiple layers of interdependent systems to protect enterprises from natural disasters, fire, theft, and terrorism. The multiple layers of the interdependent systems include CCTV surveillance, locks, protective fences, access control protocols, security guards, and other related techniques. The introduction of the Internet of Things (IoT) into physical security has accelerated the growth of the global physical security market. The incidences of terror attacks, technological advancements, and growth in demand for such facilities in smart cities are driving the physical security market. Public security and entities like commercial, residential and BFSI services are the key areas of focus for government to ensure protection against crime, theft, disasters, and accidents. The concept of a smart city or infrastructure of tier I & II cities is actually integrated with smart security solutions. Thus, growth in the number of smart cities is anticipated to boost the growth of the physical security market. The government of many countries has amplified their concern for physical security due to the rise in terrorism and started to put more capital into it. Several governments are focused and spending huge amounts on installing advanced video surveillance and access control systems. The merger of physical & electronic spaces due to technological advancements has aided the greater adoption of physical security systems. The evolution of wireless technologies, IoT, and smart technologies are forecasted to play a vital role in the transformation of physical security systems. The privacy concerns, inattentive attitude, and lack of physical & logical security integration are expected to affect adversely the market growth during the forecast period.

Global Physical Security Market Segment Analysis:

Based on the Type, the market is segmented into Video Surveillance, Access & Entrance Control, Perimeter Intrusion & Detection, Remote Monitoring, and Security Systems Integration. Video Surveillance segment is expected to hold the largest market shares of xx% by 2029. The primary reason for this growth is convenience and trustworthy output from this security system. This allows user to monitor live conditions as well as enable to check previously happened incidences and activities also. These are the key factor that drives the growth of this segment in the global market during the forecast period. Based on the Industry Vertical, the market is segmented into BFSI, Commercial, Government, and Others. BFSI segment is expected to grow rapidly at a CAGR of xx% during the forecast period. An increasing demand for physical security in BFSI industry is the key factor that drives the growth of the BFSI Industry segment in the global market during the forecast period 2023-2029. North America dominates the global Physical Security market during the forecast period 2023-2029. North America is expected to hold the largest market shares of xx% by 2029. Rapid & consistent renovation activities of residential places along with the rising construction activities at commercial places are the driving factor for the physical security market in North America. These are the key factor that drives the growth of North America region in the global market during the forecast period 2023-2029. Asia Pacific is expected to grow rapidly at a CAGR of xx% during the forecast period. In the Asia Pacific, the growing thefts in both residential and non-residential buildings are generating huge demand for physical security. Terrorist activities and the higher need for new & secure systems are boosting the demand in the Asia Pacific. These are the major factor that boost the growth of Asia Pacific region in the global market during the forecast period. Europe is expected to grow rapidly at a CAGR of xx% during the forecast period. This is due to high demand and fast adoption of physical security systems. Major growth in the physical security market in Europe is mainly witnessed in countries such as the U.K., Italy, and Germany. The objective of the report is to present a comprehensive analysis of the Global Physical Security Market to the stakeholders in the industry. The past and current status of the industry with the forecasted market size and trends are presented in the report with the analysis of complicated data in simple language. The report covers all the aspects of the industry with a dedicated study of key players that include market leaders, followers, and new entrants. PORTER, PESTEL analysis with the potential impact of micro-economic factors of the market have been presented in the report. External as well as internal factors that are supposed to affect the business positively or negatively have been analyzed, which will give a clear futuristic view of the industry to the decision-makers. The reports also helps in understanding the Global Physical Security Market dynamic, structure by analyzing the market segments and project the Global Physical Security Market size. Clear representation of competitive analysis of key players by product, price, financial position, product portfolio, growth strategies, and regional presence in the Global Physical Security Market make the report investor’s guide.

Global Physical Security Market Scope: Inquire before buying

Global Physical Security Market
Report Coverage Details
Base Year: 2022 Forecast Period: 2023-2029
Historical Data: 2017 to 2022 Market Size in 2022: US $ 103.47 Bn.
Forecast Period 2023 to 2029 CAGR: 5.2% Market Size in 2029: US $ 147.55 Bn.
Segments Covered: by Type Video Surveillance Access & Entrance Control Perimeter Intrusion & Detection Remote Monitoring Security Systems Integration Safe Security System
by Industry Vertical BFSI Commercial Government Other

Global Physical Security Market, by Region

North America (United States, Canada and Mexico) Europe (UK, France, Germany, Italy, Spain, Sweden, Austria, Turkey, Russia and Rest of Europe) Asia Pacific (China, India, Japan, South Korea, Australia, ASEAN and Rest of APAC) Middle East and Africa (South Africa, GCC, Egypt, Nigeria and Rest of ME&A) South America (Brazil, Argentina, Columbia and Rest of South America)

Global Physical Security Market Key Players

1.Anixter International Inc. 2. Tyco International PLC. 3. Cisco Systems, Inc. 4. Genetec Inc. 5. ADT Corporation 6. Honeywell International, Inc. 7. Bosch Security Systems, Inc. 8. Stanley Security 9. Senstar Corporation 10. Hikvision 11. Axis Communication 12. Pelco 13. Dahua Technology 14. Kastle Systems 15. SECOM

Frequently Asked Questions:

1] What segments are covered in Physical Security Market report? Ans. The segments covered in Physical Security Market report are based on Type, and Industry Vertical. 2] Which region is expected to hold the highest share in the Global Physical Security Market? Ans. North America is expected to hold the highest share in the Global Physical Security Market. 3] Who are the top key players in the Global Physical Security Market? Ans. Hikvision, Axis Communication, Pelco, Dahua Technology, Kastle Systems, and SECOM are the top key players in the Global Physical Security Market. 4] Which segment holds the largest market share in the Global  market by 2029? Ans. Video Surveillance segment hold the largest market share in the Global  market by 2029. 5] What is the market size of the Global  market by 2029? Ans. The market size of the Global P market is US $ 147.55 Bn. by 2029. 6] What was the market size of the Global  market in 2022? Ans. The market size of the Global market was worth US $ 103.47 Bn. in 2022.
1. Physical Security Market: Research Methodology 2. Physical Security Market Introduction 2.1. Study Assumption and Market Definition 2.2. Scope of the Study 2.3. Executive Summary 3. Physical Security Market: Dynamics 3.1. Physical Security Market Trends by Region 3.1.1. North America Physical Security Market Trends 3.1.2. Europe Physical Security Market Trends 3.1.3. Asia Pacific Physical Security Market Trends 3.1.4. Middle East and Africa Physical Security Market Trends 3.1.5. South America Physical Security Market Trends 3.2. Physical Security Market Dynamics by Region 3.2.1. North America 3.2.1.1. North America Physical Security Market Drivers 3.2.1.2. North America Physical Security Market Restraints 3.2.1.3. North America Physical Security Market Opportunities 3.2.1.4. North America Physical Security Market Challenges 3.2.2. Europe 3.2.2.1. Europe Physical Security Market Drivers 3.2.2.2. Europe Physical Security Market Restraints 3.2.2.3. Europe Physical Security Market Opportunities 3.2.2.4. Europe Physical Security Market Challenges 3.2.3. Asia Pacific 3.2.3.1. Asia Pacific Physical Security Market Drivers 3.2.3.2. Asia Pacific Physical Security Market Restraints 3.2.3.3. Asia Pacific Physical Security Market Opportunities 3.2.3.4. Asia Pacific Physical Security Market Challenges 3.2.4. Middle East and Africa 3.2.4.1. Middle East and Africa Physical Security Market Drivers 3.2.4.2. Middle East and Africa Physical Security Market Restraints 3.2.4.3. Middle East and Africa Physical Security Market Opportunities 3.2.4.4. Middle East and Africa Physical Security Market Challenges 3.2.5. South America 3.2.5.1. South America Physical Security Market Drivers 3.2.5.2. South America Physical Security Market Restraints 3.2.5.3. South America Physical Security Market Opportunities 3.2.5.4. South America Physical Security Market Challenges 3.3. PORTER’s Five Forces Analysis 3.4. PESTLE Analysis 3.5. Technology Roadmap 3.6. Regulatory Landscape by Region 3.6.1. North America 3.6.2. Europe 3.6.3. Asia Pacific 3.6.4. Middle East and Africa 3.6.5. South America 3.7. Key Opinion Leader Analysis For Physical Security Market 3.8. Analysis of Government Schemes and Initiatives For the Physical Security Market 3.9. The Global Pandemic Impact on the Physical Security Market 3.10. IoT in Physical Security 3.10.1. Integration of Sensors and Devices 3.10.2. Smart Building Security 4. Physical Security Market: Global Market Size and Forecast by Segmentation (by Value in USD Million) (2023-2030) 4.1. Physical Security Market Size and Forecast, By Type (2023-2030) 4.1.1. Video Surveillance 4.1.2. Access & Entrance Control 4.1.3. Perimeter Intrusion & Detection 4.1.4. Remote Monitoring 4.1.5. Security Systems Integration 4.1.6. Safe Security System 4.2. Physical Security Market Size and Forecast, By Industry Vertical (2023-2030) 4.2.1. BFSI 4.2.2. Commercial 4.2.3. Government 4.2.4. Other 4.3. Physical Security Market Size and Forecast, by Region (2023-2030) 4.3.1. North America 4.3.2. Europe 4.3.3. Asia Pacific 4.3.4. Middle East and Africa 4.3.5. South America 5. North America Physical Security Market Size and Forecast by Segmentation (by Value in USD Million) (2023-2030) 5.1. North America Physical Security Market Size and Forecast, By Type (2023-2030) 5.1.1. Video Surveillance 5.1.2. Access & Entrance Control 5.1.3. Perimeter Intrusion & Detection 5.1.4. Remote Monitoring 5.1.5. Security Systems Integration 5.1.6. Safe Security System 5.2. North America Physical Security Market Size and Forecast, By Industry Vertical (2023-2030) 5.2.1. BFSI 5.2.2. Commercial 5.2.3. Government 5.2.4. Other 5.3. North America Physical Security Market Size and Forecast, by Country (2023-2030) 5.3.1. United States 5.3.1.1. United States Physical Security Market Size and Forecast, By Type (2023-2030) 5.3.1.1.1. Video Surveillance 5.3.1.1.2. Access & Entrance Control 5.3.1.1.3. Perimeter Intrusion & Detection 5.3.1.1.4. Remote Monitoring 5.3.1.1.5. Security Systems Integration 5.3.1.1.6. Safe Security System 5.3.1.2. United States Physical Security Market Size and Forecast, By Industry Vertical (2023-2030) 5.3.1.2.1. BFSI 5.3.1.2.2. Commercial 5.3.1.2.3. Government 5.3.1.2.4. Other 5.3.2. Canada 5.3.2.1. Canada Physical Security Market Size and Forecast, By Type (2023-2030) 5.3.2.1.1. Video Surveillance 5.3.2.1.2. Access & Entrance Control 5.3.2.1.3. Perimeter Intrusion & Detection 5.3.2.1.4. Remote Monitoring 5.3.2.1.5. Security Systems Integration 5.3.2.1.6. Safe Security System 5.3.2.2. Canada Physical Security Market Size and Forecast, By Industry Vertical (2023-2030) 5.3.2.2.1. BFSI 5.3.2.2.2. Commercial 5.3.2.2.3. Government 5.3.2.2.4. Other 5.3.3. Mexico 5.3.3.1. Mexico Physical Security Market Size and Forecast, By Type (2023-2030) 5.3.3.1.1. Video Surveillance 5.3.3.1.2. Access & Entrance Control 5.3.3.1.3. Perimeter Intrusion & Detection 5.3.3.1.4. Remote Monitoring 5.3.3.1.5. Security Systems Integration 5.3.3.1.6. Safe Security System 5.3.3.2. Mexico Physical Security Market Size and Forecast, By Industry Vertical (2023-2030) 5.3.3.2.1. BFSI 5.3.3.2.2. Commercial 5.3.3.2.3. Government 5.3.3.2.4. Other 6. Europe Physical Security Market Size and Forecast by Segmentation (by Value in USD Million) (2023-2030) 6.1. Europe Physical Security Market Size and Forecast, By Type (2023-2030) 6.2. Europe Physical Security Market Size and Forecast, By Industry Vertical (2023-2030) 6.3. Europe Physical Security Market Size and Forecast, by Country (2023-2030) 6.3.1. United Kingdom 6.3.1.1. United Kingdom Physical Security Market Size and Forecast, By Type (2023-2030) 6.3.1.2. United Kingdom Physical Security Market Size and Forecast, By Industry Vertical (2023-2030) 6.3.2. France 6.3.2.1. France Physical Security Market Size and Forecast, By Type (2023-2030) 6.3.2.2. France Physical Security Market Size and Forecast, By Industry Vertical (2023-2030) 6.3.3. Germany 6.3.3.1. Germany Physical Security Market Size and Forecast, By Type (2023-2030) 6.3.3.2. Germany Physical Security Market Size and Forecast, By Industry Vertical (2023-2030) 6.3.4. Italy 6.3.4.1. Italy Physical Security Market Size and Forecast, By Type (2023-2030) 6.3.4.2. Italy Physical Security Market Size and Forecast, By Industry Vertical (2023-2030) 6.3.5. Spain 6.3.5.1. Spain Physical Security Market Size and Forecast, By Type (2023-2030) 6.3.5.2. Spain Physical Security Market Size and Forecast, By Industry Vertical (2023-2030) 6.3.6. Sweden 6.3.6.1. Sweden Physical Security Market Size and Forecast, By Type (2023-2030) 6.3.6.2. Sweden Physical Security Market Size and Forecast, By Industry Vertical (2023-2030) 6.3.7. Austria 6.3.7.1. Austria Physical Security Market Size and Forecast, By Type (2023-2030) 6.3.7.2. Austria Physical Security Market Size and Forecast, By Industry Vertical (2023-2030) 6.3.8. Rest of Europe 6.3.8.1. Rest of Europe Physical Security Market Size and Forecast, By Type (2023-2030) 6.3.8.2. Rest of Europe Physical Security Market Size and Forecast, By Industry Vertical (2023-2030) 7. Asia Pacific Physical Security Market Size and Forecast by Segmentation (by Value in USD Million) (2023-2030) 7.1. Asia Pacific Physical Security Market Size and Forecast, By Type (2023-2030) 7.2. Asia Pacific Physical Security Market Size and Forecast, By Industry Vertical (2023-2030) 7.3. Asia Pacific Physical Security Market Size and Forecast, by Country (2023-2030) 7.3.1. China 7.3.1.1. China Physical Security Market Size and Forecast, By Type (2023-2030) 7.3.1.2. China Physical Security Market Size and Forecast, By Industry Vertical (2023-2030) 7.3.2. S Korea 7.3.2.1. S Korea Physical Security Market Size and Forecast, By Type (2023-2030) 7.3.2.2. S Korea Physical Security Market Size and Forecast, By Industry Vertical (2023-2030) 7.3.3. Japan 7.3.3.1. Japan Physical Security Market Size and Forecast, By Type (2023-2030) 7.3.3.2. Japan Physical Security Market Size and Forecast, By Industry Vertical (2023-2030) 7.3.4. India 7.3.4.1. India Physical Security Market Size and Forecast, By Type (2023-2030) 7.3.4.2. India Physical Security Market Size and Forecast, By Industry Vertical (2023-2030) 7.3.5. Australia 7.3.5.1. Australia Physical Security Market Size and Forecast, By Type (2023-2030) 7.3.5.2. Australia Physical Security Market Size and Forecast, By Industry Vertical (2023-2030) 7.3.6. Indonesia 7.3.6.1. Indonesia Physical Security Market Size and Forecast, By Type (2023-2030) 7.3.6.2. Indonesia Physical Security Market Size and Forecast, By Industry Vertical (2023-2030) 7.3.7. Malaysia 7.3.7.1. Malaysia Physical Security Market Size and Forecast, By Type (2023-2030) 7.3.7.2. Malaysia Physical Security Market Size and Forecast, By Industry Vertical (2023-2030) 7.3.8. Vietnam 7.3.8.1. Vietnam Physical Security Market Size and Forecast, By Type (2023-2030) 7.3.8.2. Vietnam Physical Security Market Size and Forecast, By Industry Vertical (2023-2030) 7.3.9. Taiwan 7.3.9.1. Taiwan Physical Security Market Size and Forecast, By Type (2023-2030) 7.3.9.2. Taiwan Physical Security Market Size and Forecast, By Industry Vertical (2023-2030) 7.3.10. Rest of Asia Pacific 7.3.10.1. Rest of Asia Pacific Physical Security Market Size and Forecast, By Type (2023-2030) 7.3.10.2. Rest of Asia Pacific Physical Security Market Size and Forecast, By Industry Vertical (2023-2030) 8. Middle East and Africa Physical Security Market Size and Forecast by Segmentation (by Value in USD Million) (2023-2030 8.1. Middle East and Africa Physical Security Market Size and Forecast, By Type (2023-2030) 8.2. Middle East and Africa Physical Security Market Size and Forecast, By Industry Vertical (2023-2030) 8.3. Middle East and Africa Physical Security Market Size and Forecast, by Country (2023-2030) 8.3.1. South Africa 8.3.1.1. South Africa Physical Security Market Size and Forecast, By Type (2023-2030) 8.3.1.2. South Africa Physical Security Market Size and Forecast, By Industry Vertical (2023-2030) 8.3.2. GCC 8.3.2.1. GCC Physical Security Market Size and Forecast, By Type (2023-2030) 8.3.2.2. GCC Physical Security Market Size and Forecast, By Industry Vertical (2023-2030) 8.3.3. Nigeria 8.3.3.1. Nigeria Physical Security Market Size and Forecast, By Type (2023-2030) 8.3.3.2. Nigeria Physical Security Market Size and Forecast, By Industry Vertical (2023-2030) 8.3.4. Rest of ME&A 8.3.4.1. Rest of ME&A Physical Security Market Size and Forecast, By Type (2023-2030) 8.3.4.2. Rest of ME&A Physical Security Market Size and Forecast, By Industry Vertical (2023-2030) 9. South America Physical Security Market Size and Forecast by Segmentation (by Value in USD Million) (2023-2030) 9.1. South America Physical Security Market Size and Forecast, By Type (2023-2030) 9.2. South America Physical Security Market Size and Forecast, By Industry Vertical (2023-2030) 9.3. South America Physical Security Market Size and Forecast, by Country (2023-2030) 9.3.1. Brazil 9.3.1.1. Brazil Physical Security Market Size and Forecast, By Type (2023-2030) 9.3.1.2. Brazil Physical Security Market Size and Forecast, By Industry Vertical (2023-2030) 9.3.2. Argentina 9.3.2.1. Argentina Physical Security Market Size and Forecast, By Type (2023-2030) 9.3.2.2. Argentina Physical Security Market Size and Forecast, By Industry Vertical (2023-2030) 9.3.3. Rest Of South America 9.3.3.1. Rest Of South America Physical Security Market Size and Forecast, By Type (2023-2030) 9.3.3.2. Rest Of South America Physical Security Market Size and Forecast, By Industry Vertical (2023-2030) 10. Global Physical Security Market: Competitive Landscape 10.1. MMR Competition Matrix 10.2. Competitive Landscape 10.3. Key Players Benchmarking 10.3.1. Company Name 10.3.2. Service Segment 10.3.3. End-user Segment 10.3.4. Revenue (2023) 10.3.5. Company Locations 10.4. Leading Physical Security Market Companies, by Market Capitalization 10.5. Market Structure 10.5.1. Market Leaders 10.5.2. Market Followers 10.5.3. Emerging Players 10.6. Mergers and Acquisitions Details 11. Company Profile: Key Players 11.1. Anixter International Inc. 11.1.1. Company Overview 11.1.2. Business Portfolio 11.1.3. Financial Overview 11.1.4. SWOT Analysis 11.1.5. Strategic Analysis 11.1.6. Recent Developments 11.2. Tyco International PLC. 11.3. Cisco Systems, Inc. 11.4. Genetec Inc. 11.5. ADT Corporation 11.6. Honeywell International, Inc. 11.7. Bosch Security Systems, Inc. 11.8. Stanley Security 11.9. Senstar Corporation 11.10. Hikvision 11.11. Axis Communication 11.12. Pelco 11.13. Dahua Technology 11.14. Kastle Systems 11.15. SECOM 12. Key Findings 13. Industry Recommendations
  • INQUIRE BEFORE BUYING