
Global Lithium Niobate Market: Industry Structure Evaluation, Demand Drivers Analysis, Regional Growth Analysis and Identification, Competitive Positioning Review & Global Market Size Forecast to 2034
Overview
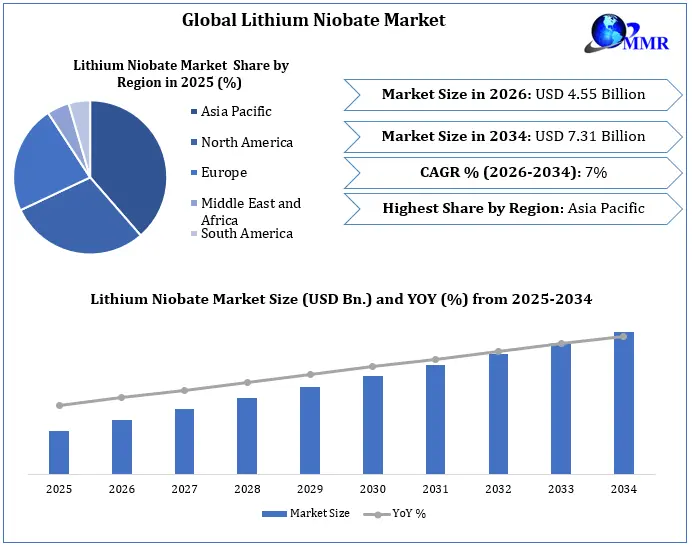
Global Lithium Niobate Market size was valued at USD 4.55 Billion in 2025, and the total revenue is expected to grow at a CAGR of 7% from 2025 to 2034, reaching nearly 7.31 Billion.
Lithium Niobate Market Overview
The Lithium Niobate industry covers the production of lithium niobate (LiNbO₃) crystals, optical-grade wafers, thin films, periodically poled lithium niobate (PPLN), and lithium-niobate-on-insulator (LNOI) substrates used across optical communications, electro-optic modulators, photonic integrated circuits, acoustic devices, sensing, frequency conversion, and quantum technologies. Asia-Pacific represents a major manufacturing and downstream application hub, supported by strong semiconductor, electronics, telecommunications, and photonics industries across China, Japan, South Korea, and Taiwan.
The wafer-scale single-crystal thin-film lithium niobate delivers more than a 10-fold improvement in optical confinement, waveguide bending radius, electro-optic efficiency, and nonlinear-optical efficiency compared with conventional lithium-niobate integrated optics. NIST also demonstrated lithium-niobate nanophotonic waveguides producing frequency-comb coverage from 330 nm to 2,400 nm using only 90 pJ of input pulse energy, demonstrating the material's potential for advanced photonic applications. Growing adoption of high-speed optical communications, integrated photonics, 5G/6G infrastructure, advanced sensing, frequency conversion, and quantum technologies, together with the transition from bulk crystals toward thin-film lithium niobate and LNOI platforms, supports Lithium Niobate Market growth.
Lithium Niobate Market Key Highlights
• Thin-film lithium niobate is progressing toward industrial-scale photonic integration. The European Commission-funded project is developing a complete LNOI photonic platform covering 150 mm optical-grade LNOI wafers, foundry fabrication, design software, and PIC packaging. The project received approximately USD 5.80 million in EU funding and targets applications across telecommunications, quantum technologies, microwave photonics, LiDAR, and sensing.
• Lithium niobate nanophotonics is expanding into broadband frequency conversion and precision optical systems. In a NIST demonstration, thin-film lithium-niobate waveguides generated continuous frequency-comb coverage from 330 nm to 2,400 nm using only 90 pJ of 1,550 nm input pulse energy, demonstrating strong potential for chip-integrated clocks, spectroscopy, frequency synthesis, and quantum/atomic systems.
• Thin-film lithium niobate is gaining commercial attention for next-generation optical modulators, particularly as data-center and telecommunications networks require higher bandwidth and lower-power optical interconnects. As an emerging competing technology for optical modulators, noting its high-speed modulation and bandwidth performance and potential deployment across both pluggable optical transceivers and advanced packaging architectures. This indicates increasing commercial relevance of lithium niobate beyond conventional bulk optical applications.
Lithium Niobate Market Size, Regional Share and Forecast
To know about the Research Methodology :- Request Free Sample Report
Lithium Niobate Market Trends
| Trend 1: Rising Integration of Photonic Circuits in Advanced Optical Systems
Growing adoption of photonic integrated circuits (PICs), which combine multiple optical functions on a single chip to support faster data transmission, lower power consumption, and compact optical systems. Rising investment in integrated photonics also supports technology development and commercialization. For instance, Infinera secured USD 93 million in funding in 2025, reflecting continued investment in advanced photonic technologies. As telecom, data centers, computing, and sensing applications increasingly shift toward integrated optical solutions, demand for lithium niobate-based modulators and photonic components continues to expand. |
| Trend 2: Increasing Need for SAW Filters in 5G-Enabled Consumer Devices
The growing adoption of 5G smartphones and connected consumer devices is increasing demand for SAW filters based on acoustic-grade lithium niobate. A typical 5G smartphone can incorporate around 40–100 SAW/BAW filters, compared with roughly 15–30 in a 4G device, as additional frequency bands require more RF filtering. With global smartphone shipments exceeding 1.2 billion units annually and 5G representing a growing share of shipments, demand for high-performance RF filters continues to support the use of lithium niobate wafers in consumer electronics. |

Lithium Niobate Market Dynamics
Lithium Niobate Market Driver
Expanding Adoption of Photonic Technologies Across Optical, Defence, and Quantum Applications
Global internet traffic continues to expand at double-digit rates, increasing the requirement for high-capacity optical networks and advanced electro-optic modulators capable of delivering high bandwidth, rapid data transmission, and low latency. Telecom operators are expanding fiber-optic transport, metro, and backhaul infrastructure to accommodate rising 5G and broadband traffic. This transition is visible in the deployment of terabit-scale optical backbone networks and the rollout of a nationwide 400G optical backbone in the UAE. The continued migration toward 400G and terabit-class transmission infrastructure strengthens demand for high-performance optical materials and modulation technologies, supporting the adoption of lithium niobate-based electro-optic components.
Expanding Deployment of High-Speed Optical Networks
The -speed optical communication networks require greater bandwidth, lower latency, and more efficient photonic components, drives Lithium Niobate Market growth. Lithium niobate’s strong electro-optic properties make it particularly suitable for advanced modulators and integrated photonic systems supporting next-generation data transmission. Growing investment in photonic technologies further strengthens this trend, highlighted by Lightmatter’s USD 400 million funding round in 2025, which supports the expansion of photonic computing and high-bandwidth optical interconnect technologies.
Lithium Niobate Market Restraints
Elevated Production Costs Constrain Large-Scale Adoption
Fluctuating prices of key raw materials such as cotton, polyester, and other textile fibers, along with transportation delays and geopolitical uncertainties, are increasing production costs for Lithium Niobate manufacturers. Cotton prices have experienced significant volatility due to weather conditions, supply-demand imbalances, and input cost changes, while the Lithium Niobate industry relies on a global supply chain spanning more than 150 countries, making manufacturers vulnerable to logistics disruptions, inventory challenges, and cost pressures.
Lithium Niobate Market Challenges
| Challenge | Impact on Lithium Niobate Market |
| High TFLN/LNOI Production Cost | Increases device costs and restricts adoption in high-volume applications |
| Complex Device Fabrication | Raises processing costs and increases production complexity |
| Photonic Integration Complexity | Increases development time and system-level manufacturing costs |
| Competition from Alternative Photonic Platforms | Creates technology substitution pressure in cost-sensitive applications |
| Long Qualification and Reliability Cycles | Extends commercialization timelines and slows adoption of new devices |
Lithium Niobate Market Value Chain Analysis

The Lithium Niobate value chain begins with sourcing and purification of lithium and niobium compounds, followed by LiNbO₃ single-crystal growth, slicing, polishing, and wafer production. Wafers are further processed into TFLN/LNOI substrates and fabricated into SAW filters, electro-optic modulators, waveguides, resonators, and photonic integrated devices. These components undergo packaging and system integration before deployment across 5G/RF electronics, optical communications, data centers, sensing, LiDAR, and quantum photonics.
Lithium Niobate Market Segment Analysis
Global Lithium Niobate Market by Form
Wafer holds the highest market share of 48.5% in the Lithium Niobate Market, supported by its extensive use in SAW filters, RF devices, electro-optic modulators, optical waveguides, and integrated photonic circuits. The growing shift toward thin-film lithium niobate (TFLN) and lithium-niobate-on-insulator (LNOI) further strengthens wafer demand for high-speed and compact photonic devices. Bulk Crystal / Ingot, driven by conventional optical and acoustic applications and its role as the primary material for wafer production. Powder primarily supports crystal synthesis and specialized material-processing applications, while Others include customized crystal blanks and specialized lithium niobate forms for niche optical, acoustic, and research applications.

Global Lithium Niobate Market by Crystal Type
Rotated Y-Cut Lithium Niobate held highest market share of 34.5% in 2025 for the Lithium Niobate Market, supported by its strong piezoelectric properties and extensive use in SAW filters, RF components, resonators, and wireless communication devices. X-Cut Lithium Niobate, driven by its growing utilization in electro-optic modulators, thin-film lithium niobate platforms, and integrated photonic circuits. Z-Cut Lithium Niobate remains important for nonlinear optics, frequency conversion, optical waveguides, and electro-optic applications. Y-Cut Lithium Niobate supports acoustic and specialized optical devices, while Others include application-specific and customized crystal orientations used in advanced photonic, sensing, and research applications.
Global Lithium Niobate Market by Application
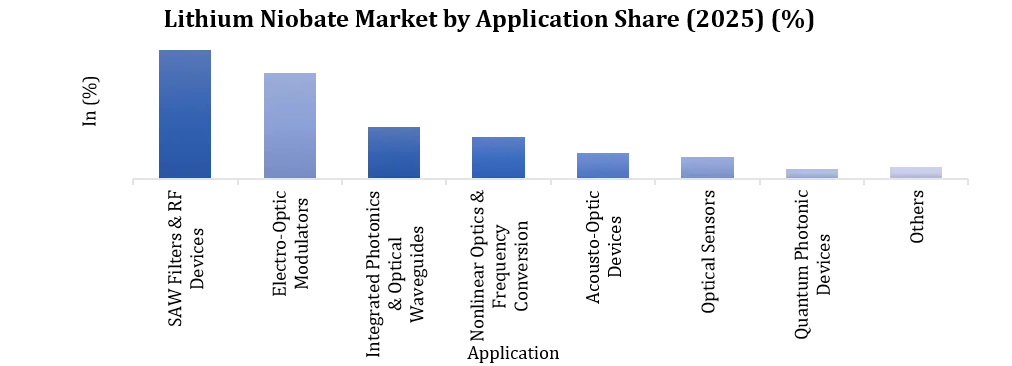
SAW Filters & RF Devices dominated the Lithium Niobate Market with a 32.5% share in 2025, supported by lithium niobate’s strong piezoelectric properties and extensive use in RF filters, resonators, smartphones, wireless communication systems, and 5G devices. Electro-Optic Modulators account for 26.5%, supported by increasing requirements for high-speed optical modulation across telecom and data transmission networks. Integrated Photonics & Optical Waveguides represent the fastest-growing application, as TFLN and LNOI platforms increasingly support compact, high-bandwidth, and energy-efficient photonic integrated circuits. Nonlinear Optics & Frequency Conversion benefit from strong nonlinear optical characteristics, while Acousto-Optic Devices, Optical Sensors, and Quantum Photonic Devices continue gaining adoption across precision sensing, spectroscopy, quantum communication, and advanced optical systems.
Global Lithium Niobate Market by End-Use
Telecommunications dominate the Lithium Niobate Market with a 35.5% share, supported by extensive use of lithium niobate in electro-optic modulators, SAW filters, RF components, fiber-optic networks, and high-speed optical transmission systems. Consumer Electronics, supported by the use of SAW-based components in smartphones, wearables, and other connected devices. Data Centers & Computing represent the fastest-growing end-use segment, as increasing bandwidth requirements, AI computing infrastructure, and optical interconnect deployment create demand for high-speed and energy-efficient photonic components. Industrial applications include precision sensing, laser systems, and instrumentation, while Aerospace & Defense, Healthcare & Medical, and Research & Quantum Technology continue adopting lithium niobate for advanced sensing, imaging, frequency conversion, quantum photonics, and specialized optical systems.
Lithium Niobate Market Opportunities by Region Analysis
Asia Pacific dominated the Lithium Cobalt Oxide (LCO) Market in 2025, supported by its concentration of battery-material processing, lithium-ion cell manufacturing, and consumer electronics production. China, Japan, and South Korea represent the core regional markets, with China playing a particularly important role in the global battery supply chain. According to the International Energy Agency (IEA), China accounted for around 80% of global battery cell production in 2024, while approximately 85% of global battery manufacturing capacity was located in China, creating a large downstream manufacturing base for cathode materials, including LCO.
Consumer electronics remain particularly important for lithium cobalt oxide demand, owing to LCO's high volumetric energy density and established use in smartphones, laptops, tablets, cameras, wearables, and other portable electronics. China produced approximately 1.67 billion mobile phones in 2024, according to China's Ministry of Industry and Information Technology, illustrating the scale of electronics manufacturing that supports regional demand for lithium-ion battery materials. At the same time, battery chemistry is shifting toward LFP and nickel-rich chemistries in electric vehicles, making portable electronics and compact high-energy-density batteries the more strategically important demand base for LCO. These factors reinforce Asia Pacific's position as the dominant production and consumption region for the Lithium Cobalt Oxide Market.
Lithium Niobate Market by Country Analysis
China represents the most important manufacturing hub for lithium cobalt oxide and other lithium-ion cathode materials, supported by its highly integrated battery-material and electronics supply chain. China accounted for more than 80% of global battery cell production and approximately 85% of global cathode active material production in 2025. This manufacturing concentration supports LCO demand for smartphones, laptops, tablets, wearables, and other compact rechargeable devices.
South Korea represents a major advanced cathode-material and lithium-ion battery manufacturing base, particularly for high-performance rechargeable batteries used across electronics and mobility applications. The IEA identifies South Korea as one of only two countries outside China, alongside Japan, with sizeable cathode active material production, making the country strategically important to diversification of the global cathode-material supply chain.
Japan remains an important high-quality lithium-ion battery and cathode-material production center, supported by established capabilities in advanced materials, battery cells, electronic components, and precision manufacturing. The IEA identifies Japan and South Korea as the only countries outside China with sizeable cathode active material production, reinforcing Japan's importance to the LCO and broader cathode-material ecosystem. Japan's METI continues to track battery and electronic-material production through its national Current Survey of Production.
The United States represents an important downstream consumption market for lithium-ion battery materials, particularly through consumer electronics, computing, communications, and expanding domestic battery manufacturing. However, the IEA reports that battery factories in the United States and Europe continue to import the majority of their battery components, primarily from China, highlighting substantial dependence on Asian cathode-material supply chains.
Lithium Niobate Market Competitive Landscape
Leading companies including Sumitomo Metal Mining Co., Ltd., Coherent Corp., CASTECH Inc., Exail (iXblue), Gooch & Housego, Raicol Crystals Ltd., HC Photonics, Oxide Corporation, Shin-Etsu Chemical Co., Ltd., and Covesion Ltd. continue to strengthen their positions across lithium niobate crystals, wafers, nonlinear optical components, electro-optic devices, periodically poled lithium niobate (PPLN), and advanced photonic solutions. Competitive strategies increasingly focus on high-purity crystal production, thin-film and wafer processing, precision optical fabrication, photonic iintegration, and higher-performance components for optical communications, RF devices, quantum photonics, sensing, and frequency-conversion applications. Investments in larger and higher-quality wafers, scalable photonic manufacturing, strategic partnerships, production optimization, and advanced lithium-niobate-based device technologies remain important competitive differentiators.

Lithium Niobate Market Recent Developments
In May 2025, Sumitomo Metal Mining Co., Ltd. unveiled its 3 Year Business Plan 2027, outlining total planned investments of around USD 2.74 billion, including USD 0.94 billion in growth investments and USD 1.51 billion in facility maintenance and upgrades, to expand advanced materials production, including lithium niobate/lithium tantalate wafers for SAW/RF and optical applications, alongside battery cathode materials.
In January 2025, Exail announced a major transformation of its production process for advanced modulation solutions, including its flagship lithium niobate electro optic modulator, to enable higher volume, industrial scale supply for telecom, sensing, and defense photonics markets.
In March 2025, Gooch & Housego (G&H) announced participation in the Thin Film Lithium Niobate (TFLN) Workshop at SPIE DCS 2025, with its crystal team presenting on the U.S. domestic lithium niobate supply chain and opportunities, signaling its strategic role in scaling TFLN crystal and component supply for defense and commercial photonic systems.
Lithium Niobate Market Scope: Inquire before buying
| Lithium Niobate Market | |||
|---|---|---|---|
| Report Coverage | Details | ||
| Base Year: | 2025 | Forecast Period: | 2026-2032 |
| Historical Data: | 2020 to 2025 | Market Size in 2025: | USD 4.55 Bn. |
| Forecast Period 2026 to 2032 CAGR: | 7% | Market Size in 2032: | USD 7.31 Bn. |
| Segments Covered: | by Form | Powder Bulk Crystal / Ingot Wafer Others |
|
| by Crystal Type | X-Cut Lithium Niobate Y-Cut Lithium Niobate Z-Cut Lithium Niobate Rotated Y-Cut Lithium Niobate Others |
||
| by Application | SAW Filters & RF Devices Electro-Optic Modulators Acousto-Optic Devices Integrated Photonics & Optical Waveguides Nonlinear Optics & Frequency Conversion Optical Sensors Quantum Photonic Devices Others |
||
| by End-Use | Telecommunications Consumer Electronics Data Centers & Computing Industrial Aerospace & Defense Healthcare & Medical Research & Quantum Technology Others |
||
Lithium Niobate Key Players Profiles Covered in the Report
1. Sumitomo Metal Mining Co., Ltd.
2. Coherent Corp.
3. CASTECH Inc.
4. Exail (iXblue)
5. Thorlabs Inc.
6. Gooch & Housego
7. Raicol Crystals Ltd.
8. Deltronic Crystal Industries
9. HC Photonics
10. EKSMA Optics
11. Altechna
12. Kojundo Chemical Laboratory
13. Jinan CRYSTAL Technology
14. Yamaju Ceramics
15. Roditi International
16. Oxide Corporation
17. Precision Micro-Optics
18. Red Optronics
19. JX Nippon Mining & Metals
20. Furukawa Electric
21. Shin-Etsu Chemical Co., Ltd.
22. Hilger Crystals
23. Saint-Gobain Crystals
24. United Crystals, Inc.
25. MTI Corporation
26. Nanoshel
27. Lambda Optics
28. Fujian Jingan Optoelectronics Co., Ltd.
29. Korth Kristalle GmbH
30. Crystal Technology, Inc.
31. Covesion Ltd.
32. Laser Components GmbH
33. Inrad Optics, Inc.
34. Sinocera Piezotronics, Inc.
35. Shanghai Daheng Optics and Fine Mechanics Co., Ltd.
36. Cristal Laser S.A.
37. AdvR, Inc.
38. Fujitsu Optical Components
Lithium Niobate Market Frequently Asked Questions
1. Which product type dominates the Lithium Niobate Market?
Optical-grade lithium niobate dominated in 2025, accounting for about 57.8%, supported by its extensive use in electro-optic modulators, photonic devices, lasers, and optical communication systems. SAW-grade lithium niobate represents another major category because of its use in RF and acoustic-wave components.
2. How rapidly is Thin-Film Lithium Niobate (TFLN) adoption increasing compared with conventional bulk lithium niobate?
TFLN is expanding considerably faster than conventional bulk technology. One 2025 assessment valued the TFLN modulator market at USD 20.38 million in 2024 and projects it to reach USD 1.51 billion by 2034, at a 46.86% CAGR, reflecting growing adoption in compact, high-bandwidth photonic integrated devices.
3. Which application generates the highest demand for lithium niobate?
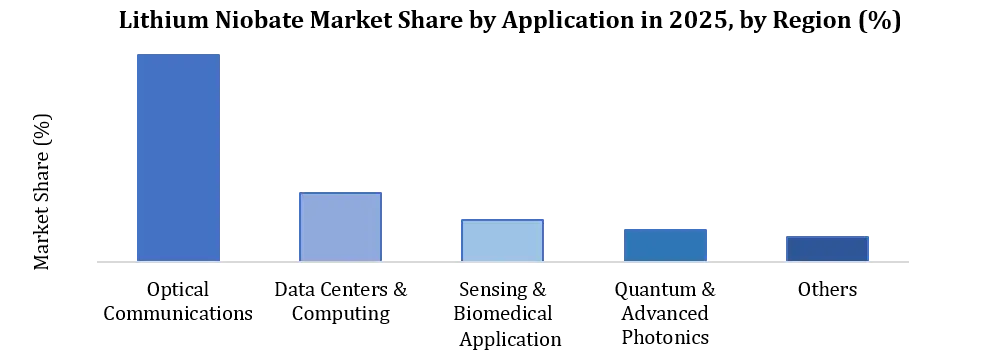
Optical modulators represented the leading application, accounting for about 43.1% in 2025, followed by SAW filters at around 31.0%. Demand is supported by lithium niobate's electro-optic properties and its established use in high-speed fiber-optic communication and data transmission.
4. How are 5G/6G networks, data centers, AI infrastructure, and high-speed optical communication influencing demand?
AI computing and expanding data-center capacity are accelerating the transition toward 800G and 1.6T optical transceivers, increasing requirements for high-bandwidth and energy-efficient electro-optic modulators. TFLN devices can deliver bandwidth exceeding 100 GHz, making the technology increasingly relevant to data-center interconnects, 5G fronthaul/midhaul, high-speed metro networks, and next-generation optical communications.
5. Which countries and regions have the largest lithium niobate production and consumption?
Asia Pacific is the leading regional market, accounting for roughly USD 349.6 million in 2025, followed by North America and Europe. China and Japan are particularly important to the lithium niobate value chain because of their established electronics, telecommunications, crystal/material, and photonics manufacturing ecosystems, while the United States and Europe remain important demand and innovation centers for integrated photonics, optical communications, aerospace, and quantum applications.