
Knowledge Graph Market – Industry Structure Evaluation, Demand Drivers Analysis, Regional Growth Analysis and Identification, Competitive Positioning Review & Global Market Size Forecast to 2034
Overview
The Knowledge Graph Market size was valued at USD 1.47 Billion in 2025 and the total Knowledge Graph revenue is expected to grow at a CAGR of 18.1 % from 2025 to 2034, reaching nearly USD 6.60 Billion.
A knowledge graph is a combination of business data in a graph and an explicit representation of knowledge. Businesses manage data so that they understand the connections between their customers, products or services, features, markets, and anything else that impacts the enterprise. A graph represents these connections directly allowing us to analyze and understand the relationships that drive business forward. Knowledge provides background information such as what kinds of things are important to the company and how they relate to one another. An explicit representation of business knowledge allows different data sets to share a common reference. A knowledge graph combines the business data and the business knowledge to provide a more complete and integrated experience with the organization’s data.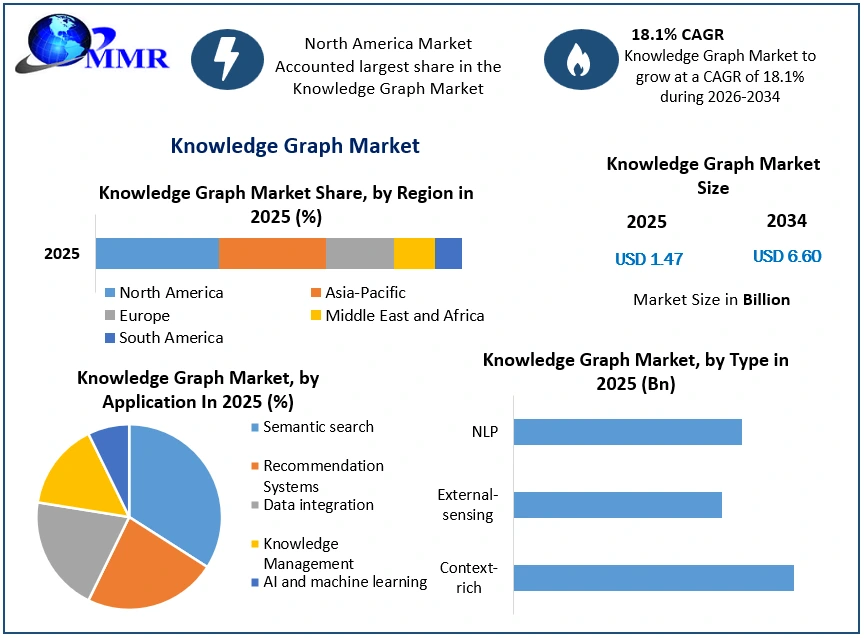
To know about the Research Methodology :- Request Free Sample Report
The growing significance of structured data and the growing use of knowledge graphs across many industries will determine the direction of the Knowledge Graph Market. The Market is driven by increasingly harnessing these tools, which stand as indispensable elements in organizational data strategies, facilitating valuable insights and unlocking the full potential of data in the pursuit of informed decision-making. The knowledge graph industry is poised for sustained growth as businesses recognize its significant role in data management, decision-making, and innovation. The rise in knowledge graph market integration within enterprise applications is evident, with increased demand across diverse sectors such as healthcare, finance, and retail. Innovations like graph databases and neural networks mark technological strides. Open-source knowledge graph platforms are on the rise, accompanied by a growing emphasis on security and privacy considerations.
Knowledge Graph Market Dynamics:
Increasing need for data integration and analytics.
The increasing need for data integration and analytics is expected to be a key trend in the Knowledge Graph market. The data becomes an increasingly integral part of organizational processes and the need for effective data integration and analytics is paramount. Data integration involves consolidating information from diverse sources into a unified coherent view streamlining the often intricate task of managing varied data formats, sources, and qualities. The analytics on the other hand empowers organizations to derive meaningful insights from this amalgamated data through methods such as statistical analysis and machine learning. The advantages of embracing data integration and analytics are multifaceted. Improved decision-making, heightened efficiency, and a competitive edge are notable benefits. However, challenges such as ensuring data quality, safeguarding against security threats, and establishing robust data governance frameworks persist.
In addition, the future of data integration and analytics is characterized by the growing importance of real-time data analysis, the integration of artificial intelligence and machine learning for automation, and the expanding influence of cloud computing, making these tools more accessible for organizations of all sizes. Leveraging these trends, organizations not only enhance decision-making and efficiency but also identify and mitigate risks, improve customer satisfaction, and ensure regulatory compliance. In a data-driven landscape, the effective utilization of data integration and analytics is crucial for organizational success.
The integration of AI and machine learning is a transformative trend for the knowledge graph market.
The integration of AI and machine learning is expected to be a key trend in the Knowledge Graph market. These tools drive this market to unprecedented heights. Also, automation AI and ML streamline the construction and maintenance of knowledge graphs extracting entities and relationships from unstructured data. This integration empowers knowledge graphs to reason and infer predicting missing links and detecting anomalies. Various applications benefit, including recommendation systems, fraud detection, and knowledge-driven decision support. Integration approaches range from embedding AI/ML algorithms into knowledge graph platforms to developing models designed for knowledge graph collaboration. The benefits encompass enhanced construction, more potent reasoning, and intelligent applications. Future directions involve refining algorithms, exploring new integration approaches, and improving model interpretability, ensuring a continued evolution in this dynamic field. As AI and ML progress, their integration with knowledge graphs promises even greater innovation and widespread adoption across industries.
Challenges in the Knowledge Graph Market: Technical, Organizational, and Societal Dimensions.
Knowledge Acquisition and Extraction involves the challenge of collecting and extracting information from diverse sources, facing difficulties with natural language nuances and data format inconsistencies. Knowledge Representation and Integration are significant for unifying information into a consistent knowledge graph, addressing semantic ambiguities, and aligning different ontologies. Also, Validation and Reasoning are essential for ensuring accuracy, consistency, and completeness in the knowledge graph and require further development in fact-checking and uncertainty management. Scalability and Performance challenges emerge due to the rapid growth of knowledge graphs, demanding scalable algorithms and distributed processing techniques. In addition, organizational Challenges involve establishing data governance policies, defining ownership structures, and managing data quality throughout the knowledge graph lifecycle. Maintenance and Evolution, integration with existing systems, trust, transparency, and addressing bias are critical for successful implementation.
In addition, societal challenges include ensuring privacy, addressing ethical considerations, and fostering trust. Detecting and mitigating biases, adhering to privacy regulations, and providing explanations for knowledge graph-driven decisions are essential for societal acceptance.
Knowledge Graph Market Segment Analysis:
Based on Application, the semantic search Knowledge Graph segment held the largest market share of more than 29% and dominated the global Knowledge Graph market in 2025. The segment is further expected to grow at a CAGR of 11.45% and maintain its dominance during the forecast period. Semantic search increases search accuracy by deciphering word meanings for more relevant results. Utilizing knowledge graphs it employs a structured representation of knowledge to discern relationships between entities. This approach goes beyond keyword matching, considering context and intent, and delivering search outcomes aligned with user expectations. Semantic search, driven by the power of understanding language nuances, revolutionizes information retrieval, offering a more intuitive and precise search experience.
Recommendation systems leverage knowledge graphs to deliver personalized suggestions for products, services, and content. By mapping relationships between users, items, and various entities, knowledge graphs enable tailored recommendations aligned with individual user interests and preferences. This approach enhances user experience, increasing the likelihood of user engagement and satisfaction by providing relevant and appealing suggestions based on a comprehensive understanding of user preferences within a network of interconnected data. Also, knowledge graphs facilitate seamless data integration across diverse sources, streamlining accessibility and analysis for businesses. Serving as a common language for representing entities and relationships, knowledge graphs play a crucial role in dismantling data silos. By fostering a unified framework, they simplify data sharing among different departments and organizations. This integration not only enhances collaboration but also empowers businesses with a holistic view, enabling informed decision-making and optimizing processes. Knowledge graphs act as a unifying force, promoting interoperability and efficiency in handling the expanding landscape of data within an organization.
Additionally, Knowledge graphs serve as invaluable tools for managing and sharing knowledge within organizations. They efficiently store and organize information, providing a structured framework for easy retrieval, comprehension, and knowledge utilization. By offering a cohesive structure, knowledge graphs simplify the process of locating relevant information, fostering a culture of efficient knowledge exchange within the organization. This organized approach enhances workflow, promotes collaboration, and ensures that valuable insights are readily available, contributing to informed decision-making and overall productivity. Knowledge graphs thus play a pivotal role in optimizing internal knowledge management processes and facilitating a smoother exchange of information among team members.
In addition, Knowledge graphs play a crucial role in training and developing AI and machine learning models by offering a structured representation of knowledge. This structured knowledge enables models to make more accurate predictions and decisions. By mapping relationships between entities, knowledge graphs provide a contextual foundation, enhancing the understanding and learning capabilities of AI systems. This structured information aids in extracting meaningful insights, fostering improved model accuracy and efficiency. Leveraging knowledge graphs in AI and machine learning endeavors contributes to the development of more robust and informed algorithms, facilitating advancements in predictive capabilities and decision-making processes.
Knowledge Graph Market Regional Insights:
North America led the global Knowledge Graph market with the highest market share of 35% in 2025. The region is further expected to grow at a CAGR of 8.7 % and maintain its dominance throughout the forecast period. The North American Knowledge Graph Market is experiencing robust growth fueled by increasing demand across diverse sectors such as healthcare, finance, and retail. The United States leads the region, with Canada and Mexico following suit. Key trends include the rising adoption of scalable, cloud-based knowledge graph solutions and a rise in demand for context-rich graphs providing comprehensive entity and relationship information. These graphs find applications in cutting-edge technologies such as chatbots and recommendation engines. The competitive landscape is dynamic, featuring established players such as Google, IBM, Oracle, and SAS. North America's dominant market position is attributed to its robust economy and advanced technology adoption. Anticipated continued growth is underlined by these trends indicating a rising future for the Knowledge Graph Market in North America.
The increasing growth of the United States in the Knowledge Graph Market is driven by diverse factors such as the rising demand across industries like healthcare, finance, and retail. Cloud-based solutions are gaining prominence due to scalability, user-friendly interfaces, and cost-effectiveness. Key trends involve the rise of context-rich knowledge graphs catering to enhanced search accuracy and insightful recommendations, driving applications like chatbots and fraud detection systems. The U.S. market, fiercely competitive, sees major players like Google, IBM, Oracle, and SAS offering a spectrum of knowledge graph solutions. With the nation's maturity in this sector, sustained growth is anticipated, spurred by big data adoption, personalized experiences, and advancements in machine learning and artificial intelligence.
Canada is the second-largest market for knowledge graphs in North America. This growth is underpinned by increased demand across diverse sectors, including healthcare, finance, and technology. key drivers include the increasing adoption of cloud-based knowledge graph solutions and the integration of these graphs into novel applications such as chatbots and recommendation engines. Canada's competitive landscape features prominent players such as Google, IBM, Oracle, and SAS, offering diverse knowledge graph solutions. The market's maturity, coupled with the increasing embrace of big data, personalized experiences, and emerging technologies, positions the Canadian Knowledge Graph Market for sustained growth in the foreseeable future.
Knowledge Graph Market Recent Industry Development
| Date | Company / Organization | Development | Impact |
|---|---|---|---|
| 07 May 2025 | Neo4j | The company launched Aura Graph Analytics, a serverless, fully managed graph analytics platform designed to simplify large-scale graph discovery across cloud ecosystems. | The deployment eliminates infrastructure management constraints, enabling researchers to run complex graph algorithms with 75% less code compared to self-managed architectures. |
| 04 September 2025 | Neo4j | The company unveiled Infinigraph, a next-generation distributed graph architecture capable of running concurrent transactional and analytical workloads. | The breakthrough architecture natively handles 100TB+ datasets without compromising performance, completely eliminating the need for expensive and redundant ETL pipelines. |
| 15 October 2025 | Graphwise | The company officially commercially launched its unified Graph AI Suite to streamline enterprise-grade semantic layer management. | The software integrates modeling tools and database engines to build hallucination-free GraphRAG architectures that preserve deep semantic data context. |
| 25 March 2026 | Digital Science | The enterprise technology firm finalized the acquisition of Ontopic, an open-source pioneer specialized in Virtual Knowledge Graph technology. | Integrating Ontopic Studio into the existing portfolio enables organizations to build dynamic semantic models without undergoing costly data transformation and duplication pipelines. |
| 03 June 2026 | Neo4j | The analytics provider reached an agreement to acquire intelligence analysis software developer GraphAware. | This acquisition expands open-standard alternatives for government sector threat-detection ecosystems and forms a vital pillar of the company's $100 million AI investment road map. |
Competitive Landscapes:
The Global Knowledge Graph market is expected to be highly competitive active presence of numerous market players. Major companies are striving to introduce cost-efficient and advanced implant-focused products to meet the increasing demand, consequently fostering overall market growth. Key players are adopting various business strategies, including technical partnerships and mergers and acquisitions (M&A) to remain competitive in the Knowledge graph market. For instance,
In February 2023, IBM acquired StepZen, which developed a GraphQL server with a unique architecture that helps developers build GraphQL APIs quickly and with less code. StepZen was also designed to be highly flexible. It is compatible with other API approaches and is available Software-as-a-Service (SaaS) while supporting deployments in private clouds and on-premises data centers.
In May 2023, Accenture made a strategic investment through Accenture Ventures in Stardog, a leading enterprise knowledge graph platform enabling organizations to do more with and achieve greater value from their data in this age of generative artificial intelligence (AI). Stardog Enterprise Knowledge Graphs, with their ability to make real-world context machine-understandable, are used by companies to facilitate better enterprise data integration and unification. Instead of integrating data by combining tables, data is unified using a knowledge graph's ability to endlessly link concepts without changing the underlying data.
These strategic endeavors underscore the Fresh Vegetables industry's commitment to diversifying product lines, innovating within segments, and adopting strategic partnerships to compete effectively in the market landscape. As consumer preferences evolve, these proactive strategies position Fresh vegetable manufacturers for sustained growth and competitiveness in the dairy market.
Knowledge Graph Market Scope: Inquire Before Buying
| Global Knowledge Graph Market | |||
|---|---|---|---|
| Report Coverage | Details | ||
| Base Year: | 2025 | Forecast Period: | 2026-2034 |
| Historical Data: | 2020 to 2025 | Market Size in 2025: | USD 1.47 Bn. |
| Forecast Period 2026 to 2034 CAGR: | 18.1% | Market Size in 2034: | USD 6.60 Bn. |
| Segments Covered: | by Type | Context-rich External-sensing NLP |
|
| by Task Type | Link prediction Entity Resolution Link-based Clustering |
||
| by Application | Semantic search Recommendation Systems Data integration Knowledge Management AI and machine learning |
||
| by End-User | Healthcare E-commerce& retail BFSI Government Manufacturing Transportation & logistics Others |
||
Knowledge Graph Market by Region:
North America (United States, Canada, and Mexico)
Europe (UK, France, Germany, Italy, Spain, Sweden, Austria, and the Rest of Europe)
Asia Pacific (China, South Korea, Japan, India, Australia, Indonesia, Malaysia, Vietnam, Taiwan, Bangladesh, Pakistan, and the Rest of APAC)
Middle East and Africa (South Africa, GCC, Egypt, Nigeria, and the Rest of ME&A)
South America (Brazil, Argentina Rest of South America)
Knowledge Graph Market manufactures:
1. Amazon.com Inc.
2. Baidu, Inc.
3. Facebook Inc
4. Google LLC
5. Microsoft Corporation
6. Mitsubishi Electric Corporation
7. NELL
8. Semantic Web Company
9. YAGO
10. Yandex
11. AWS
12. Cambridge Semantics
13. Franz Inc.
14. IBM Corporation
15. Neo4j
16. Ontotext
17. Oracle
18. PoolParty
19. Stardog
FAQs:
1. What are the growth drivers for the Knowledge Graph market?
Ans. The increasing need for data integration and analytics is expected to be the major driver for the Knowledge Graph market.
2. What is the major restraint on the Knowledge Graph market growth?
Ans. Detecting and mitigating biases, adhering to privacy regulations, and providing explanations for knowledge graph-driven decisions are essential for societal acceptance. are expected to be the major restraining factors for the Knowledge Graph market growth.
3. Which region is expected to lead the global Knowledge Graph market during the forecast period?
Ans. North America is expected to lead the global Knowledge Graph market during the forecast period.
4. What is the projected market size & and growth rate of the Knowledge Graph Market?
Ans. The Knowledge Graph Market size was valued at USD 1.47 Billion in 2025 and the total Knowledge Graph revenue is expected to grow at a CAGR of 18.19 % from 2025 to 2034, reaching nearly USD 6.60 Billion.
5. What segments are covered in the Knowledge Graph Market report?
Ans. The segments covered in the Knowledge Graph market report are Type, Task Type, Application, End-user, and Region.