Spoil Detection Based Smart Label Market – Industry Analysis and Forecast (2023-2029) – by Type, Application, and by Geography.

Spoil Detection Based Smart Label Market Was valued at US$ 1.54 Bn in 2022 and is expected to reach US$ 4.29 Bn by 2029 at a CAGR of 15.69 % during the forecast period.

Spoil Detection Based Smart Label Market Dynamics

The global market for spoil detection-based smart labels is rapidly growing and is expected to witness robust growth during the forecast period 2023-2029. Spoil detection-based smart labels detect the exact freshness of products and help the entire process of monitoring the product spoilage in real time. They also help to monitor and measure the factors like temperature, pH, moisture, and microbial growth to mention the basic ones. This strong trait is an important factor influencing the overall growth of the market.Spoil Detection Based Smart Label Market
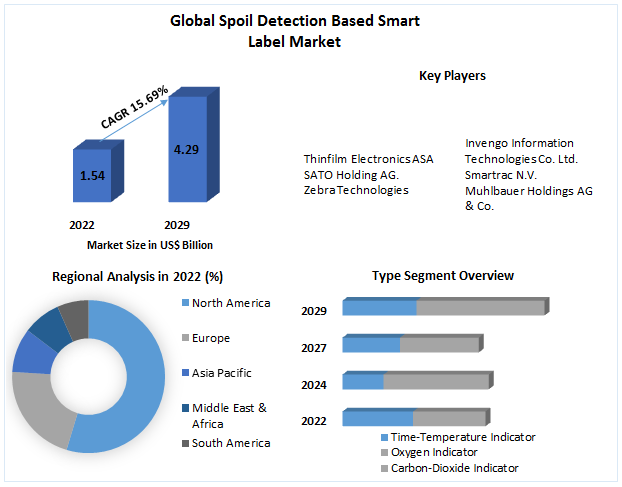
To know about the Research Methodology:-Request Free Sample Report There are various factors present in the market which are driving or restraining the growth of spoil detection based smart labels. The ability of runtime detection of the degree of freshness of food material and increased customer preference for the hygiene of food material is driving the spoil detection-based smart label industry. However, the lack of uniform standards and form factor of the label are hindering the growth of this market. Spoil detection-based smart label market has opportunities in supply chain management of food and pharmaceutical industry. In addition, integration of sensors in these labels can improve the market penetration of spoil detection based smart labels in various industry verticals such as healthcare, automotive and chemical.

Spoil Detection Based Smart Label Market Segment Analysis

The time-temperature indicator segment holds the largest market share of overall spoil detection base smart label market and is projected to remain leading over the forecast period of 2023 to 2029. Though, the drift of assimilating sensors such as RFID with spoil detection based smart labels is likely to be introduced in the market in the coming years. This integration will lead to the usage of spoil detection based smart labels in supply chain management, to manage the distribution and supply of food materials.

Spoil Detection Based Smart Label Market Regional Insights

North America is projected to hold the largest market share during the forecast period, which is then followed by Europe and the Asia Pacific excluding Japan. This is because of increasing customer liking for hygienic food material and supportive customs by the Food and Drug Administration (FDA) and the U.S. Department of Agriculture (USDA) to reduce the wastage of food due to contamination of food material during distribution is expected to the increasing market in North America, and it is estimated to grow at the highest CAGR. The Asia Pacific excluding Japan is projected to witness significant growth opportunity over the forecast period. During the forecast period, increasing demand for packaged food products and rising consumer awareness about packaged food safety are likely to dramatically reinforce the growth of spoil detection based smart labels in the APEJ region. The changing aspects of spoil detection-based smart label industry are dependent upon various factors like regional governing body's policies, consumer awareness, and industry players' offerings. The government policies are essential and have a significant impact on spoil detection-based smart label industry. The increased consumer preference for hygienic foods is also one of the crucial driving factors for this industry. The supply chain industry offerings opportunities for spoil detection-based smart label market. The objective of the report is to present a comprehensive assessment of the market and contains thoughtful insights, facts, historical data, industry-validated market data, and projections with a suitable set of assumptions and methodology. The report also helps in understanding dynamics, structure by analyzing the market segments by type, service, components, and region and, projects the global market size. The report also provides a clear representation of competitive analysis of key players by product, price, financial position, product portfolio, growth strategies, and regional presence in the spoil detection based smart label market. The report also provides PEST analysis, PORTER’s analysis, SWOT analysis to address the question of shareholders in arranging the efforts and investment in the near future to a particular market segment.

Spoil Detection Based Smart Label Market, Key Highlights:

• Global Spoil Detection Based Smart Label Market analysis and forecast, in terms of value. • Comprehensive study and analysis of market drivers, restraints and opportunities influencing the growth of the Global Spoil Detection Based Smart Label Market • Global Spoil Detection Based Smart Label Market segmentation on the basis of type, source, end-user, and region (country-wise) has been provided. • Global Spoil Detection Based Smart Label Market strategic analysis with respect to individual growth trends, future prospects along with the contribution of various sub-market stakeholders have been considered under the scope of study. • Global Spoil Detection Based Smart Label Market analysis and forecast for five major regions namely North America, Europe, Asia Pacific, the Middle East & Africa (MEA) and Latin America along with country-wise segmentation. • Profiles of key industry players, their strategic perspective, market positioning and analysis of core competencies are further profiled. • Competitive developments, investments, strategic expansion and competitive landscape of the key players operating in the Global Spoil Detection Based Smart Label Market are also profiled.

Spoil Detection Based Smart Label Market Scope:Inquire before buying

Global Spoil Detection Based Smart Label Market
Report Coverage Details
Base Year: 2022 Forecast Period: 2023-2029
Historical Data: 2017 to 2022 Market Size in 2022: US $ 1.54 Bn.
Forecast Period 2023 to 2029 CAGR: 15.69% Market Size in 2029: US $ 4.29 Bn.
Segments Covered: by Type • Time-Temperature Indicator • Oxygen Indicator • Carbon-Dioxide Indicator
by Application • Fish • Meat • Vegetables • Dairy Products • Processed Foods • Others

Spoil Detection Based Smart Label Market, by Region

North America (United States, Canada and Mexico) • Europe (UK, France, Germany, Italy, Spain, Sweden, Austria and Rest of Europe) • Asia Pacific (China, South Korea, Japan, India, Australia, Indonesia, Malaysia, Vietnam, Taiwan, Bangladesh, Pakistan and Rest of APAC) • Middle East and Africa (South Africa, GCC, Egypt, Nigeria and Rest of ME&A) • South America (Brazil, Argentina Rest of South America)

Spoil Detection Based Smart Label Market Key players

• Thinfilm Electronics ASA • SATO Holding AG. • Zebra Technologies • Invengo Information Technologies Co. Ltd. • Smartrac N.V. • Muhlbauer Holdings AG & Co. Frequently Asked Questions: 1. Which region has the largest share in Global Spoil Detection Based Smart Label Market? Ans: North America region held the highest share in 2022. 2. What is the growth rate of Global Spoil Detection Based Smart Label Market? Ans: The Global Spoil Detection Based Smart Label Market is growing at a CAGR of 15.69% during forecasting period 2023-2029. 3. What is scope of the Global Spoil Detection Based Smart Label Market report? Ans: Global Spoil Detection Based Smart Label Market report helps with the PESTEL, PORTER, COVID-19 Impact analysis, Recommendations for Investors & Leaders, and market estimation of the forecast period. 4. Who are the key players in Global Spoil Detection Based Smart Label Market? Ans: The important key players in the Global Spoil Detection Based Smart Label Market are – Thinfilm Electronics ASA, SATO Holding AG., Zebra Technologies, Invengo Information Technologies Co. Ltd., Smartrac N.V., and Muhlbauer Holdings AG & Co. 5. What is the study period of this Market? Ans: The Global Spoil Detection Based Smart Label Market is studied from 2022 to 2029.

Global Spoil Detection Based Smart Label Market

1. Preface 1.1. Report Scope and Market Segmentation 1.2. Research Highlights 1.3. Research Objectives 2. Assumptions and Research Methodology 2.1. Report Assumptions 2.2. Abbreviations 2.3. Research Methodology 2.3.1. Secondary Research 2.3.1.1. Secondary data 2.3.1.2. Secondary Sources 2.3.2. Primary Research 2.3.2.1. Data from Primary Sources 2.3.2.2. Breakdown of Primary Sources 3. Executive Summary: Global Spoil Detection Based Smart Label Market, by Market Value (US$ Bn) and Volume(Ton) 4. Market Overview 4.1. Introduction 4.2. Market Indicator 4.2.1. Drivers 4.2.2. Restraints 4.2.3. Opportunities 4.2.4. Challenges 4.3. Porter’s Analysis 4.4. Value Chain Analysis 4.5. Market Risk Analysis 4.6. SWOT Analysis 4.7. Global Spoil Detection Based Smart Label Market Industry Trends 4.8. Global Spoil Detection Based Smart Label Market Competitive Landscape 5. Supply Side and Demand Side Indicators 6. Global Spoil Detection Based Smart Label Market Analysis and Forecast 6.1. Global Spoil Detection Based Smart Label Market Size & Y-o-Y Growth Analysis 6.1.1. North America 6.1.2. Europe 6.1.3. Asia Pacific 6.1.4. Middle East & Africa 6.1.5. South America 7. Global Spoil Detection Based Smart Label Market Analysis and Forecast, by Type 7.1. Introduction and Definition 7.2. Key Findings 7.3. Global Spoil Detection Based Smart Label Market Value Share Analysis, by Type 7.4. Global Spoil Detection Based Smart Label Market Size (US$ Bn) Forecast, by Type 7.5. Global Spoil Detection Based Smart Label Market Analysis, by Type 7.6. Global Spoil Detection Based Smart Label Market Attractiveness Analysis, by Type 8. Global Spoil Detection Based Smart Label Market Analysis and Forecast, by Application 8.1. Introduction and Definition 8.2. Key Findings 8.3. Global Spoil Detection Based Smart Label Market Value Share Analysis, by Application 8.4. Global Spoil Detection Based Smart Label Market Size (US$ Bn) Forecast, by Application 8.5. Global Spoil Detection Based Smart Label Market Analysis, by Application 8.6. Global Spoil Detection Based Smart Label Market Attractiveness Analysis, by Application 9. Global Spoil Detection Based Smart Label Market Analysis, by Region 9.1. Global Spoil Detection Based Smart Label Market Value Share Analysis, by Region 9.2. Global Spoil Detection Based Smart Label Market Size (US$ Bn) Forecast, by Region 9.3. Global Spoil Detection Based Smart Label Market Attractiveness Analysis, by Region 10. North America Spoil Detection Based Smart Label Market Analysis 10.1. Key Findings 10.2. North America Spoil Detection Based Smart Label Market Overview 10.3. North America Spoil Detection Based Smart Label Market Value Share Analysis, by Type 10.4. North America Spoil Detection Based Smart Label Market Forecast, by Type 10.4.1. Time-Temperature Indicator 10.4.2. Oxygen Indicator 10.4.3. Carbon-Dioxide Indicator 10.5. North America Spoil Detection Based Smart Label Market Value Share Analysis, by Application 10.6. North America Spoil Detection Based Smart Label Market Forecast, by Application 10.6.1. Fish 10.6.2. Meat 10.6.3. Vegetables 10.6.4. Dairy Products 10.6.5. Processed Foods 10.6.6. Others 10.7. North America Spoil Detection Based Smart Label Market Value Share Analysis, by Country 10.8. North America Spoil Detection Based Smart Label Market Forecast, by Country 10.8.1. U.S. 10.8.2. Canada 10.9. North America Spoil Detection Based Smart Label Market Analysis, by Country 10.10. U.S. Spoil Detection Based Smart Label Market Forecast, by Type 10.10.1. Time-Temperature Indicator 10.10.2. Oxygen Indicator 10.10.3. Carbon-Dioxide Indicator 10.11. U.S. Spoil Detection Based Smart Label Market Forecast, by Application 10.11.1. Fish 10.11.2. Meat 10.11.3. Vegetables 10.11.4. Dairy Products 10.11.5. Processed Foods 10.11.6. Others 10.12. Canada Spoil Detection Based Smart Label Market Forecast, by Type 10.12.1. Time-Temperature Indicator 10.12.2. Oxygen Indicator 10.12.3. Carbon-Dioxide Indicator 10.13. Canada Spoil Detection Based Smart Label Market Forecast, by Application 10.13.1. Fish 10.13.2. Meat 10.13.3. Vegetables 10.13.4. Dairy Products 10.13.5. Processed Foods 10.13.6. Others 10.14. North America Spoil Detection Based Smart Label Market Attractiveness Analysis 10.14.1. By Type 10.14.2. By Application 10.15. PEST Analysis 10.16. Key Trends 10.17. Key Development 11. Europe Spoil Detection Based Smart Label Market Analysis 11.1. Key Findings 11.2. Europe Spoil Detection Based Smart Label Market Overview 11.3. Europe Spoil Detection Based Smart Label Market Value Share Analysis, by Type 11.4. Europe Spoil Detection Based Smart Label Market Forecast, by Type 11.4.1. Time-Temperature Indicator 11.4.2. Oxygen Indicator 11.4.3. Carbon-Dioxide Indicator 11.5. Europe Spoil Detection Based Smart Label Market Value Share Analysis, by Application 11.6. Europe Spoil Detection Based Smart Label Market Forecast, by Application 11.6.1. Fish 11.6.2. Meat 11.6.3. Vegetables 11.6.4. Dairy Products 11.6.5. Processed Foods 11.6.6. Others 11.7. Europe Spoil Detection Based Smart Label Market Value Share Analysis, by Country 11.8. Europe Spoil Detection Based Smart Label Market Forecast, by Country 11.8.1. Germany 11.8.2. U.K. 11.8.3. France 11.8.4. Italy 11.8.5. Spain 11.8.6. Rest of Europe 11.9. Europe Spoil Detection Based Smart Label Market Analysis, by Country 11.10. Germany Spoil Detection Based Smart Label Market Forecast, by Type 11.10.1. Time-Temperature Indicator 11.10.2. Oxygen Indicator 11.10.3. Carbon-Dioxide Indicator 11.11. Germany Spoil Detection Based Smart Label Market Forecast, by Application 11.11.1. Fish 11.11.2. Meat 11.11.3. Vegetables 11.11.4. Dairy Products 11.11.5. Processed Foods 11.11.6. Others 11.12. U.K. Spoil Detection Based Smart Label Market Forecast, by Type 11.12.1. Time-Temperature Indicator 11.12.2. Oxygen Indicator 11.12.3. Carbon-Dioxide Indicator 11.13. U.K. Spoil Detection Based Smart Label Market Forecast, by Application 11.13.1. Fish 11.13.2. Meat 11.13.3. Vegetables 11.13.4. Dairy Products 11.13.5. Processed Foods 11.13.6. Others 11.14. France Spoil Detection Based Smart Label Market Forecast, by Type 11.14.1. Time-Temperature Indicator 11.14.2. Oxygen Indicator 11.14.3. Carbon-Dioxide Indicator 11.15. France Spoil Detection Based Smart Label Market Forecast, by Application 11.15.1. Fish 11.15.2. Meat 11.15.3. Vegetables 11.15.4. Dairy Products 11.15.5. Processed Foods 11.15.6. Others 11.16. Italy Spoil Detection Based Smart Label Market Forecast, by Type 11.16.1. Time-Temperature Indicator 11.16.2. Oxygen Indicator 11.16.3. Carbon-Dioxide Indicator 11.17. Italy Spoil Detection Based Smart Label Market Forecast, by Application 11.17.1. Fish 11.17.2. Meat 11.17.3. Vegetables 11.17.4. Dairy Products 11.17.5. Processed Foods 11.17.6. Others 11.18. Spain Spoil Detection Based Smart Label Market Forecast, by Type 11.18.1. Time-Temperature Indicator 11.18.2. Oxygen Indicator 11.18.3. Carbon-Dioxide Indicator 11.19. Spain Spoil Detection Based Smart Label Market Forecast, by Application 11.19.1. Fish 11.19.2. Meat 11.19.3. Vegetables 11.19.4. Dairy Products 11.19.5. Processed Foods 11.19.6. Others 11.20. Rest of Europe Spoil Detection Based Smart Label Market Forecast, by Type 11.20.1. Time-Temperature Indicator 11.20.2. Oxygen Indicator 11.20.3. Carbon-Dioxide Indicator 11.21. Rest of Europe Spoil Detection Based Smart Label Market Forecast, by Application 11.21.1. Fish 11.21.2. Meat 11.21.3. Vegetables 11.21.4. Dairy Products 11.21.5. Processed Foods 11.21.6. Others 11.22. Europe Spoil Detection Based Smart Label Market Attractiveness Analysis 11.22.1. By Type 11.22.2. By Application 11.23. PEST Analysis 11.24. Key Trends 11.25. Key Development 12. Asia Pacific Spoil Detection Based Smart Label Market Analysis 12.1. Key Findings 12.2. Asia Pacific Spoil Detection Based Smart Label Market Overview 12.3. Asia Pacific Spoil Detection Based Smart Label Market Value Share Analysis, by Type 12.4. Asia Pacific Spoil Detection Based Smart Label Market Forecast, by Type 12.4.1. Time-Temperature Indicator 12.4.2. Oxygen Indicator 12.4.3. Carbon-Dioxide Indicator 12.5. Asia Pacific Spoil Detection Based Smart Label Market Value Share Analysis, by Application 12.6. Asia Pacific Spoil Detection Based Smart Label Market Forecast, by Application 12.6.1. Fish 12.6.2. Meat 12.6.3. Vegetables 12.6.4. Dairy Products 12.6.5. Processed Foods 12.6.6. Others 12.7. Asia Pacific Spoil Detection Based Smart Label Market Value Share Analysis, by Country 12.8. Asia Pacific Spoil Detection Based Smart Label Market Forecast, by Country 12.8.1. China 12.8.2. India 12.8.3. Japan 12.8.4. ASEAN 12.8.5. Rest of Asia Pacific 12.9. Asia Pacific Spoil Detection Based Smart Label Market Analysis, by Country 12.10. China Spoil Detection Based Smart Label Market Forecast, by Type 12.10.1. Time-Temperature Indicator 12.10.2. Oxygen Indicator 12.10.3. Carbon-Dioxide Indicator 12.11. China Spoil Detection Based Smart Label Market Forecast, by Application 12.11.1. Fish 12.11.2. Meat 12.11.3. Vegetables 12.11.4. Dairy Products 12.11.5. Processed Foods 12.11.6. Others 12.12. India Spoil Detection Based Smart Label Market Forecast, by Type 12.12.1. Time-Temperature Indicator 12.12.2. Oxygen Indicator 12.12.3. Carbon-Dioxide Indicator 12.13. India Spoil Detection Based Smart Label Market Forecast, by Application 12.13.1. Fish 12.13.2. Meat 12.13.3. Vegetables 12.13.4. Dairy Products 12.13.5. Processed Foods 12.13.6. Others 12.14. Japan Spoil Detection Based Smart Label Market Forecast, by Type 12.14.1. Time-Temperature Indicator 12.14.2. Oxygen Indicator 12.14.3. Carbon-Dioxide Indicator 12.15. Japan Spoil Detection Based Smart Label Market Forecast, by Application 12.15.1. Fish 12.15.2. Meat 12.15.3. Vegetables 12.15.4. Dairy Products 12.15.5. Processed Foods 12.15.6. Others 12.16. ASEAN Spoil Detection Based Smart Label Market Forecast, by Type 12.16.1. Time-Temperature Indicator 12.16.2. Oxygen Indicator 12.16.3. Carbon-Dioxide Indicator 12.17. ASEAN Spoil Detection Based Smart Label Market Forecast, by Application 12.17.1. Fish 12.17.2. Meat 12.17.3. Vegetables 12.17.4. Dairy Products 12.17.5. Processed Foods 12.17.6. Others 12.18. Rest of Asia Pacific Spoil Detection Based Smart Label Market Forecast, by Type 12.18.1. Time-Temperature Indicator 12.18.2. Oxygen Indicator 12.18.3. Carbon-Dioxide Indicator 12.19. Rest of Asia Pacific Spoil Detection Based Smart Label Market Forecast, by Application 12.19.1. Fish 12.19.2. Meat 12.19.3. Vegetables 12.19.4. Dairy Products 12.19.5. Processed Foods 12.19.6. Others 12.20. Asia Pacific Spoil Detection Based Smart Label Market Attractiveness Analysis 12.20.1. By Type 12.20.2. By Application 12.21. PEST Analysis 12.22. Key Trends 12.23. Key Development 13. Middle East & Africa Spoil Detection Based Smart Label Market Analysis 13.1. Key Findings 13.2. Middle East & Africa Spoil Detection Based Smart Label Market Overview 13.3. Middle East & Africa Spoil Detection Based Smart Label Market Value Share Analysis, by Type 13.4. Middle East & Africa Spoil Detection Based Smart Label Market Forecast, by Type 13.4.1. Time-Temperature Indicator 13.4.2. Oxygen Indicator 13.4.3. Carbon-Dioxide Indicator 13.5. Middle East & Africa Spoil Detection Based Smart Label Market Value Share Analysis, by Application 13.6. Middle East & Africa Spoil Detection Based Smart Label Market Forecast, by Application 13.6.1. Fish 13.6.2. Meat 13.6.3. Vegetables 13.6.4. Dairy Products 13.6.5. Processed Foods 13.6.6. Others 13.7. Middle East & Africa Spoil Detection Based Smart Label Market Value Share Analysis, by Country 13.8. Middle East & Africa Spoil Detection Based Smart Label Market Forecast, by Country 13.8.1. GCC 13.8.2. South Africa 13.8.3. Rest of Middle East & Africa 13.9. Middle East & Africa Spoil Detection Based Smart Label Market Analysis, by Country 13.10. GCC Spoil Detection Based Smart Label Market Forecast, by Type 13.10.1. Time-Temperature Indicator 13.10.2. Oxygen Indicator 13.10.3. Carbon-Dioxide Indicator 13.11. GCC Spoil Detection Based Smart Label Market Forecast, by Application 13.11.1. Fish 13.11.2. Meat 13.11.3. Vegetables 13.11.4. Dairy Products 13.11.5. Processed Foods 13.11.6. Others 13.12. South Africa Spoil Detection Based Smart Label Market Forecast, by Type 13.12.1. Time-Temperature Indicator 13.12.2. Oxygen Indicator 13.12.3. Carbon-Dioxide Indicator 13.13. South Africa Spoil Detection Based Smart Label Market Forecast, by Application 13.13.1. Fish 13.13.2. Meat 13.13.3. Vegetables 13.13.4. Dairy Products 13.13.5. Processed Foods 13.13.6. Others 13.14. Rest of Middle East & Africa Spoil Detection Based Smart Label Market Forecast, by Type 13.14.1. Time-Temperature Indicator 13.14.2. Oxygen Indicator 13.14.3. Carbon-Dioxide Indicator 13.15. Rest of Middle East & Africa Spoil Detection Based Smart Label Market Forecast, by Application 13.15.1. Fish 13.15.2. Meat 13.15.3. Vegetables 13.15.4. Dairy Products 13.15.5. Processed Foods 13.15.6. Others 13.16. Middle East & Africa Spoil Detection Based Smart Label Market Attractiveness Analysis 13.16.1. By Type 13.16.2. By Application 13.17. PEST Analysis 13.18. Key Trends 13.19. Key Development 14. South America Spoil Detection Based Smart Label Market Analysis 14.1. Key Findings 14.2. South America Spoil Detection Based Smart Label Market Overview 14.3. South America Spoil Detection Based Smart Label Market Value Share Analysis, by Type 14.4. South America Spoil Detection Based Smart Label Market Forecast, by Type 14.4.1. Time-Temperature Indicator 14.4.2. Oxygen Indicator 14.4.3. Carbon-Dioxide Indicator 14.5. South America Spoil Detection Based Smart Label Market Value Share Analysis, by Application 14.6. South America Spoil Detection Based Smart Label Market Forecast, by Application 14.6.1. Fish 14.6.2. Meat 14.6.3. Vegetables 14.6.4. Dairy Products 14.6.5. Processed Foods 14.6.6. Others 14.7. South America Spoil Detection Based Smart Label Market Value Share Analysis, by Country 14.8. South America Spoil Detection Based Smart Label Market Forecast, by Country 14.8.1. Brazil 14.8.2. Mexico 14.8.3. Rest of South America 14.9. South America Spoil Detection Based Smart Label Market Analysis, by Country 14.10. Brazil Spoil Detection Based Smart Label Market Forecast, by Type 14.10.1. Time-Temperature Indicator 14.10.2. Oxygen Indicator 14.10.3. Carbon-Dioxide Indicator 14.11. Brazil Spoil Detection Based Smart Label Market Forecast, by Application 14.11.1. Fish 14.11.2. Meat 14.11.3. Vegetables 14.11.4. Dairy Products 14.11.5. Processed Foods 14.11.6. Others 14.12. Mexico Spoil Detection Based Smart Label Market Forecast, by Type 14.12.1. Time-Temperature Indicator 14.12.2. Oxygen Indicator 14.12.3. Carbon-Dioxide Indicator 14.13. Mexico Spoil Detection Based Smart Label Market Forecast, by Application 14.13.1. Fish 14.13.2. Meat 14.13.3. Vegetables 14.13.4. Dairy Products 14.13.5. Processed Foods 14.13.6. Others 14.14. Rest of South America Spoil Detection Based Smart Label Market Forecast, by Type 14.14.1. Time-Temperature Indicator 14.14.2. Oxygen Indicator 14.14.3. Carbon-Dioxide Indicator 14.15. Rest of South America Spoil Detection Based Smart Label Market Forecast, by Application 14.15.1. Fish 14.15.2. Meat 14.15.3. Vegetables 14.15.4. Dairy Products 14.15.5. Processed Foods 14.15.6. Others 14.16. South America Spoil Detection Based Smart Label Market Attractiveness Analysis 14.16.1. By Type 14.16.2. By Application 14.17. PEST Analysis 14.18. Key Trends 14.19. Key Development 15. Company Profiles 15.1. Market Share Analysis, by Company 15.2. Competition Matrix 15.2.1. Competitive Benchmarking of key players by price, presence, market share, Applications and R&D investment 15.2.2. New Product Launches and Product Enhancements 15.2.3. Market Consolidation 15.2.3.1. M&A by Regions, Investment and Applications 15.2.3.2. M&A Key Players, Forward Integration and Backward Integration 15.3. Company Profiles: Key Players 15.3.1. Thinfilm Electronics ASA 15.3.1.1. Company Overview 15.3.1.2. Financial Overview 15.3.1.3. Product Portfolio 15.3.1.4. Business Strategy 15.3.1.5. Recent Developments 15.3.1.6. Company Footprint 15.3.2. SATO Holding AG. 15.3.3. Zebra Technologies 15.3.4. Invengo Information Technologies Co. Ltd. 15.3.5. Smartrac N.V. 15.3.6. Muhlbauer Holdings AG & Co. 16. Primary Key Insights
  • INQUIRE BEFORE BUYING