The Global Smart Container Market size was valued at USD 5.14 Bn. in 2024, and the total Global Smart Container Market revenue is expected to grow by 19.6% from 2024 to 2032, reaching nearly USD 21.52 Bn.Global Smart Container Market Overview
Smart containers are shipping containers embedded with Internet of Things (IoT) technologies such as GPS tracking, temperature and humidity sensors, and real-time monitoring systems. Smart containers enhance supply chain visibility, cargo security, and environmental control throughout the transit period, leading to better logistics efficiency and a reduction in operational risk. The market is expected to witness strong demand as more companies seek to increase visibility and enhance security through real-time tracking. Growth drivers include rising global trade, stricter regulatory standards in certain industries (pharmaceuticals, food and beverages, chemicals), route optimization, streamlined maintenance, and real-time inventory management. Smart containers help reduce costs and enhance customer service. Barriers to the adoption of smart containers include high implementation costs, existing technology, and concerns over data privacy and trust. This report analyzes the market trends, regional adoption trends, technological innovations, and strategic initiatives by leading players in the industry. Europe is expected to experience the highest growth, supported by a global ban on emissions, regulations on transportation, and a well-established logistics infrastructure. Leading companies in smart containers are TRAXENS (France) and Globe Tracker (USA), among others, which offer scalable and distributed connected container platforms designed to support smarter, safer, and more resilient global supply chains.
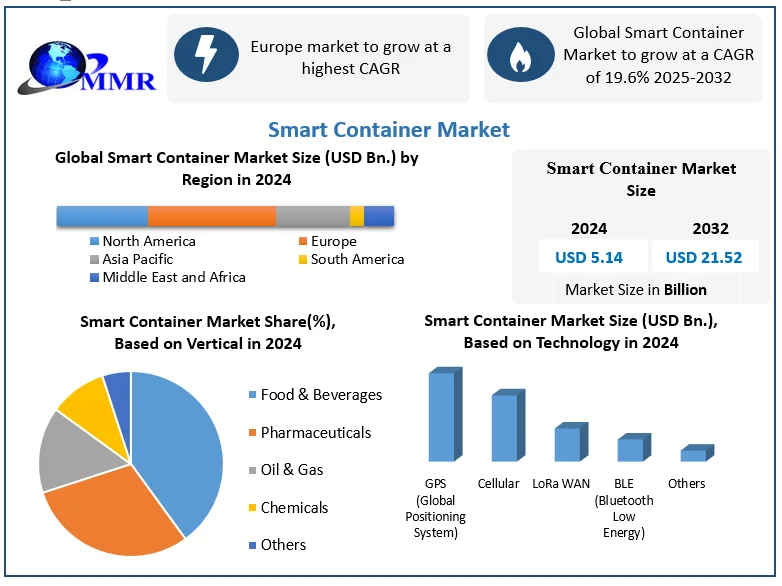
To know about the Research Methodology :- Request Free Sample Report
Global Smart Container Market Dynamics
Growing Demand for Real-Time Visibility and Security to Drive Smart Container Market
Global trade becomes increasingly complex, and the demand for real-time tracking of cargo rises, leading to a growing interest in smart containers and cargo tracking solutions. Smart containers have IoT sensors and GPS capability that provide full visibility, security, and monitoring capabilities during transit. Certain segments of the economy, particularly pharmaceuticals, food, and chemicals, require stricter compliance, leading to higher demand for smart containers. Leverage regulatory initiatives like the EU's Green Deal and the U.S. Food and Drug Administration (FDA) traceability further encouraged the shift in smart logistics. Increased integrity of cargo, improved route optimization, and better transparency of the operation will demonstrate the viability of smart containers as a solution.High Implementation Costs and Data Privacy Concerns Pose Challenges Smart Container Market
The challenge of adopting smart containers mainly revolves around high implementation and maintenance costs, particularly for smaller logistics providers. Organizations may not fully comprehend the implications or challenges of a solution, purchased product, or process shipment. Data privacy, lack of standardization, and regulatory challenges, especially those like GDPR in Europe, can complicate compliance. Logistics service providers based in remote locations can also face connectivity issues that limit real-time monitoring. Increased access to affordable sensors and the growth of worldwide mobile connectivity, expected to be rolled out across the globe, will alleviate restrictions and encourage greater adoption across logistics and transportation overall.Sustainability Mandates and Cold Chain Logistics Expansion to Create Opportunities in the Smart Container Market
The growth of temperature-sensitive cold chain logistics, along with a heightened focus on sustainable shipping, creates strong opportunities for smart containers. Smart containers ensure temperature control for sensitive goods like vaccines or fresh foods. They also contribute towards more sustainable logistics by optimizing transportation routes, reducing fuel consumption, and facilitating predictive maintenance. Government programs like the EU's Horizon Europe and CEF Transport fund are creating a positive influence on the adoption of smart containers by supporting investments in smart freight and discovering emissions tracking solutions.Global Smart Container Market Segment Analysis
Based on the Offering, the smart container market is segmented into hardware, software, and services. The hardware segment dominated the market in 2024. It consists of sensors, temperature sensors, pressure sensors, humidity sensors, gas sensors, other sensors, connectivity devices, telematics, and telemetry devices. The demand for hardware components is expected to dominate the smart container market throughout the study. A wide range of hardware components with varying prices are used to perform container monitoring and tracking applications. Smart container solutions necessitate a large number of sensors and other hardware components to offer successful network monitoring.
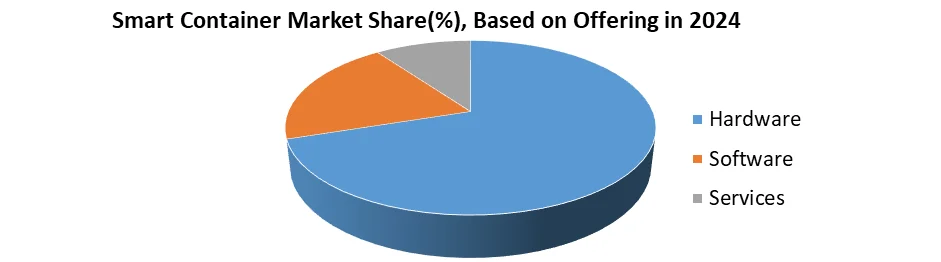
Based on Technology, the Smart Container Market is segmented into GPS (Global Positioning System), Cellular, LoRa WAN (Long Range Wide Area Network), BLE (Bluetooth Low Energy), and Others. GPS held the largest share of the Smart Container Market in 2024 and is expected to maintain this leading position throughout the forecast period, due to the rising demand for global real-time tracking capabilities in industries such as pharmaceuticals and food. The use of GPS can improve location accuracy and route planning, as well as secure cargo. Importantly, a rapid rise in GPS use is attributed to government programs, such as the EU’s CEF Transport fund, and reliable supply chains in the post-pandemic era.
Global Smart Container Market Regional Insights
Europe dominated the Smart Container Market, which is supported by a highly developed logistics infrastructure, sound regulatory enforcement and compliance with cargo tracking and emission regulations, and early acceptance of IoT in transport. Europe leads in Smart Transport and logistics solutions due to the large amount of government funding for digital supply chains and smart logistics technologies. European Union initiatives that stress carbon neutrality, operational transparency, and supply chain resilience are driving smart container market adoption throughout Europe. Germany, France, and the Netherlands have highly sophisticated port operations and smart freight systems, all looking to integrate.Government Funding
Government/Program Initiative Funding (EUR) Focus Area European Commission Connecting Europe Facility (CEF) USD 25 Bn. Smart & Sustainable Transport Infrastructure Germany (BMVI) Digital Transport Infrastructure Fund USD 0.50 Bn. Real-Time Freight Monitoring & Smart Logistics France France Relance Plan USD 0.10 Bn. Digital Supply Chain & Green Transport Global Smart Container Market Competitive Landscape
The Global Smart Container Market is a competitive sector, with North America and Europe leading the way due to improved logistics infrastructure and early-adoption IoT technology. Key players focus on real-time cargo visibility, security, and operational efficiencies enabled through data-led solutions. Traxens (France) is a notable European player that offers scalable IoT-based container tracking solutions with global partnerships with shipping giants such as CMA CGM and COSCO. In 2024, it generated an estimated USD 110 million in revenue 2024 as its Traxens-Box offering gained wider distribution, along with its advanced analytics products. Orbcomm Inc. (USA) is a leading North American player, leading the field in satellite-enabled container tracking, especially in cold chain logistics and asset management. It generated an estimated USD 267 million in revenue in 2024, and its CrewView service even enables users to monitor containers onboard in real-time. These companies, along with others, are also pushing the boundaries of innovation in providing smart, transparent, and resilient supply chain operations globally through new collaborations.Global Smart Container Market Recent Development
Year Company Name Recent Development 01-Feb-25 Traxens (France) Partnered with COSCO Shipping Logistics to deploy IoT-based smart container services in Asia, enhancing real-time cargo visibility 01-Aug-24 Hapag-Lloyd (Germany) & Nexxiot (Switzerland) Deployed over 1 million smart containers for real-time cargo tracking. 03-Jun-25 Orbcomm Inc. (USA) Released CrewView for real-time onboard container monitoring with SMS alerts. 25-Feb-25 Globe Tracker (USA) Launched blockchain-integrated smart container solution for secure cargo tracking. 15-Apr-25 Savvy Telematics (Switzerland) Introduced AI-enhanced smart bogie sensors to optimize rail container logistics. Global Smart Container Market Trends
• Companies are spending more money on smart containers to allow for real-time data on the location of cargo, including its temperature, humidity, and security. This allows management to make proactive decisions, mitigate losses, and create more precise ETAs. • TRAXENS (France), smart containers can provide real-time geolocation as well as alert users when a door is opened. CMA CGM is the shipping line that has already adopted smart containers and, as such, can transport international shipments of cargo with additional security. • Smart containers enable management of temperature-sensitive products and are especially important for pharmaceuticals and food & beverage companies to remain compliant with regulations and maintain product integrity. SkyCell AG (Switzerland) provides temperature-controlled containers for vaccine and biotech transport to maintain +2°C to +8°C transportation with temperature excursions minimized. • Smart container companies are incorporating advanced technologies like AI for predictive analytics and blockchain for cargo authentication into their systems, which provide transparency for all parties involved, along with traceability and operational efficiencies for managing the movement of cargo. • Ambrosus (Switzerland) utilizes a secure blockchain to track food quality data (temperature, humidity) in its containers and create tamper-proof records from farm to table.Smart Container Market Scope: Inquiry Before Buying
Smart Container Market Report Coverage Details Base Year: 2024 Forecast Period: 2025-2032 Historical Data: 2019 to 2024 Market Size in 2024: USD 5.14 Bn. Forecast Period 2025 to 2032 CAGR: 19.6% Market Size in 2032: USD 21.52 Bn. Segments Covered: by Offering Hardware Software Services by Technology GPS (Global Positioning System) Cellular LoRa WAN (Long Range Wide Area Network) BLE Others by Vertical Food & Beverages Pharmaceutical Oil & Gas Chemicals Others Global Smart Container Market by Region
North America (United States, Canada and Mexico) Europe (United Kingdom, France, Germany, Italy, Spain, Sweden, Russia, Rest of Europe) Asia Pacific (China, Japan, South Korea, India, Australia, Malaysia, Thailand, Vietnam, Indonesia, Philippines, Rest of APAC) Middle East and Africa (South Africa, GCC, Nigeria, Egypt, Turkey, Rest of MEA) South America (Brazil, Argentina, Colombia, Chile, Peru, Rest of South America)Global Smart Container Market Key Players
North America 1. ORBCOMM Inc. (USA) 2. Globe Tracker (USA) 3. Emerson Electric Co. (USA) 4. CMA CGM Group (France/USA operations) 5. Sensitech Inc. (USA – global operations) 6. Phillips Connect Technologies (Phillips Industries) (USA) Europe 7. Traxens (France) 8. Smart Containers Group AG (Switzerland) 9. Nexxiot AG (Switzerland) 10. Ambrosus (Switzerland) 11. ZillionSource Technologies (Germany) 12. Robert Bosch Manufacturing Solutions (Germany) 13. SkyCell AG (Switzerland) 14. Berlinger & Co. AG (Switzerland) 15. MSC (Mediterranean Shipping Company) (Switzerland) 16. Hapag-Lloyd AG (Germany) Asia-Pacific 17. Shenzhen CIMC Technologies Co., Ltd. (China) 18. SeaLand – A Maersk Company (Denmark/Singapore operations) 19. Ocean Network Express (Singapore)Frequently Asked Questions
1. Which region has the largest share in the Global Smart Container Market? Ans: Europe held the highest share in 2024. 2. What is the growth rate of the Global Smart Container Market? Ans: The Global Market is expected to grow at a CAGR of 19.6% during the forecast period 2025-2032. 3. What is the scope of the Global Smart Container Market report? Ans: The Global Smart Container Market report helps with the PESTEL, Porter's, Recommendations for Investors and leaders, and market estimation for the forecast period. 4. Who are the key players in the Global Smart Container Market? Ans: The important key players in the Global Smart Container Market are Globe Tracker (USA), Emerson Electric Co. (USA), CMA CGM Group (France), Traxens (France), Smart Containers Group AG (Switzerland), Nexxiot AG (Switzerland), and Ambrosus (Switzerland). 5. What is the study period of this market? Ans: The Global Smart Container Market is studied from 2025 to 2032.
1. Smart Container Market: Introduction 1.1. Study Assumptions and Market Definition 1.2. Scope of the Study 1.3. Executive Summary 2. Smart Container Market: Competitive Landscape 2.1. Ecosystem Analysis 2.2. MMR Competition Matrix 2.3. Competitive Landscape 2.4. Key Players Benchmarking 2.4.1. Company Name 2.4.2. Business Segment 2.4.3. Vertical Segment 2.4.4. Revenue (2024) 2.4.5. Company Locations 2.5. Market Structure 2.5.1. Market Leaders 2.5.2. Market Followers 2.5.3. Emerging Players 2.6. Mergers and Acquisitions Details 2.7. KANO Model Analysis 3. Global Smart Container Market: Dynamics 3.1. Region-wise Trends of Smart Container Market 3.1.1. North America Smart Container Market Trends 3.1.2. Europe Smart Container Market Trends 3.1.3. Asia Pacific Smart Container Market Trends 3.1.4. Middle East and Africa Smart Container Market Trends 3.1.5. South America Smart Container Market Trends 3.2. Smart Container Market Dynamics 3.2.1. Global Smart Container Market Drivers 3.2.1.1. Demand for Real-Time Visibility 3.2.1.2. Demand for Security 3.2.2. Global Smart Container Market Restraints 3.2.3. Global Smart Container Market Opportunities 3.2.3.1. Sustainability Mandates 3.2.3.2. Cold Chain Logistics Expansion 3.2.4. Global Smart Container Market Challenges 3.3. PORTER’s Five Forces Analysis 3.4. PESTLE Using Tree-Map Analysis 3.4.1. Government support for smart logistics 3.4.2. Increasing global trade volumes post-COVID recovery 3.4.3. Growing demand for food and pharmaceutical safety 3.4.4. Advancements in GPS, IoT, and cold chain sensors 3.5. Regulatory Landscape by Region 3.5.1. North America 3.5.2. Europe 3.5.3. Asia Pacific 3.5.4. Middle East and Africa 3.5.5. South America 4. Smart Container Market: Global Market Size and Forecast by Segmentation (by Value in USD Bn.) (2024-2032) 4.1. Smart Container Market Size and Forecast, By Offering (2024-2032) 4.1.1. Hardware 4.1.2. Software 4.1.3. Services 4.2. Smart Container Market Size and Forecast, By Technology (2024-2032) 4.2.1. GPS (Global Positioning System) 4.2.2. Cellular 4.2.3. LoRa WAN (Long Range Wide Area Network) 4.2.4. BLE 4.2.5. Others 4.3. Smart Container Market Size and Forecast, By Vertical (2024-2032) 4.3.1. Food & Beverages 4.3.2. Pharmaceutical 4.3.3. Oil & Gas 4.3.4. Chemicals 4.3.5. Others 4.4. Smart Container Market Size and Forecast, by Region (2024-2032) 4.4.1. North America 4.4.2. Europe 4.4.3. Asia Pacific 4.4.4. Middle East and Africa 4.4.5. South America 5. North America Smart Container Market Size and Forecast by Segmentation (by Value in USD Bn.) (2024-2032) 5.1. North America Smart Container Market Size and Forecast, By Offering (2024-2032) 5.1.1. Hardware 5.1.2. Software 5.1.3. Services 5.2. North America Smart Container Market Size and Forecast, By Technology (2024-2032) 5.2.1. GPS (Global Positioning System) 5.2.2. Cellular 5.2.3. LoRa WAN (Long Range Wide Area Network) 5.2.4. BLE 5.2.5. Others 5.3. North America Smart Container Market Size and Forecast, By Vertical (2024-2032) 5.3.1. Food & Beverages 5.3.2. Pharmaceutical 5.3.3. Oil & Gas 5.3.4. Chemicals 5.3.5. Others 5.4. North America Smart Container Market Size and Forecast, by Country (2024-2032) 5.4.1. United States 5.4.1.1. United States Smart Container Market Size and Forecast, By Offering (2024-2032) 5.4.1.1.1. Hardware 5.4.1.1.2. Software 5.4.1.1.3. Services 5.4.1.2. United States Smart Container Market Size and Forecast, By Technology (2024-2032) 5.4.1.2.1. GPS (Global Positioning System) 5.4.1.2.2. Cellular 5.4.1.2.3. LoRa WAN (Long Range Wide Area Network) 5.4.1.2.4. BLE 5.4.1.2.5. Others 5.4.1.3. Others United States Smart Container Market Size and Forecast, By Vertical (2024-2032) 5.4.1.3.1. Food & Beverages 5.4.1.3.2. Pharmaceutical 5.4.1.3.3. Oil & Gas 5.4.1.3.4. Chemicals 5.4.1.3.5. Others 5.4.2. Canada 5.4.2.1. Canada Smart Container Market Size and Forecast, By Offering (2024-2032) 5.4.2.1.1. Hardware 5.4.2.1.2. Software 5.4.2.1.3. Services 5.4.2.2. Canada Smart Container Market Size and Forecast, By Technology (2024-2032) 5.4.2.2.1. GPS (Global Positioning System) 5.4.2.2.2. Cellular 5.4.2.2.3. LoRa WAN (Long Range Wide Area Network) 5.4.2.2.4. BLE 5.4.2.2.5. Others 5.4.2.3. Canada Smart Container Market Size and Forecast, By Vertical (2024-2032) 5.4.2.3.1. Food & Beverages 5.4.2.3.2. Pharmaceutical 5.4.2.3.3. Oil & Gas 5.4.2.3.4. Chemicals 5.4.2.3.5. Others 5.4.2.4. Mexico Smart Container Market Size and Forecast, By Offering (2024-2032) 5.4.2.4.1. Hardware 5.4.2.4.2. Software 5.4.2.4.3. Services 5.4.2.5. Mexico Smart Container Market Size and Forecast, By Technology (2024-2032) 5.4.2.5.1. GPS (Global Positioning System) 5.4.2.5.2. Cellular 5.4.2.5.3. LoRa WAN (Long Range Wide Area Network) 5.4.2.5.4. BLE 5.4.2.5.5. Others 5.4.2.6. Mexico Smart Container Market Size and Forecast, By Vertical (2024-2032) 5.4.2.6.1. Food & Beverages 5.4.2.6.2. Pharmaceutical 5.4.2.6.3. Oil & Gas 5.4.2.6.4. Chemicals 5.4.2.6.5. Others 6. Europe Smart Container Market Size and Forecast by Segmentation (by Value in USD Bn.) (2024-2032) 6.1. Europe Smart Container Market Size and Forecast, By Offering (2024-2032) 6.2. Europe Smart Container Market Size and Forecast, By Technology (2024-2032) 6.3. Europe Smart Container Market Size and Forecast, Vertical (2024-2032) 6.4. Europe Smart Container Market Size and Forecast, by Country (2024-2032) 6.4.1. United Kingdom 6.4.1.1. United Kingdom Smart Container Market Size and Forecast, By Offering (2024-2032) 6.4.1.2. United Kingdom Smart Container Market Size and Forecast, By Technology (2024-2032) 6.4.1.3. United Kingdom Smart Container Market Size and Forecast, Vertical (2024-2032) 6.4.2. France 6.4.2.1. France Smart Container Market Size and Forecast, By Offering (2024-2032) 6.4.2.2. France Smart Container Market Size and Forecast, By Technology (2024-2032) 6.4.2.3. France Smart Container Market Size and Forecast, Vertical (2024-2032) 6.4.3. Germany 6.4.3.1. Germany Smart Container Market Size and Forecast, By Offering (2024-2032) 6.4.3.2. Germany Smart Container Market Size and Forecast, By Technology (2024-2032) 6.4.3.3. Germany Smart Container Market Size and Forecast, Vertical (2024-2032) 6.4.4. Italy 6.4.4.1. Italy Smart Container Market Size and Forecast, By Offering (2024-2032) 6.4.4.2. Italy Smart Container Market Size and Forecast, By Technology (2024-2032) 6.4.4.3. Italy Smart Container Market Size and Forecast, Vertical (2024-2032) 6.4.5. Spain 6.4.5.1. Spain Smart Container Market Size and Forecast, By Offering (2024-2032) 6.4.5.2. Spain Smart Container Market Size and Forecast, By Technology (2024-2032) 6.4.5.3. Spain Smart Container Market Size and Forecast, Vertical (2024-2032) 6.4.6. Sweden 6.4.6.1. Sweden Smart Container Market Size and Forecast, By Offering (2024-2032) 6.4.6.2. Sweden Smart Container Market Size and Forecast, By Technology (2024-2032) 6.4.6.3. Sweden Smart Container Market Size and Forecast, Vertical (2024-2032) 6.4.7. Austria 6.4.7.1. Austria Smart Container Market Size and Forecast, By Offering (2024-2032) 6.4.7.2. Austria Smart Container Market Size and Forecast, By Technology (2024-2032) 6.4.7.3. Austria Smart Container Market Size and Forecast, Vertical (2024-2032) 6.4.8. Rest of Europe 6.4.8.1. Rest of Europe Smart Container Market Size and Forecast, By Offering (2024-2032) 6.4.8.2. Rest of Europe Smart Container Market Size and Forecast, By Technology (2024-2032) 6.4.8.3. Rest of Europe Smart Container Market Size and Forecast, Vertical (2024-2032) 7. Asia Pacific Smart Container Market Size and Forecast by Segmentation (by Value in USD Bn.) (2024-2032) 7.1. Asia Pacific Smart Container Market Size and Forecast, By Offering (2024-2032) 7.2. Asia Pacific Smart Container Market Size and Forecast, By Technology (2024-2032) 7.3. Asia Pacific Smart Container Market Size and Forecast, Vertical (2024-2032) 7.4. Asia Pacific Smart Container Market Size and Forecast, by Country (2024-2032) 7.4.1. China 7.4.1.1. China Smart Container Market Size and Forecast, By Offering (2024-2032) 7.4.1.2. China Smart Container Market Size and Forecast, By Technology (2024-2032) 7.4.1.3. China Smart Container Market Size and Forecast, Vertical (2024-2032) 7.4.2. S Korea 7.4.2.1. S Korea Smart Container Market Size and Forecast, By Offering (2024-2032) 7.4.2.2. S Korea Smart Container Market Size and Forecast, By Technology (2024-2032) 7.4.2.3. S Korea Smart Container Market Size and Forecast, Vertical (2024-2032) 7.4.3. Japan 7.4.3.1. Japan Smart Container Market Size and Forecast, By Offering (2024-2032) 7.4.3.2. Japan Smart Container Market Size and Forecast, By Technology (2024-2032) 7.4.3.3. Japan Smart Container Market Size and Forecast, Vertical (2024-2032) 7.4.4. India 7.4.4.1. India Smart Container Market Size and Forecast, By Offering (2024-2032) 7.4.4.2. India Smart Container Market Size and Forecast, By Technology (2024-2032) 7.4.4.3. India Smart Container Market Size and Forecast, Vertical (2024-2032) 7.4.5. Australia 7.4.5.1. Australia Smart Container Market Size and Forecast, By Offering (2024-2032) 7.4.5.2. Australia Smart Container Market Size and Forecast, By Technology (2024-2032) 7.4.5.3. Australia Smart Container Market Size and Forecast, Vertical (2024-2032) 7.4.6. Indonesia 7.4.6.1. Indonesia Smart Container Market Size and Forecast, By Offering (2024-2032) 7.4.6.2. Indonesia Smart Container Market Size and Forecast, By Technology (2024-2032) 7.4.6.3. Indonesia Smart Container Market Size and Forecast, Vertical (2024-2032) 7.4.7. Philippines 7.4.7.1. Philippines Smart Container Market Size and Forecast, By Offering (2024-2032) 7.4.7.2. Philippines Smart Container Market Size and Forecast, By Technology (2024-2032) 7.4.7.3. Philippines Smart Container Market Size and Forecast, Vertical (2024-2032) 7.4.8. Malaysia 7.4.8.1. Malaysia Smart Container Market Size and Forecast, By Offering (2024-2032) 7.4.8.2. Malaysia Smart Container Market Size and Forecast, By Technology (2024-2032) 7.4.8.3. Malaysia Smart Container Market Size and Forecast, Vertical (2024-2032) 7.4.9. Vietnam 7.4.9.1. Vietnam Smart Container Market Size and Forecast, By Offering (2024-2032) 7.4.9.2. Vietnam Smart Container Market Size and Forecast, By Technology (2024-2032) 7.4.9.3. Vietnam Smart Container Market Size and Forecast, Vertical (2024-2032) 7.4.10. Thailand 7.4.10.1. Thailand Smart Container Market Size and Forecast, By Offering (2024-2032) 7.4.10.2. Thailand Smart Container Market Size and Forecast, By Technology (2024-2032) 7.4.10.3. Thailand Smart Container Market Size and Forecast, Vertical (2024-2032) 7.4.11. Rest of Asia Pacific 7.4.11.1. Rest of Asia Pacific Smart Container Market Size and Forecast, By Offering (2024-2032) 7.4.11.2. Rest of Asia Pacific Smart Container Market Size and Forecast, By Technology (2024-2032) 7.4.11.3. Rest of Asia Pacific Smart Container Market Size and Forecast, Vertical (2024-2032) 8. Middle East and Africa Smart Container Market Size and Forecast by Segmentation (by Value in USD Bn.) (2024-2032) 8.1. Middle East and Africa Smart Container Market Size and Forecast, By Offering (2024-2032) 8.2. Middle East and Africa Smart Container Market Size and Forecast, By Technology (2024-2032) 8.3. Middle East and Africa Smart Container Market Size and Forecast, Vertical (2024-2032) 8.4. Middle East and Africa Smart Container Market Size and Forecast, by Country (2024-2032) 8.4.1. South Africa 8.4.1.1. South Africa Smart Container Market Size and Forecast, By Offering (2024-2032) 8.4.1.2. South Africa Smart Container Market Size and Forecast, By Technology (2024-2032) 8.4.1.3. South Africa Smart Container Market Size and Forecast, Vertical (2024-2032) 8.4.2. GCC 8.4.2.1. GCC Smart Container Market Size and Forecast, By Offering (2024-2032) 8.4.2.2. GCC Smart Container Market Size and Forecast, By Technology (2024-2032) 8.4.2.3. GCC Smart Container Market Size and Forecast, Vertical (2024-2032) 8.4.3. Nigeria 8.4.3.1. Nigeria Smart Container Market Size and Forecast, By Offering (2024-2032) 8.4.3.2. Nigeria Smart Container Market Size and Forecast, By Technology (2024-2032) 8.4.3.3. Nigeria Smart Container Market Size and Forecast, Vertical (2024-2032) 8.4.4. Rest of ME&A 8.4.4.1. Rest of ME&A Smart Container Market Size and Forecast, By Offering (2024-2032) 8.4.4.2. Rest of ME&A Smart Container Market Size and Forecast, By Technology (2024-2032) 8.4.4.3. Rest of ME&A Smart Container Market Size and Forecast, Vertical (2024-2032) 9. South America Smart Container Market Size and Forecast by Segmentation (by Value in USD Bn.) (2024-2032) 9.1. South America Smart Container Market Size and Forecast, By Offering (2024-2032) 9.2. South America Smart Container Market Size and Forecast, By Technology (2024-2032) 9.3. South America Smart Container Market Size and Forecast, Vertical (2024-2032) 9.4. South America Smart Container Market Size and Forecast, by Country (2024-2032) 9.4.1. Brazil 9.4.1.1. Brazil Smart Container Market Size and Forecast, By Offering (2024-2032) 9.4.1.2. Brazil Smart Container Market Size and Forecast, By Technology (2024-2032) 9.4.1.3. Brazil Smart Container Market Size and Forecast, Vertical (2024-2032) 9.4.2. Argentina 9.4.2.1. Argentina Smart Container Market Size and Forecast, By Offering (2024-2032) 9.4.2.2. Argentina Smart Container Market Size and Forecast, By Technology (2024-2032) 9.4.2.3. Argentina Smart Container Market Size and Forecast, Vertical (2024-2032) 9.4.3. Rest of South America 9.4.3.1. Rest of South America Smart Container Market Size and Forecast, By Offering (2024-2032) 9.4.3.2. Rest of South America Smart Container Market Size and Forecast, By Technology (2024-2032) 9.4.3.3. Rest of South America Smart Container Market Size and Forecast, Vertical (2024-2032) 10. Company Profile: Key Players (Detailed Profile for all Major Industry Players) 10.1. Traxens (France) 10.1.1. Company Overview 10.1.2. Business Portfolio 10.1.3. Financial Overview 10.1.4. SWOT Analysis 10.1.5. Strategic Analysis 10.1.6. Recent Developments 10.2. ORBCOMM Inc. (USA) 10.3. Globe Tracker (USA) 10.4. Emerson Electric Co. (USA) 10.5. CMA CGM Group (France/USA operations) 10.6. Sensitech Inc. (USA – global operations) 10.7. Phillips Connect Technologies (Phillips Industries) (USA) 10.8. Smart Containers Group AG (Switzerland) 10.9. Nexxiot AG (Switzerland) 10.10. Ambrosus (Switzerland) 10.11. ZillionSource Technologies (Germany) 10.12. Robert Bosch Manufacturing Solutions (Germany) 10.13. SkyCell AG (Switzerland) 10.14. Berlinger & Co. AG (Switzerland) 10.15. MSC (Mediterranean Shipping Company) (Switzerland) 10.16. Hapag-Lloyd AG (Germany) 10.17. Shenzhen CIMC Technologies Co., Ltd. (China) 10.18. SeaLand – A Maersk Company (Denmark/Singapore operations) 10.19. Ocean Network Express (Singapore) 11. Key Findings 12. Analyst Recommendations 13. Smart Container Market: Research Methodology