
Power Supply Market by Output Power, Product Type, Vertical and Region - Global Market Size Estimation, Industry-Wide Analysis, Competitive Landscape Assessment & Long-Term Forecast to 2032
Overview
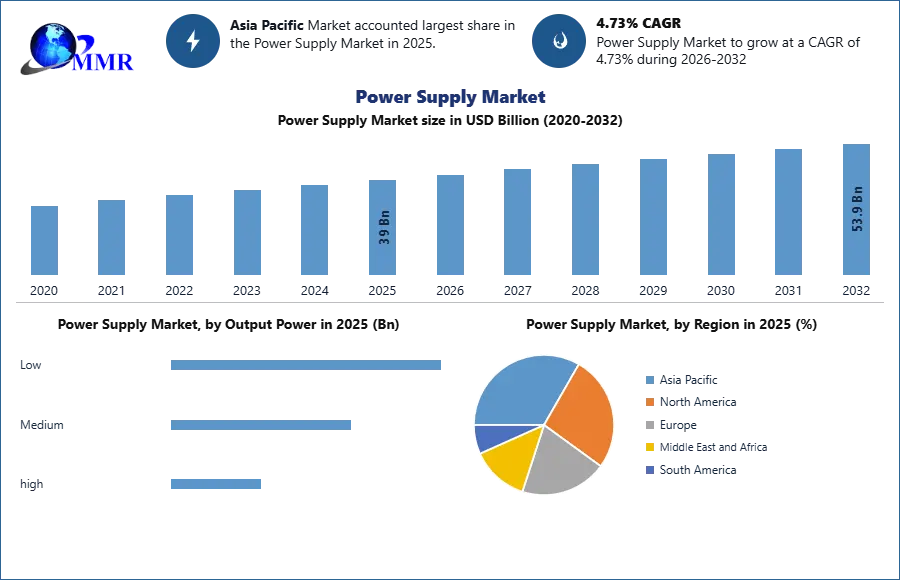
The Power Supply Market size was valued at USD 39 Billion in 2025 and the total Power Supply revenue is expected to grow at a CAGR of 4.73% from 2026 to 2032, reaching nearly USD 53.90 Billion.
Power Supply Market Overview:
The providing of electrical power to an electrical load via an electrical equipment is known as power supply. The conversion of an electrical source to the necessary current, voltage, and frequency to power the load is the basic function of a power supply. The conversion of one form of energy to another, such as mechanical, chemical, or solar power to electrical power, is included in the power supply. The important drivers driving the growth of this market include rising demand for home and building automation, the developing telecommunications sector, and rising need for energy efficient equipment.
The power supply market is divided into three categories based on output power: low, medium, and high. The low output power category is expected to increase at the quickest rate throughout the projection period, because to rising adoption of low output power in consumer electronics and telephony. The Asia-Pacific market for power supply is expected to grow at the quickest rate during the forecast period, taking into account the geographical landscape.
This report analyzes the Power Supply Market as the 2026 Middle East crisis triggers a systemic shock to global electronics and semiconductor fabrication. With the Strait of Hormuz closure disrupting 33% of global helium supply—critical for cooling high-performance power semiconductors—and driving crude, the industry is facing a severe supply-side crunch. We explore how market leaders are pivoting toward Gallium Nitride (GaN) and Silicon Carbide (SiC) technologies to achieve the extreme efficiency required by the accelerating AI data center build-out. By evaluating the shift toward modular, decentralized power architectures, this study provides decision-makers with strategic frameworks to navigate surging material costs and secure energy-dense solutions in a high-stakes, geopolitically fragmented landscape.
To know about the Research Methodology :- Request Free Sample Report
Power Supply Market Dynamics:
Growing use of home and building automation systems is a major factor driving the market's expansion. Building automation has gotten a lot of attention lately because of its potential to reduce energy usage and make building operation, monitoring, and maintenance easier while also increasing occupant happiness. The rising need for better lighting solutions, high demand for energy-efficient devices/appliances, and the developing telecommunications industry are all contributing to the global power supply market's accelerated growth.
The increased demand for power supply in consumer electronics, medical and healthcare, and military and aerospace could provide the industry with profitable growth potential. Increased adoption of high-voltage direct current (HVDC) and diverse regional/country-specific regulatory and safety regulations, on the other hand, are stifling the market's growth.
Governments enforce a multitude of regulatory international and domestic standards to assure the development of high-quality power supply equipment. Because these criteria differ from country to country, power supply producers must adhere to the standards that are specific to a country or region in order to achieve considerable sales. National or international agencies create and administer these standards, with various government-recognized testing laboratories.
Industrial power supply producers are also bound by RoHS (Restriction of Hazardous Substances), the Electronic Waste Directive, and the International Electrotechnical Commission (IEC). The maximum audible noise levels produced by a product are defined by specific power supply standards. A safety mark from the associated standards body or a mark showing compliance with local legislation within a designated economic area or trading zone may be used to identify products that meet these requirements. Power supply producers find it challenging to design, manufacture, and sell their goods globally because of these restrictions.
Robotics applications are fast expanding in the industrial sector around the world. Different types of power subsystems, such as AC/DC converters, battery management systems, and DC/DC converters, are utilized in various sorts of robots for industrial applications, including delivery robots, harvesting robots, logistics robots, security, and inspection robots. Because these robots run on batteries, power conversion, along with size and weight, is a crucial component. As load capacity, visual recognition, and user functionality requirements in robotic applications grow, power conversion becomes more difficult.
Global Power Supply Market Segment Analysis:
Power Supply Market is segmented into Output power, Product and Vertical.
Based on Output power, the market is sub-segmented into less than 300 watts, 300 – 999 watts, and more than 1,000 watts. In the worldwide Power Supply market's overall Output Power segment, the More Than 1,000 Watts segment has the largest share. The programmable high output power supplies are largely utilized in automobile test equipment, aerospace and military applications, and semiconductor fabrications. The demand for testing items that are exposed to rough, harsh, and lengthy environmental conditions for operational activities is propelling the power supplies market forward.
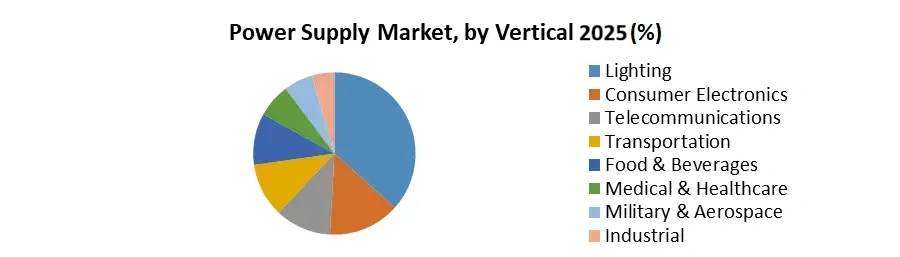
Based on Vertical, the market is sub-segmented into Telecommunications, Consumer Electronics, Medical & Healthcare, Military & Aerospace, Transportation, and others make up the Global Power Supply Market. In 2025, telecommunications had the largest market share. Due to developments in technology and customer demands for seamless communication services, the telecom network's broadband, mobile, and IP-based direction ensures the rapid development of telecom power systems. As a result, the demand for enhanced network services such as 4G, VoLTE, and 5G has grown in tandem with the increasing adoption of smartphone devices and data communication. This, in turn, is expected to be the primary driver of market expansion.
Power Supply Market Regional Insights:
Asia is by far the greatest geographic market for AC-DC and DC-DC merchant power supply, as one might assume. According to IHS, it will account for around 62 percent of global market revenues in . The Americas are expected to account for over 23% of the market, with the EMEA area (Europe, Middle East, and Africa) accounting for over 15%. In the next years, IHS expects a minor movement back to the Americas and EMEA, but Asia will still account for more than 60% of market revenues in . The BRIC countries of Brazil, Russia, India, and China are frequently identified as significant growth drivers, and this is true in the power supply industry, particularly in the short term. Right now, Brazil is one country that has a lot of promise for power supply companies.
The market has significant entry hurdles, including a requirement that a certain portion of the production process takes place in Brazil. Once these obstacles are overcome, suppliers can gain access to a largely unexplored market with little competition, resulting in higher average selling prices and, as a result, better margins. China has already established itself as one of the world's top power supply markets. According to IHS, China will account for over half of all power supply revenues in Asia in . While China's growth is slowing, it is still faster than that of many other countries and regions, which will assist to boost the industry. According to IHS, the Chinese power supply market will surpass that of North America (the United States and Canada) by , becoming the world's largest.
Recent Industry Developments (2025–2026)
| Exact Date | Company | Development | Impact |
|---|---|---|---|
| 06 March 2026 | SynQor Inc. | Launched the MPPS-4000-270, a compact, high-output voltage programmable power supply compliant with MIL-STD-810G standards. | Strengthens the company’s position in the military power supply segment by providing flexibility and operational redundancy for harsh environments. |
| 28 October 2025 | Bel Fuse Inc. | Announced the release of MDP65 (medical) and HDP65 (industrial) series, utilizing Gallium Nitride (GaN) technology for high efficiency. | Enhances power density and reduces footprint, meeting the rising demand for compact, high-performance power conversion in healthcare and ITE. |
| 20 October 2025 | Schneider Electric | Introduced Schneider Boost Pro, a local battery energy storage solution designed for commercial and industrial power flexibility. | Provides industrial sites with improved grid stability and lower energy costs, supporting the broader transition to decentralized power architectures. |
| 15 October 2025 | Voyager Technologies | Completed the acquisition of ExoTerra Resource to integrate advanced solar electric propulsion and power processing units. | Consolidates market share in the space power supply niche by combining high-efficiency thruster technology with spacecraft power subsystems. |
| 01 July 2025 | Frontgrade Technologies | Launched the PSM28 Power Supply Module, specifically optimized for radiation-hardened aerospace applications. | Addresses the reliability gap for deep-space missions and next-generation satellite constellations requiring ultra-reliable power modules. |
| 12 June 2025 | COSEL Co., Ltd. | Released the DCS1400B, a rugged full-brick HVDC DC/DC converter delivering up to 1400W for industrial automation. | Drives innovation in high-power density solutions for heavy machinery and manufacturing environments requiring modular energy conversion. |
Report Key Objectives
Comprehensive analysis for stakeholders in the Power Supply Market
Key players that include market leaders, followers, and new entrants.
PORTER, PESTEL analysis with the potential impact of micro-economic factors of the market
Power Supply Market Dynamics, structure by analyzing the market segments and Global view of the market.
Market strategies and Technology trends
Competitor benchmarking and Evaluation of potential co-operation partners
Power Supply Market Scope: Inquire before buying
| Power Supply Market | |||
|---|---|---|---|
| Report Coverage | Details | ||
| Base Year: | 2025 | Forecast Period: | 2026-2032 |
| Historical Data: | 2020 to 2025 | Market Size in 2025: | 39 USD Billion |
| Forecast Period 2026-2032 CAGR: | 4.73% | Market Size in 2032: | 53.9 USD Billion |
| Segments Covered: | by Output Power | Low Medium high |
|
| by Product Type | AC-DC DC-DC |
||
| by Vertical | Lighting Consumer Electronics Telecommunications Transportation Food & Beverages Medical & Healthcare Military & Aerospace Industrial |
||
Power Supply Market, by Region
North America (United States, Canada and Mexico)
Europe (UK, France, Germany, Italy, Spain, Sweden, Austria, Turkey, Russia and Rest of Europe)
Asia Pacific (China, India, Japan, South Korea, Australia, ASEAN and Rest of APAC)
Middle East and Africa (South Africa, GCC, Egypt, Nigeria and Rest of ME&A)
South America (Brazil, Argentina, Columbia and Rest of South America)
Key Players / Competitors Profiles Covered in Brief in Global Power Supply Market Report in Strategic Perspective:
- TDK-Lambda
- Siemens
- General Electric
- XP Power
- Murata Power Solutions
- Artesyn
- Phoenix Contact
- Delta Electronics
- ABB Ltd.
- Schneider Electric SE
- MEAN WELL Enterprises
- Cosel Co., Ltd.
- Bel Fuse Inc.
- Vicor Corporation
- Advanced Energy Industries
- Eaton Corporation
- CUI Inc.
- SL Power Electronics
- Mornsun Guangzhou Science & Technology
- Cincon Electronics
- PULS GmbH
- FSP Group
- Lite-On Technology
- Chicony Power Technology
- RECOM Power
Frequently Asked Questions
1.What is the projected Power Supply Market Size & Forecast through 2032?
Ans. The Power Supply Market valuation was USD 39 Billion in 2025. It targets USD 53.90 Billion by 2032, maintaining a 4.73% CAGR through the forecast period.
2. Which region maintains Regional Dominance in the Power Supply Market Share Analysis?
Ans. Asia-Pacific leads with 60% revenue share, driven by China’s manufacturing scale and India’s growth. High demand for consumer electronics and telecommunications infrastructure sustains this regional dominance.
3. How is the 2026 helium shortage affecting Power Supply Trends 2026?
Ans. The Middle East crisis disrupted helium supplies, forcing manufacturers to adopt GaN and SiC technologies to bypass cooling constraints and manage surging semiconductor fabrication costs effectively.
4. What are the primary Industry Growth Drivers for high-wattage power solutions?
Ans. Accelerating AI data center builds and automation demand drive the 1,000W+ segment. These sectors require energy-dense, modular architectures to handle intensive, high-performance computing loads globally.
5. How does GaN technology impact Power Supply Market efficiency and design?
Ans. Gallium Nitride (GaN) adoption enhances power density and reduces footprints. It is a critical trend for medical and industrial sectors seeking compact, high-efficiency energy conversion solutions.
6. What role does automation play in the Power Supply Market Growth?
Ans. Rising integration of robotics and building automation systems fuels demand for AC/DC converters. Efficiency in power conversion remains vital as load capacity and visual recognition evolve.
7. How do global regulatory standards influence Power Supply Market entry strategies?
Ans. Compliance with RoHS, IEC, and country-specific safety marks is mandatory. Manufacturers must navigate diverse regional regulations to secure market share and maintain high-quality equipment standards.