Plasma Fractionation Market size was valued at USD 32.96 Bn. in 2024, and the total Plasma Fractionation revenue is expected to grow at a CAGR of 6.89% from 2025 to 2032, reaching nearly USD 56.17 Bn.Plasma Fractionation Market Overview
Plasma Fractionation Products are therapeutic proteins derived from human plasma through a separation process, including immunoglobulins (IVIG/SCIG), albumin, clotting factors (e.g., Factor VIII, IX), and protease inhibitors (e.g., alpha-1 antitrypsin). These life-saving treatments are used for immunodeficiency disorders, hemophilia, critical care, and chronic diseases. The market is driven by increasing demand, technological advancements, and expanding clinical applications. The plasma fractionation market is experiencing strong demand for immunoglobulins and clotting factors; however, supply remains constrained due to limited donations and the lengthy processing time. Efforts to expand collection networks aim to bridge this gap. North America dominates the plasma fractionation market, driven by advanced healthcare infrastructure and high plasma collection rates. Key players include CSL Behring (Australia), Grifols (Spain), and Takeda (Japan), which lead in immunoglobulin and albumin production. Their extensive plasma networks and R&D investments maintain industry leadership amid rising global demand. The report focuses on the Plasma Fractionation Market value across the top regions and countries worldwide, highlighting regional developments, including market size, share, revenue, and more on a global scale. It covers capacity, production value, cost/profit, and supply/demand through statistical analysis. A brief analysis of market drivers, restraints, opportunities, and challenges is also included, with regional examples. To capitalize on opportunities, market vendors should focus more on growth prospects in fast-growing segments while maintaining their positions in slower-growing ones. The report also includes an analysis of key players' growth strategies, micro and macro market analyses, major developments, and emerging trends.
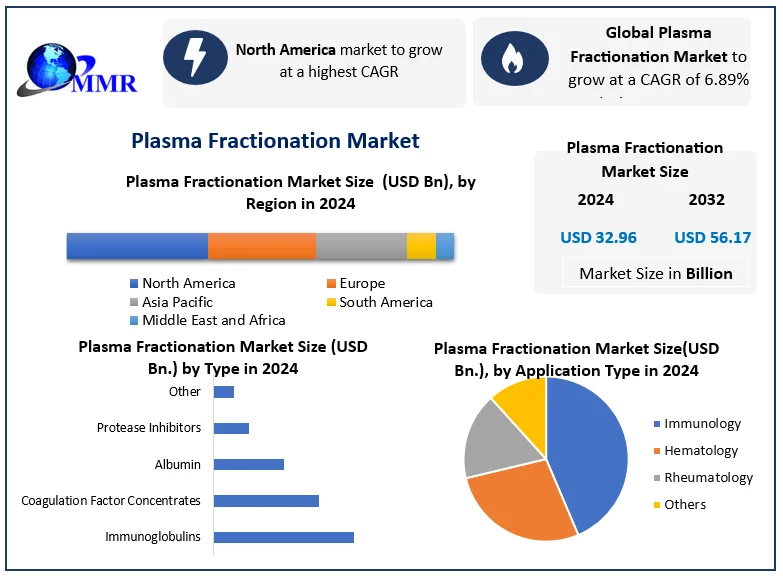
To know about the Research Methodology :- Request Free Sample Report
Plasma Fractionation Market Dynamics
Rising Prevalence of Chronic and Rare Diseases to Boost Plasma Fractionation Market Growth
The increasing incidence of immunodeficiency disorders, hemophilia, and neurological conditions is a major driver of the plasma fractionation market. Plasma-derived therapies, such as immunoglobulins (IVIG/SCIG), clotting factors, and albumin, are critical for treating these diseases. With aging populations and improved diagnostic capabilities, demand continues to surge. Additionally, the growing use of IVIG in autoimmune diseases (e.g., CIDP, lupus) and Alzheimer’s research further propels market growth. Pharmaceutical companies are expanding plasma collection and fractionation capacities to meet this rising demand, ensuring a steady supply of life-saving therapies.High Costs and Complex Manufacturing Processes to Restrain the Plasma Fractionation Market
Plasma fractionation is capital-intensive, requiring specialized facilities, stringent regulatory compliance, and costly pathogen safety measures. The long production cycle (7-12 months) and limited plasma supply create bottlenecks, leading to high treatment costs for end-users. Reimbursement challenges in emerging markets further restrict patient access. Additionally, strict donor eligibility criteria and logistical hurdles in plasma collection hinder scalability, making it difficult for smaller players to compete with established fractionators like CSL Behring and Grifols.Expansion in Emerging Markets and Development of Novel Plasma-Based Therapies to Create Opportunity for the Plasma Fractionation Market
Emerging economies (China, India, Brazil) present significant growth opportunities due to increasing healthcare investments, rising awareness of plasma therapies, and government initiatives to boost local fractionation capabilities. Additionally, advancements in recombinant alternatives and hyperimmune globulins for infectious diseases (e.g., Zika, Ebola) open new revenue streams. The growing use of plasma proteins in regenerative medicine and oncology further expands the market. Strategic partnerships and contract fractionation services offer additional avenues for growth, particularly for biotech firms entering the space.Plasma Fractionation Market Segment Analysis
Based on Type, the Plasma Fractionation Market is segmented into Immunoglobulins, Coagulation Factor Concentrates, Albumin, Protease Inhibitors, and Other. The immunoglobulin segment dominated the Plasma Fractionation Market in 2024 and is expected to hold the largest market share over the forecast period. Dominance due to their broad therapeutic applications in treating immunodeficiency disorders, autoimmune diseases (e.g., CIDP, lupus), and neurological conditions, alongside increasing off-label use in Alzheimer’s and long COVID research. The segment benefits from rising demand in aging populations and advancements in subcutaneous (SCIG) and high-concentration IVIG formulations. While coagulation factors remain critical for hemophilia treatment, they face competition from recombinant alternatives, and albumin demand stays steady but is limited by synthetic substitutes. Protease inhibitors, though niche, show growth in COPD and genetic emphysema, but immunoglobulins continue leading the market with expanding clinical indications and irreplaceable therapeutic value. Based on End-User, the Plasma Fractionation Market is segmented into Hospitals & Clinics, Clinical Research Laboratories, Academic Institutions, and Others. The Hospitals & Clinics segment dominated the Plasma Fractionation Market in 2024 and is expected to hold the largest market share over the forecast period. Dominance by the high demand for plasma-derived therapies (e.g., IVIG, albumin, clotting factors) in critical care, surgeries, and chronic disease management. Their widespread infrastructure, ability to administer complex treatments, and strong reimbursement systems solidify their dominance. Clinical research laboratories follow, fueled by growing R&D in plasma-based therapies, while academic institutions contribute through specialized studies. However, hospitals remain the primary segment due to direct patient care needs and rising hospitalization rates for conditions requiring plasma products, such as immunodeficiencies, hemophilia, and trauma cases.![]()
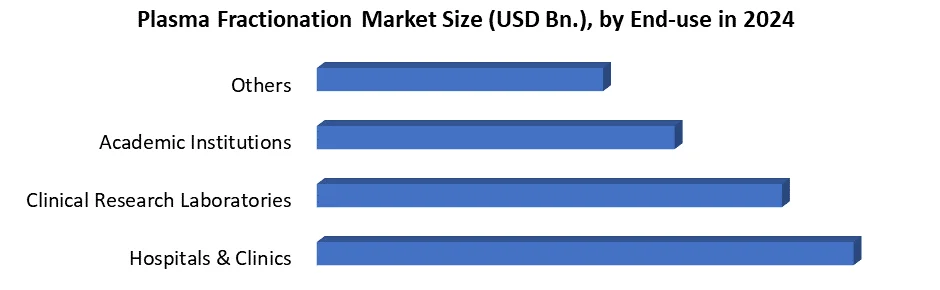
Plasma Fractionation Market Regional Analysis
North America dominated the plasma fractionation market in 2024
The largest revenue shares are due to your well-established healthcare infrastructure, high adoption of plasma-practical remedies, and strong plasma collection networks. North America leads the region, which is supported by chronic diseases (eg, haemophilia, PIDD), favorable reimbursement policies, and the presence of major industry players such as CSL Behring, Grifols, and Takeda. Additionally, increasing investment in plasma donation centers and advanced calibration technologies further strengthens the dominance of North America. Europe follows closely, inspired by the growing demand of the government promoting immunoglobulin and albumin, stringent regulatory standards, and plasma remedies. Meanwhile, the Asia-Pacific region is the fastest-growing market, which improves healthcare access, expands plasma collection programs, and increases awareness about plasma-excellent treatments in countries such as China and India. However, North America is at the forefront of its mature market dynamics and strong clinical adoption of plasma products.Plasma Fractionation Market Competitive Landscape
CSL Behring is aiming to generate $ 16-17 billion in revenue operating from the strong sales of immunoglobulin (Privigen, Hizentra), Hemophilia Therapy (including gene therapy hemgenics), and albumin, strategic pricing, and emerging market expansion. Grifols, the second largest player, expects $ 6.5–7 billion in revenue, supported by major products such as its major plasma collection network (300+ centers) and IVIG (Gammagard) and albumin (Flexbumin), although it faces financial movement challenges. For comparison, Takeda's plasma-reputed therapy revenue is estimated $ 4–5 billion, which is behind these two giants. The revenue of CSL is around 2.5 times that Grifols, reflecting its diverse biotech portfolio (including vaccine and gene therapy), while Grifols remains a pure-play plasma expert. Both companies rely a lot on the U.S.-Sound plasma (60-70% supply) and continue investing in the next-generation calibration technologies and pathogen safety to maintain market dominance.Plasma Fractionation Market Recent Development
Date Company Name Country Recent Development 15-Jan-2024 CSL Behring Australia/US FDA approved Hemgenix, the world's most expensive drug ($3.5M/dose) for hemophilia B treatment. 22-Mar-2024 Grifols Spain Inaugurated new $50M plasma collection facility in Houston, Texas, increasing US collection capacity by 15%. 05-Apr-2024 Takeda Japan Commercial launch of HYQVIA (SCIG) in India through a partnership with a local distributor. 18-May-2024 Octapharma Switzerland Received EMA approval for Nuwiq (FVIII) with extended shelf life for hemophilia A patients. 03-Jun-2024 Kedrion Italy Signed a 5-year agreement with Hualan Biological (China) for plasma technology transfer. Plasma Fractionation Industry Ecosystem: -
![]()
Plasma Fractionation Market Scope: Inquire before buying
Plasma Fractionation Market Report Coverage Details Base Year: 2024 Forecast Period: 2025-2032 Historical Data: 2019 to 2024 Market Size in 2024: USD 32.96 Bn. Forecast Period 2025 to 2032 CAGR: 6.89% Market Size in 2032: USD 56.17 Bn. Segments Covered: by Type Immunoglobulins Coagulation Factor Concentrates Albumin Protease Inhibitors Other by Application Type Immunology Haematology Rheumatology Others by End User Hospitals & Clinics Clinical Research Laboratories Academic Institutions Others Plasma Fractionation Market Key Region
North America (United States, Canada and Mexico) Europe (United Kingdom, France, Germany, Italy, Spain, Sweden, Russia, Rest of Europe) Asia Pacific (China, Japan, South Korea, India, Australia, Malaysia, Thailand, Vietnam, Indonesia, Philippines, Rest of APAC) Middle East and Africa (South Africa, GCC, Nigeria, Egypt, Turkey, Rest of MEA) South America (Brazil, Argentina, Colombia, Chile, Peru, Rest of South America)Plasma Fractionation Market Key Players are:
North America 1. CSL Plasma (USA - subsidiary of Australia's CSL Behring) 2. ADMA Biologics (USA) 3. Emergent BioSolutions (USA) Europe 1. Grifols (Spain) 2. Octapharma (Switzerland) 3. Kedrion (Italy) 4. Biotest (Germany)https://www.grifols.com/en/home 5. LFB Group (France) 6. Sanquin (Netherlands) Asia Pacific 1. China Biologic Products (CBPO) (China) 2. Hualan Biological Engineering (China) 3. Shanghai RAAS Blood Products (China) 4. Tiantan Biological Products (China) 5. Takeda (Japan) 6. Japan Blood Products Organization (JPBO) (Japan 7. Green Cross Corporation (South Korea) 8. SK Plasma (South Korea) 9. Reliance Life Sciences (India) 10. Bharat Serums and Vaccines (India) Middle East and Africa 1. GCC Biotech (Saudi Arabia) 2. National Bioproducts Institute (NBI) (South Africa) 3. Kedrion Middle East (UAE - subsidiary of Italy's Kedrion) 4. Octapharma Middle East (UAE - subsidiary of Switzerland's Octapharma) South America 1. Hemobras (Brazil) 2. Instituto Grifols (Brazil - subsidiary of Spain's Grifols) 3. Biofarma (Brazil)Frequently Asked Questions:
1. Which region has the largest share in the Global Market? Ans: The North America region held the highest share in 2024. 2. What is the growth rate of the Global Market? Ans: The Global Market is growing at a CAGR of 6.89% during the forecasting period 2025-2032. 3. What is the scope of the Global Market report? Ans: Global Market report helps with the PESTEL, PORTER, COVID-19 Impact analysis, Recommendations for Investors & Leaders, and market estimation of the forecast period. 4. What is the study period of this Market? Ans: The Global Market is studied from 2025 to 2032.
1. Plasma Fractionation Market Introduction 1.1. Study Assumptions and Market Definition 1.2. Scope of the Study 1.3. Executive Summary 2. Global Plasma Fractionation Market: Competitive Landscape 2.1. Ecosystem Analysis 2.2. MMR Competition Matrix 2.3. Competitive Landscape 2.4. Key Players Benchmarking 2.4.1. Company Name 2.4.2. Headquarter 2.4.3. Business Segment 2.4.4. End-user Segment 2.4.5. Revenue (2024) 2.4.6. Company Locations 2.5. Market Structure 2.5.1. Market Leaders 2.5.2. Market Followers 2.5.3. Emerging Players 2.6. Mergers and Acquisitions Details 2.7. KANO Model Analysis 3. Global Plasma Fractionation Market: Dynamics 3.1. Region-wise Trends of Plasma Fractionation Market 3.1.1. North America Plasma Fractionation Market Trends 3.1.2. Europe Plasma Fractionation Market Trends 3.1.3. Asia Pacific Plasma Fractionation Market Trends 3.1.4. Middle East and Africa Plasma Fractionation Market Trends 3.1.5. South America Plasma Fractionation Market Trends 3.2. Plasma Fractionation Market Dynamics 3.2.1. Global Plasma Fractionation Market Drivers 3.2.1.1. Data Privacy Concerns 3.2.1.2. High Implementation Costs 3.2.2. Global Plasma Fractionation Market Restraints 3.2.3. Global Plasma Fractionation Market Opportunities 3.2.3.1. Expansion in Emerging Markets 3.2.3.2. Electric Vehicle (EV) & Battery Application Boom 3.2.4. Global Plasma Fractionation Market Challenges 3.3. PORTER’s Five Forces Analysis 3.4. PESTLE Using Tree-Map Analysis 3.4.1. Government regulations on data privacy 3.5. Regulatory Landscape by Region 3.5.1. North America 3.5.2. Europe 3.5.3. Asia Pacific 3.5.4. Middle East and Africa 3.5.5. South America 4. Plasma Fractionation Market: Global Market Size and Forecast by Segmentation (by Value in USD Bn.) (2024-2032) 4.1. Plasma Fractionation Market Size and Forecast, By Type (2024-2032) 4.1.1. Immunoglobulins 4.1.2. Coagulation Factor Concentrates 4.1.3. Albumin 4.1.4. Protease Inhibitors 4.1.5. Others 4.2. Plasma Fractionation Market Size and Forecast, By Application Type (2024-2032) 4.2.1. Immunology 4.2.2. Hematology 4.2.3. Rheumatology 4.2.4. Others 4.3. Plasma Fractionation Market Size and Forecast, By End User (2024-2032) 4.3.1. Hospitals & Clinics 4.3.2. Clinical Research Laboratories 4.3.3. Academic Institutions 4.3.4. Others 4.4. Plasma Fractionation Market Size and Forecast, by Region (2024-2032) 4.4.1. North America 4.4.2. Europe 4.4.3. Asia Pacific 4.4.4. Middle East and Africa 4.4.5. South America 5. North America Plasma Fractionation Market Size and Forecast by Segmentation (by Value in USD Bn.) (2024-2032) 5.1. North America Plasma Fractionation Market Size and Forecast, By Type (2024-2032) 5.1.1. Immunoglobulins 5.1.2. Coagulation Factor Concentrates 5.1.3. Albumin 5.1.4. Protease Inhibitors 5.1.5. Others 5.2. North America Plasma Fractionation Market Size and Forecast, By Application Type (2024-2032) 5.2.1. Immunology 5.2.2. Haematology 5.2.3. Rheumatology 5.2.4. Others 5.3. North America Plasma Fractionation Market Size and Forecast, By End User (2024-2032) 5.3.1. Hospitals & Clinics 5.3.2. Clinical Research Laboratories 5.3.3. Academic Institutions 5.3.4. Others 5.4. North America Plasma Fractionation Market Size and Forecast, by Country (2024-2032) 5.4.1. United States 5.4.1.1. United States Plasma Fractionation Market Size and Forecast, By Type (2024-2032) 5.4.1.1.1. Immunoglobulins 5.4.1.1.2. Coagulation Factor Concentrates 5.4.1.1.3. Albumin 5.4.1.1.4. Protease Inhibitors 5.4.1.1.5. Others 5.4.1.2. United States Plasma Fractionation Market Size and Forecast, By Application Type (2024-2032) 5.4.1.2.1. Immunology 5.4.1.2.2. Haematology 5.4.1.2.3. Rheumatology 5.4.1.2.4. Others 5.4.1.3. United States Plasma Fractionation Market Size and Forecast, By End-Users Industry (2024-2032) 5.4.1.3.1. Hospitals & Clinics 5.4.1.3.2. Clinical Research Laboratories 5.4.1.3.3. Academic Institutions 5.4.1.3.4. Others 5.4.2. Canada 5.4.2.1. Canada Plasma Fractionation Market Size and Forecast, By Type (2024-2032) 5.4.2.1.1. Immunoglobulins 5.4.2.1.2. Coagulation Factor Concentrates 5.4.2.1.3. Albumin 5.4.2.1.4. Protease Inhibitors 5.4.2.1.5. Others 5.4.2.2. Canada Plasma Fractionation Market Size and Forecast, By Application Type (2024-2032) 5.4.2.2.1. Immunology 5.4.2.2.2. Haematology 5.4.2.2.3. Rheumatology 5.4.2.2.4. Others 5.4.2.3. Canada Plasma Fractionation Market Size and Forecast, By End User (2024-2032) 5.4.2.3.1. Hospitals & Clinics 5.4.2.3.2. Clinical Research Laboratories 5.4.2.3.3. Academic Institutions 5.4.2.3.4. Others 5.4.2.4. Mexico Plasma Fractionation Market Size and Forecast, By Type (2024-2032) 5.4.2.4.1. Immunoglobulins 5.4.2.4.2. Coagulation Factor Concentrates 5.4.2.4.3. Albumin 5.4.2.4.4. Protease Inhibitors 5.4.2.4.5. Others 5.4.2.5. Mexico Plasma Fractionation Market Size and Forecast, By Application Type (2024-2032) 5.4.2.5.1. Immunology 5.4.2.5.2. Haematology 5.4.2.5.3. Rheumatology 5.4.2.5.4. Others 5.4.2.6. Mexico Plasma Fractionation Market Size and Forecast, By End User (2024-2032) 5.4.2.6.1. Hospitals & Clinics 5.4.2.6.2. Clinical Research Laboratories 5.4.2.6.3. Academic Institutions 5.4.2.6.4. Others 6. Europe Plasma Fractionation Market Size and Forecast by Segmentation (by Value in USD Bn.) (2024-2032) 6.1. Europe Plasma Fractionation Market Size and Forecast, By Type (2024-2032) 6.2. Europe Plasma Fractionation Market Size and Forecast, By Application Type (2024-2032) 6.3. Europe Plasma Fractionation Market Size and Forecast, End User (2024-2032) 6.4. Europe Plasma Fractionation Market Size and Forecast, by Country (2024-2032) 6.4.1. United Kingdom 6.4.1.1. United Kingdom Plasma Fractionation Market Size and Forecast, By Type (2024-2032) 6.4.1.2. United Kingdom Plasma Fractionation Market Size and Forecast, By Application Type (2024-2032) 6.4.1.3. United Kingdom Plasma Fractionation Market Size and Forecast, End User (2024-2032) 6.4.2. France 6.4.2.1. France Plasma Fractionation Market Size and Forecast, By Type (2024-2032) 6.4.2.2. France Plasma Fractionation Market Size and Forecast, By Application Type (2024-2032) 6.4.2.3. France Plasma Fractionation Market Size and Forecast, End User (2024-2032) 6.4.3. Germany 6.4.3.1. Germany Plasma Fractionation Market Size and Forecast, By Type (2024-2032) 6.4.3.2. Germany Plasma Fractionation Market Size and Forecast, By Application Type (2024-2032) 6.4.3.3. Germany Plasma Fractionation Market Size and Forecast, End User (2024-2032) 6.4.4. Italy 6.4.4.1. Italy Plasma Fractionation Market Size and Forecast, By Type (2024-2032) 6.4.4.2. Italy Plasma Fractionation Market Size and Forecast, By Application Type (2024-2032) 6.4.4.3. Italy Plasma Fractionation Market Size and Forecast, End User (2024-2032) 6.4.5. Spain 6.4.5.1. Spain Plasma Fractionation Market Size and Forecast, By Type (2024-2032) 6.4.5.2. Spain Plasma Fractionation Market Size and Forecast, By Application Type (2024-2032) 6.4.5.3. Spain Plasma Fractionation Market Size and Forecast, End User (2024-2032) 6.4.6. Sweden 6.4.6.1. Sweden Plasma Fractionation Market Size and Forecast, By Type (2024-2032) 6.4.6.2. Sweden Plasma Fractionation Market Size and Forecast, By Application Type (2024-2032) 6.4.6.3. Sweden Plasma Fractionation Market Size and Forecast, End User (2024-2032) 6.4.7. Austria 6.4.7.1. Austria Plasma Fractionation Market Size and Forecast, By Type (2024-2032) 6.4.7.2. Austria Plasma Fractionation Market Size and Forecast, By Application Type (2024-2032) 6.4.7.3. Austria Plasma Fractionation Market Size and Forecast, End User (2024-2032) 6.4.8. Rest of Europe 6.4.8.1. Rest of Europe Plasma Fractionation Market Size and Forecast, By Type (2024-2032) 6.4.8.2. Rest of Europe Plasma Fractionation Market Size and Forecast, By Application Type (2024-2032) 6.4.8.3. Rest of Europe Plasma Fractionation Market Size and Forecast, End User (2024-2032) 7. Asia Pacific Plasma Fractionation Market Size and Forecast by Segmentation (by Value in USD Bn.) (2024-2032) 7.1. Asia Pacific Plasma Fractionation Market Size and Forecast, By Type (2024-2032) 7.2. Asia Pacific Plasma Fractionation Market Size and Forecast, By Application Type (2024-2032) 7.3. Asia Pacific Plasma Fractionation Market Size and Forecast, End User (2024-2032) 7.4. Asia Pacific Plasma Fractionation Market Size and Forecast, by Country (2024-2032) 7.4.1. China 7.4.1.1. China Plasma Fractionation Market Size and Forecast, By Type (2024-2032) 7.4.1.2. China Plasma Fractionation Market Size and Forecast, By Application Type (2024-2032) 7.4.1.3. China Plasma Fractionation Market Size and Forecast, End User (2024-2032) 7.4.2. S Korea 7.4.2.1. S Korea Plasma Fractionation Market Size and Forecast, By Type (2024-2032) 7.4.2.2. S Korea Plasma Fractionation Market Size and Forecast, By Application Type (2024-2032) 7.4.2.3. S Korea Plasma Fractionation Market Size and Forecast, End User (2024-2032) 7.4.3. Japan 7.4.3.1. Japan Plasma Fractionation Market Size and Forecast, By Type (2024-2032) 7.4.3.2. Japan Plasma Fractionation Market Size and Forecast, By Application Type (2024-2032) 7.4.3.3. Japan Plasma Fractionation Market Size and Forecast, End User (2024-2032) 7.4.4. India 7.4.4.1. India Plasma Fractionation Market Size and Forecast, By Type (2024-2032) 7.4.4.2. India Plasma Fractionation Market Size and Forecast, By Application Type (2024-2032) 7.4.4.3. India Plasma Fractionation Market Size and Forecast, End User (2024-2032) 7.4.5. Australia 7.4.5.1. Australia Plasma Fractionation Market Size and Forecast, By Type (2024-2032) 7.4.5.2. Australia Plasma Fractionation Market Size and Forecast, By Application Type (2024-2032) 7.4.5.3. Australia Plasma Fractionation Market Size and Forecast, End User (2024-2032) 7.4.6. Indonesia 7.4.6.1. Indonesia Plasma Fractionation Market Size and Forecast, By Type (2024-2032) 7.4.6.2. Indonesia Plasma Fractionation Market Size and Forecast, By Application Type (2024-2032) 7.4.6.3. Indonesia Plasma Fractionation Market Size and Forecast, End User (2024-2032) 7.4.7. Philippines 7.4.7.1. Philippines Plasma Fractionation Market Size and Forecast, By Type (2024-2032) 7.4.7.2. Philippines Plasma Fractionation Market Size and Forecast, By Application Type (2024-2032) 7.4.7.3. Philippines Plasma Fractionation Market Size and Forecast, End User (2024-2032) 7.4.8. Malaysia 7.4.8.1. Malaysia Plasma Fractionation Market Size and Forecast, By Type (2024-2032) 7.4.8.2. Malaysia Plasma Fractionation Market Size and Forecast, By Application Type (2024-2032) 7.4.8.3. Malaysia Plasma Fractionation Market Size and Forecast, End User (2024-2032) 7.4.9. Vietnam 7.4.9.1. Vietnam Plasma Fractionation Market Size and Forecast, By Type (2024-2032) 7.4.9.2. Vietnam Plasma Fractionation Market Size and Forecast, By Application Type (2024-2032) 7.4.9.3. Vietnam Plasma Fractionation Market Size and Forecast, End User (2024-2032) 7.4.10. Thailand 7.4.10.1. Thailand Plasma Fractionation Market Size and Forecast, By Type (2024-2032) 7.4.10.2. Thailand Plasma Fractionation Market Size and Forecast, By Application Type (2024-2032) 7.4.10.3. Thailand Plasma Fractionation Market Size and Forecast, End User (2024-2032) 7.4.11. Rest of Asia Pacific 7.4.11.1. Rest of Asia Pacific Plasma Fractionation Market Size and Forecast, By Type (2024-2032) 7.4.11.2. Rest of Asia Pacific Plasma Fractionation Market Size and Forecast, By Application Type (2024-2032) 7.4.11.3. Rest of Asia Pacific Plasma Fractionation Market Size and Forecast, End User (2024-2032) 8. Middle East and Africa Plasma Fractionation Market Size and Forecast by Segmentation (by Value in USD Bn.) (2024-2032) 8.1. Middle East and Africa Plasma Fractionation Market Size and Forecast, By Type (2024-2032) 8.2. Middle East and Africa Plasma Fractionation Market Size and Forecast, By Application Type (2024-2032) 8.3. Middle East and Africa Plasma Fractionation Market Size and Forecast, End User (2024-2032) 8.4. Middle East and Africa Plasma Fractionation Market Size and Forecast, by Country (2024-2032) 8.4.1. South Africa 8.4.1.1. South Africa Plasma Fractionation Market Size and Forecast, By Type (2024-2032) 8.4.1.2. South Africa Plasma Fractionation Market Size and Forecast, By Application Type (2024-2032) 8.4.1.3. South Africa Plasma Fractionation Market Size and Forecast, End User (2024-2032) 8.4.2. GCC 8.4.2.1. GCC Plasma Fractionation Market Size and Forecast, By Type (2024-2032) 8.4.2.2. GCC Plasma Fractionation Market Size and Forecast, By Application Type (2024-2032) 8.4.2.3. GCC Plasma Fractionation Market Size and Forecast, End User (2024-2032) 8.4.3. Nigeria 8.4.3.1. Nigeria Plasma Fractionation Market Size and Forecast, By Type (2024-2032) 8.4.3.2. Nigeria Plasma Fractionation Market Size and Forecast, By Application Type (2024-2032) 8.4.3.3. Nigeria Plasma Fractionation Market Size and Forecast, End User (2024-2032) 8.4.4. Rest of ME&A 8.4.4.1. Rest of ME&A Plasma Fractionation Market Size and Forecast, By Type (2024-2032) 8.4.4.2. Rest of ME&A Plasma Fractionation Market Size and Forecast, By Application Type (2024-2032) 8.4.4.3. Rest of ME&A Plasma Fractionation Market Size and Forecast, End User (2024-2032) 9. South America Plasma Fractionation Market Size and Forecast by Segmentation (by Value in USD Bn.) (2024-2032) 9.1. South America Plasma Fractionation Market Size and Forecast, By Type (2024-2032) 9.2. South America Plasma Fractionation Market Size and Forecast, By Application Type (2024-2032) 9.3. South America Plasma Fractionation Market Size and Forecast, End User (2024-2032) 9.4. South America Plasma Fractionation Market Size and Forecast, by Country (2024-2032) 9.4.1. Brazil 9.4.1.1. Brazil Plasma Fractionation Market Size and Forecast, By Type (2024-2032) 9.4.1.2. Brazil Plasma Fractionation Market Size and Forecast, By Application Type (2024-2032) 9.4.1.3. Brazil Plasma Fractionation Market Size and Forecast, End User (2024-2032) 9.4.2. Argentina 9.4.2.1. Argentina Plasma Fractionation Market Size and Forecast, By Type (2024-2032) 9.4.2.2. Argentina Plasma Fractionation Market Size and Forecast, By Application Type (2024-2032) 9.4.2.3. Argentina Plasma Fractionation Market Size and Forecast, End User (2024-2032) 9.4.3. Rest of South America 9.4.3.1. Rest of South America Plasma Fractionation Market Size and Forecast, By Type (2024-2032) 9.4.3.2. Rest of South America Plasma Fractionation Market Size and Forecast, By Application Type (2024-2032) 9.4.3.3. Rest of South America Plasma Fractionation Market Size and Forecast, End User (2024-2032) 10. Company Profile: Key Players (Detailed Profile for all Major Industry Players) 10.1. ADMA Biologics 10.1.1. Company Overview 10.1.2. Business Portfolio 10.1.3. Financial Overview 10.1.4. SWOT Analysis 10.1.5. Strategic Analysis 10.1.6. Recent Developments 10.2. Emergent BioSolutions 10.3. Grifols USA 10.4. CSL Plasma 10.5. Grifols 10.6. Octapharma 10.7. Kedrion 10.8. Biotest 10.9. LFB Group 10.10. Sanquin 10.11. China Biologic Products 10.12. Hualan Biological Engineering 10.13. Shanghai RAAS Blood Products 10.14. Tiantan Biological Products 10.15. Takeda 10.16. Japan Blood Products Organization 10.17. Green Cross Corporation 10.18. SK Plasma 10.19. Reliance Life Sciences 10.20. Bharat Serums and Vaccines 10.21. GCC Biotech 10.22. National Bioproducts Institute 10.23. Kedrion Middle East 10.24. Octapharma Middle East 10.25. Hemobras 10.26. Instituto Grifols 10.27. Biofarma 11. Key Findings 12. Analyst Recommendations 13. Plasma Fractionation Market: Research Methodology