Non-Alcoholic Beverage Market Size, Growth, Opportunities & Trends (2022-2029)

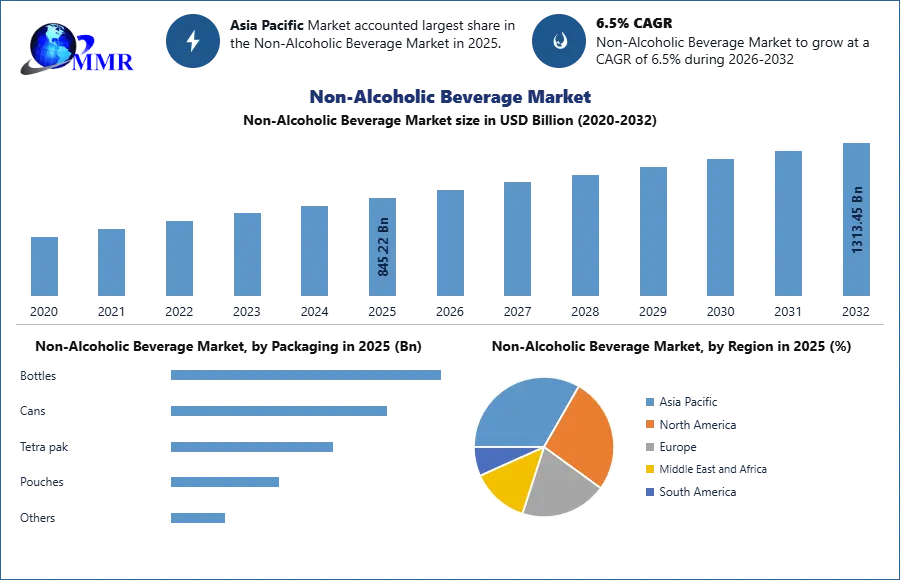
The Non-Alcoholic Beverage Market had an estimated revenue of US$ 745.20 billion in 2022 and is anticipated to grow at a CAGR of 6.5% to US$ 1,080.32 billion by 2029. Non-Alcoholic Beverage is defined as drinkables which do not contain alcohol at a percentage greater than 0.5% by volume. Since the 90’s The Non-Alcoholic Beverage Market has witnessed a boom or a rapid expansion and diversification of the Non-Alcoholic Beverage Industry due to changing customer preferences, increased health awareness and the need for novel beverage options. Expansion in the population, urbanisation, increase in disposable incomes and shift in consumer habits are some of the key factors that affect the market size. Carbonated soft drinks (CSDs), bottled water, fruit and vegetable juices and squashes, ready-to-drink (RTD) tea and coffee, functional and health beverages and dairy substitutes are important market categories. Carbonated soft drink which are often known as soda or fizzy drinks, offer a range of flavours and carbonation levels, providing consumers with a refreshing experience. Bottled water has experienced remarkable growth due to health consciousness and the need for convenient hydration options. This segment includes still water, sparkling water, flavoured water and functional water infused with vitamins, minerals, or electrolytes. These beverages address the unique health concerns of customers. Sustainability and environmental consciousness have become important considerations, for which the Non-Alcoholic Beverage Market is being reshaped by these trends. The impact of COVID-19 has also affected the growth in the current Non-Alcoholic Beverage Market. As per studies and research done with reference to data from the World Trade Organization (WTO), overall trade around the globe was impacted by 15-30%. The cancellation of major sports events like, Cricket World Cup 2020 and IPL 2020 has also put up an influence and affected the same. Looking forward to the distant future, the Non-Alcoholic Beverage Market is poised for further growth as consumers continue to prioritize health, seek novel taste experiences and embrace sustainable practices. Manufacturers and brands are likely to invest in research and development to create innovative and healthier beverage options, while also focusing on sustainable packaging and production methods. The market's dynamic nature and evolving consumer preferences provide ample opportunities for new entrants and existing players to thrive in this ever-expanding market segment. Non-Alcoholic Beverage Market To know about the Research Methodology :- Request Free Sample Report

Non-Alcoholic Beverage Market Drivers

The Non-Alcoholic Beverage Market is experiencing growth and expansion driven by several key factors. Changing consumer lifestyles, health consciousness and a desire for convenience are significant drivers. Consumers today are actively seeking healthier options, driving the demand for beverages that are low in sugar, natural and fortified with beneficial ingredients. Busy schedules and on-the-go consumption have fueled the need for convenient refreshments, leading to the popularity of ready-to-drink beverages like bottled water, RTD tea, coffee and energy drinks. According to the studies done, data shows a 24% increase in the sales of RTD tea and coffee in 2022 and the past 6 years. Innovation and flavour diversity are thriving in the market, with manufacturers introducing unique flavours and combinations to cater to evolving consumer preferences. Rising disposable incomes have allowed consumers to spend on premium Non-Alcoholic Beverages that offer superior quality, unique flavours and healthier attributes. The shift in drinking habits, especially among younger generations, has also impacted the market as health-conscious millennials and Gen-Z consumers seek non-alcoholic alternatives. Marketing and promotions play a significant role, with effective branding, targeted advertising campaigns and influencer endorsements helping to raise awareness and create a positive perception of Non-Alcoholic Beverages. These market drivers continue to shape the industry, driving product innovation, expanding consumer choices and contributing to overall market growth. Non-Alcoholic Beverage Market Trends & Opportunities The market for Non-Alcoholic Beverages is experiencing a large number of fascinating changes and is offering profitable prospects for business participants. The rise in the demand for beverages with an emphasis on health and wellbeing is one noticeable trend. Consumers are increasingly looking for products with nutritive advantages, practical features and low sugar content. The emphasis on premiumization and flavour innovation is another market trend. Due to consumer demand for distinctive and decadent flavour sensations, exotic fruit blends, beverages with herbal infusions and artisanal concoctions have all been developed. Craft and small-batch Non-Alcoholic Beverages are becoming more and more well-liked as customers recognise the care and premium ingredients that go into their creation. The industry for Non-Alcoholic Beverages is also starting to see sustainability as a major trend. There is a demand for eco-friendly packaging materials, lower carbon footprints and ethically sourced components as a result of growth in customers’ environmental concerns. Brands with a commitment to sustainability can win over the loyalty of the customers and gain a competitive advantage by implementing environmentally friendly practices. The Non-Alcoholic Beverage Market offers multiple opportunities for cross-collaborations and product diversification. Partnerships between beverage companies and other industries, such as the wellness, fashion, or entertainment sectors, can lead to innovative product launches and unique marketing campaigns. Additionally, the market offers room for expansion into untapped regions and emerging markets, where there is a growing middle class and increasing consumer disposable incomes. The trends in the Non-Alcoholic Beverage Market reflect a shift towards healthier choices, premium experiences, sustainability and digital engagement. By capitalizing on these trends and identifying emerging opportunities, industry players can position themselves to meet evolving consumer demands and drive growth in this dynamic market.

Non-Alcoholic Beverage Market Restraints & Challenges

While the Non-Alcoholic Beverage Market holds promising opportunities, there are multiple restraints and challenges to it as well. One significant challenge is the intense competition within the industry. The market is crowded with numerous brands striving for consumer attention and loyalty. Established players, as well as new entrants, face the challenge of differentiating themselves in a saturated market and capturing market share. Another restraint is the increasing regulatory scrutiny and evolving consumer expectations regarding ingredient transparency and labelling. Non-alcoholic beverage manufacturers must navigate complex regulations and ensure compliance with food safety standards and labelling requirements. Adapting to evolving regulations while maintaining product quality and consumer trust can be a challenging task for industry players. Changing consumer preferences and trends also pose challenges. The dynamic nature of consumer tastes and preferences requires constant innovation and adaptation by beverage companies. Staying ahead of emerging trends, predicting consumer demands and aligning product offerings accordingly can be a complex and demanding task. Also, raw material costs and supply chain disruptions can impact the market. Fluctuations in commodity prices, such as sugar or fruits, can impact production costs and profit margins. Supply chain challenges, such as transportation logistics or sourcing quality ingredients consistently, can affect the availability and affordability of products. Sustainability considerations are another challenge for the industry. The manufacturers of Non-Alcoholic Beverages have teamed up with the manufacturers of alcoholic beverages to create the Beverage Industry Environmental Roundtable (BIER), which aims to spread sustainability across the globe and address current issues. Although there is a rising desire for eco-friendly and sustainable practices, putting such initiatives into practice can require large investments as well as modifications to production or packaging methods. Balancing sustainability goals with cost considerations and consumer preferences can be a delicate challenge for companies. Also, the economic uncertainties and geopolitical factors can influence the Non-Alcoholic Beverage Market. Economic downturns or fluctuations in exchange rates can impact consumer purchasing power and overall market demand. Political and regulatory laws, which include, trade policies or taxation, create uncertainties and challenges for manufacturers operating in different regions.

Non-Alcoholic Beverage Market Segment Analysis

By Type: Carbonated Drinks, Ready-To-Drink (RTD) Tea & Coffee, Juices, Energy Drinks, Functional Beverages, and Packaged Water are a few of the segments which emerge out of the process of Non-Alcoholic Beverage Market Segmentation by Types. The Non-Alcoholic Beverage Market Segmentation is done on the basis of the Types of beverages available, which plays an important role to understand the diverse preferences, demands and needs of the consumers from the Non-Alcoholic Beverage Market. Carbonated drinks generally include a range of fizzy beverages, while juices offer a variety of fruit-based options. Energy drinks target consumers seeking an instant energy boost, while RTD tea and coffee cater to those craving convenience and refreshment. Functional beverages are designed with added health benefits and flavoured water satisfies the demand for a refreshing and flavourful hydrating option. By Distribution Channels: The Non-Alcoholic Beverage Market Segmentation is done on the basis of Distribution Channels and strategies used by the key players. The main distribution availed by these companies includes Foodservice Outlets, Supermarkets & Hypermarkets, Convenience Stores, Online Retail, Vending Machine, and Foodservice Outlets. The Supermarkets and Hypermarkets segment serves as the major distribution channel in the Non-Alcoholic Beverages Industry, which offers a wide range of Non-Alcoholic Beverages. Online retail has witnessed significant growth, providing the convenience of doorstep delivery.Food service outlets, such as restaurants and cafes, offer beverages as part of their menu options. Vending machines provide quick and accessible beverage options in public spaces. By segmenting the Non-Alcoholic Beverage Market based on distribution channels, companies can strategically position their products to ensure widespread availability and enhance customer convenience. Non-Alcoholic Beverage Market1 By Price: The Non-Alcoholic Market Segmentation is done on the basis of Price, which is a crucial strategy, to allow companies to cater to consumers with varying purchasing power and budget constraints. This kind of market segmentation divides the market based on several non-alcoholic beverage pricing points. The Non-Alcoholic Beverage Market provide a variety of goods that cater to various market segments which depend on cost and include mid-range, premium and cost-effective solutions. Consumers looking for high-quality ingredients, distinctive flavours, or specialty formulations are catered to by premium-priced beverages, while mid-range products strike a compromise between affordability and quality. Budget-friendly beverages are designed to provide accessible options for price-sensitive consumers. By segmenting the market based on price, companies can effectively position their products to meet the diverse financial considerations and preferences of consumers, ultimately capturing a wider customer base and maximizing profitability. By Age: The Non-Alcoholic Beverage Market Segmentation by Age is a vital approach, that allows companies to tailor their offerings to specific age groups with distinct preferences and consumption patterns. This type of segmentation involves dividing the market based on different age demographics. By understanding the preferences and needs of different age groups, companies can develop targeted marketing strategies, product formulations and packaging designs that resonate with their respective target segments. This segmentation approach enables companies to effectively capture the attention and loyalty of consumers across various age demographics in the Non-Alcoholic Beverage Market.

Non-Alcoholic Beverage Market: Segment Analysis

Asia-Pacific: The Asia-Pacific Non-Alcoholic Beverage Market is the fastest-growing market in the world. The market is expanding as a result of expansion and rapid urbanization of the industry, the rise in total earnings and economy, growth in the population and shift in consumer lifestyles. North America: The North America Non-Alcoholic Beverage Market is the largest in the world. The rise in the demand for functional beverages, the increase in the demand for healthy and convenient beverages as well as the growth in awareness for health and consciousness of consumers are all contributing factors that lead to the expansion of the market. Europe: The European Non-Alcoholic Beverage Market is the second largest in the world. The growth of the market is driven by similar factors as those of the other leading regions. South America: The expansion in the total earnings, population and urbanization are the key drivers of The South America Non-Alcoholic Beverage Market. Middle East and Africa: The Middle-East & African Non-Alcoholic Beverage Market growth is being driven by the increase in the population, the rapid increase in incomes and the widespread of urbanization.

Competitive Landscape in Non-Alcoholic Beverages Industry

The Non-Alcoholic Beverage Market share and customer attention are aggressively contested by businesses in the market for Non-Alcoholic Beverages. Several important aspects, such as product innovation, price tactics, branding initiatives, distribution methods and successful marketing campaigns, are at the heart of the industry's competition. To meet the changing desires of consumers, businesses constantly work to create new and distinctive flavours, healthier options and functional benefits. They strive to forge solid relationships with merchants and increase their presence in both mature and developing regions. There is a greater emphasis on creating low-sugar or sugar-free alternatives, organic and natural ingredients and plant-based solutions due to the rising demand for healthy beverages. In order to differentiate their brands from competitors and draw in customers, businesses are also investing in appealing packaging designs and interesting marketing techniques. The market for Non-Alcoholic Beverages is very competitive as businesses compete to separate out from the competitors and build a loyal consumer base in this quickly growing sector.

Non-Alcoholic Beverage Market Scope: Inquire before buying

Non-Alcoholic Beverage Market
Report Coverage Details
Base Year: 2022 Forecast Period: 2023-2029
Historical Data: 2017 to 2022 Market Size in 2022: US$ 745.20 Bn.
Forecast Period 2023 to 2029 CAGR: 6.5 % Market Size in 2029: US$ 1,080.32 Bn.
Segments Covered: by Type Carbonated Drinks Juices Energy Drinks Ready-To-Drink (RTD) Tea & Coffee Functional Beverages Packaged Water
by Distribution Channels Supermarkets & Hypermarket Convenience Stores Online Retail Foodservice Outlets Vending Machines
by Price Premium Mid-Range Budget-Friendly
by Age Infant (0-2 years) Child (2-14) Teenager (15-17) Young Adults (18-29) Adults (30-59) Senior Citizen (60 or greater)

Non-Alcoholic Beverage Market Regional Insights:

North America (United States, Canada and Mexico) Europe (UK, France, Germany, Italy, Spain, Sweden, Austria and Rest of Europe) Asia Pacific (China, South Korea, Japan, India, Australia, Indonesia, Malaysia, Vietnam, Taiwan, Bangladesh, Pakistan and Rest of APAC) Middle East and Africa (South Africa, GCC, Egypt, Nigeria and Rest of ME&A) South America (Brazil, Argentina Rest of South America)

Key Players: Non-Alcoholic Beverages Industry

1. Coca-Cola Company 2. PepsiCo Inc. 3. Nestlé S.A. 4. Keurig Dr Pepper Inc. 5. Danone S.A. 6. Red Bull GmbH 7. The Kraft Heinz Company 8. Unilever NV 9. Monster Beverage Corporation 10. Starbucks Corporation 11. Ocean Spray Cranberries, Inc. 12. The Coca-Cola Company 13. Pernod Ricard SA 14. Asahi Group Holdings, Ltd. 15. Suntory Holdings Limited 16. Tropicana Products Inc. 17. The Hershey Company 18. Dr Pepper Snapple Group Inc. 19. Britvic plc 20. Fomento Económico Mexicano, S.A.B. de C.V. (FEMSA) 21. Monster Energy Company 22. Argo Tea Inc. 23. Dole Food Company, Inc. 24. Ocean Brands GP 25. Lipton 26. Nescafe FAQs: 1. What are the growth drivers for the Non-Alcoholic Beverage Market? Ans. Increased health consciousness and consumer desire for healthier beverage options, increased preference for functional and fortified drinks and expanding consumer knowledge of the advantages of hydration and hydration-based beverages are the major drivers for the non-alcohol beverages market. Also, the development of new flavour profiles and product variations as well as the expansion of distribution channels all support market expansion. 2. What is the major restraint for the Non-Alcoholic Beverage Market growth? Ans. The growth in the concern over sugar content and its effects on health from the consumer end, has caused a shift in consumer preferences towards lower-sugar or sugar-free choices, is one of the key factors that stands as a barrier to the growth of Non-Alcoholic Beverage Market. A further obstacle to the expansion of the market includes the escalating competition from other beverage categories, like speciality coffee, Ready-To-Drink (RTDs) and plant-based alternatives. 3. Which region is expected to lead the global Non-Alcoholic Beverage Market during the forecast period? Ans. North America is expected to lead the global Non-Alcoholic Beverage Market during the forecast period. 4. What is the projected market size & growth rate of the Non-Alcoholic Beverage Market? Ans. The Non-Alcoholic Beverage Market size had a value of US$ 745.20 billion in 2022 and the total revenue is estimated to grow at a CAGR of 6.5% from 2022 to 2029, to reach an estimated value of approximately US$ 1,080.32 billion. 5. What segments are covered in the Non-Alcoholic Beverage Market report? Ans. The segments covered in the Non-Alcoholic Beverage Market report are by Type, Distribution Channels, Price, Age and Region.
1. Non-Alcoholic Beverage Market Introduction 1.1. Study Assumption and Market Definition 1.2. Scope of the Study 1.3. Executive Summary 2. Non-Alcoholic Beverage Market: Dynamics 2.1. Non-Alcoholic Beverage Market Trends by Region 2.1.1. North America Non-Alcoholic Beverage Market Trends 2.1.2. Europe Non-Alcoholic Beverage Market Trends 2.1.3. Asia Pacific Non-Alcoholic Beverage Market Trends 2.1.4. Middle East and Africa Non-Alcoholic Beverage Market Trends 2.1.5. South America Non-Alcoholic Beverage Market Trends 2.2. Non-Alcoholic Beverage Market Dynamics by Region 2.2.1. North America 2.2.1.1. North America Non-Alcoholic Beverage Market Drivers 2.2.1.2. North America Non-Alcoholic Beverage Market Restraints 2.2.1.3. North America Non-Alcoholic Beverage Market Opportunities 2.2.1.4. North America Non-Alcoholic Beverage Market Challenges 2.2.2. Europe 2.2.2.1. Europe Non-Alcoholic Beverage Market Drivers 2.2.2.2. Europe Non-Alcoholic Beverage Market Restraints 2.2.2.3. Europe Non-Alcoholic Beverage Market Opportunities 2.2.2.4. Europe Non-Alcoholic Beverage Market Challenges 2.2.3. Asia Pacific 2.2.3.1. Asia Pacific Non-Alcoholic Beverage Market Drivers 2.2.3.2. Asia Pacific Non-Alcoholic Beverage Market Restraints 2.2.3.3. Asia Pacific Non-Alcoholic Beverage Market Opportunities 2.2.3.4. Asia Pacific Non-Alcoholic Beverage Market Challenges 2.2.4. Middle East and Africa 2.2.4.1. Middle East and Africa Non-Alcoholic Beverage Market Drivers 2.2.4.2. Middle East and Africa Non-Alcoholic Beverage Market Restraints 2.2.4.3. Middle East and Africa Non-Alcoholic Beverage Market Opportunities 2.2.4.4. Middle East and Africa Non-Alcoholic Beverage Market Challenges 2.2.5. South America 2.2.5.1. South America Non-Alcoholic Beverage Market Drivers 2.2.5.2. South America Non-Alcoholic Beverage Market Restraints 2.2.5.3. South America Non-Alcoholic Beverage Market Opportunities 2.2.5.4. South America Non-Alcoholic Beverage Market Challenges 2.3. PORTER’s Five Forces Analysis 2.4. PESTLE Analysis 2.5. Technology Roadmap 2.6. Regulatory Landscape by Region 2.6.1. North America 2.6.2. Europe 2.6.3. Asia Pacific 2.6.4. Middle East and Africa 2.6.5. South America 2.7. Key Opinion Leader Analysis For Non-Alcoholic Beverage Industry 2.8. Analysis of Government Schemes and Initiatives For Non-Alcoholic Beverage Industry 2.9. Non-Alcoholic Beverage Market Trade Analysis 2.10. The Global Pandemic Impact on Non-Alcoholic Beverage Market 3. Non-Alcoholic Beverage Market: Global Market Size and Forecast by Segmentation by Demand and Supply Side (by Value in USD Million) 2022-2029 3.1. Non-Alcoholic Beverage Market Size and Forecast, by Type (2022-2029) 3.1.1. Carbonated Drinks 3.1.2. Juices 3.1.3. Energy Drinks 3.1.4. Ready-To-Drink (RTD) Tea & Coffee 3.1.5. Functional Beverages 3.1.6. Packaged Water 3.2. Non-Alcoholic Beverage Market Size and Forecast, by Distribution Channels (2022-2029) 3.2.1. Supermarkets & Hypermarket 3.2.2. Convenience Stores 3.2.3. Online Retail 3.2.4. Foodservice Outlets 3.2.5. Vending Machines 3.2.6. Others 3.3. Non-Alcoholic Beverage Market Size and Forecast, by Price (2022-2029) 3.3.1. Premium 3.3.2. Mid-Range 3.3.3. Budget-Friendly 3.4. Non-Alcoholic Beverage Market Size and Forecast, by Age (2022-2029) 3.4.1. Infant (0-2 years) 3.4.2. Child (2-14) 3.4.3. Teenager (15-17) 3.4.4. Young Adults (18-29) 3.4.5. Adults (30-59) 3.4.6. Senior Citizen (60 or greater) 3.5. Non-Alcoholic Beverage Market Size and Forecast, by Region (2022-2029) 3.5.1. North America 3.5.2. Europe 3.5.3. Asia Pacific 3.5.4. Middle East and Africa 3.5.5. South America 4. North America Non-Alcoholic Beverage Market Size and Forecast by Segmentation (by Value in USD Million) 2022-2029 4.1. North America Non-Alcoholic Beverage Market Size and Forecast, by Type (2022-2029) 4.1.1. Carbonated Drinks 4.1.2. Juices 4.1.3. Energy Drinks 4.1.4. Ready-To-Drink (RTD) Tea & Coffee 4.1.5. Functional Beverages 4.1.6. Packaged Water 4.2. North America Non-Alcoholic Beverage Market Size and Forecast, by Distribution Channels (2022-2029) 4.2.1. Supermarkets & Hypermarket 4.2.2. Convenience Stores 4.2.3. Online Retail 4.2.4. Foodservice Outlets 4.2.5. Vending Machines 4.2.6. Others 4.3. North America Non-Alcoholic Beverage Market Size and Forecast, by Price (2022-2029) 4.3.1. Premium 4.3.2. Mid-Range 4.3.3. Budget-Friendly 4.4. North America Non-Alcoholic Beverage Market Size and Forecast, by Age (2022-2029) 4.4.1. Infant (0-2 years) 4.4.2. Child (2-14) 4.4.3. Teenager (15-17) 4.4.4. Young Adults (18-29) 4.4.5. Adults (30-59) 4.4.6. Senior Citizen (60 or greater) 4.7. North America Non-Alcoholic Beverage Market Size and Forecast, by Country (2022-2029) 4.5.1. United States 4.5.1.1. United States Non-Alcoholic Beverage Market Size and Forecast, by Type (2022-2029) 4.5.1.1.1. Carbonated Drinks 4.5.1.1.2. Juices 4.5.1.1.3. Energy Drinks 4.5.1.1.4. Ready-To-Drink (RTD) Tea & Coffee 4.5.1.1.5. Functional Beverages 4.5.1.1.6. Packaged Water 4.5.1.2. United States Non-Alcoholic Beverage Market Size and Forecast, by Distribution Channels (2022-2029) 4.5.1.2.1. Supermarkets & Hypermarket 4.5.1.2.2. Convenience Stores 4.5.1.2.3. Online Retail 4.5.1.2.4. Foodservice Outlets 4.5.1.2.5. Vending Machines 4.5.1.2.6. Others 4.5.1.3. United States Non-Alcoholic Beverage Market Size and Forecast, by Price (2022-2029) 4.5.1.3.1. Premium 4.5.1.3.2. Mid-Range 4.5.1.3.3. Budget-Friendly 4.5.1.4. United States Non-Alcoholic Beverage Market Size and Forecast, by Age (2022-2029) 4.5.1.4.1. Infant (0-2 years) 4.5.1.4.2. Child (2-14) 4.5.1.4.3. Teenager (15-17) 4.5.1.4.4. Young Adults (18-29) 4.5.1.4.5. Adults (30-59) 4.5.1.4.6. Senior Citizen (60 or greater) 4.5.2. Canada 4.5.2.1. Canada Non-Alcoholic Beverage Market Size and Forecast, by Type (2022-2029) 4.5.2.1.1. Carbonated Drinks 4.5.2.1.2. Juices 4.5.2.1.3. Energy Drinks 4.5.2.1.4. Ready-To-Drink (RTD) Tea & Coffee 4.5.2.1.5. Functional Beverages 4.5.2.1.6. Packaged Water 4.5.2.2. Canada Non-Alcoholic Beverage Market Size and Forecast, by Distribution Channels (2022-2029) 4.5.2.2.1. Supermarkets & Hypermarket 4.5.2.2.2. Convenience Stores 4.5.2.2.3. Online Retail 4.5.2.2.4. Foodservice Outlets 4.5.2.2.5. Vending Machines 4.5.2.2.6. Others 4.5.2.3. Canada Non-Alcoholic Beverage Market Size and Forecast, by Price (2022-2029) 4.5.2.3.1. Premium 4.5.2.3.2. Mid-Range 4.5.2.3.3. Budget-Friendly 4.5.2.4. Canada Non-Alcoholic Beverage Market Size and Forecast, by Age (2022-2029) 4.5.2.4.1. Infant (0-2 years) 4.5.2.4.2. Child (2-14) 4.5.2.4.3. Teenager (15-17) 4.5.2.4.4. Young Adults (18-29) 4.5.2.4.5. Adults (30-59) 4.5.2.4.6. Senior Citizen (60 or greater) 4.5.3. Mexico 4.5.3.1. Mexico Non-Alcoholic Beverage Market Size and Forecast, by Type (2022-2029) 4.5.3.1.1. Carbonated Drinks 4.5.3.1.2. Juices 4.5.3.1.3. Energy Drinks 4.5.3.1.4. Ready-To-Drink (RTD) Tea & Coffee 4.5.3.1.5. Functional Beverages 4.5.3.1.6. Packaged Water 4.5.3.2. Mexico Non-Alcoholic Beverage Market Size and Forecast, by Distribution Channels (2022-2029) 4.5.3.2.1. Supermarkets & Hypermarket 4.5.3.2.2. Convenience Stores 4.5.3.2.3. Online Retail 4.5.3.2.4. Foodservice Outlets 4.5.3.2.5. Vending Machines 4.5.3.2.6. Others 4.5.3.3. Mexico Non-Alcoholic Beverage Market Size and Forecast, by Price (2022-2029) 4.5.3.3.1. Premium 4.5.3.3.2. Mid-Range 4.5.3.3.3. Budget-Friendly 4.5.3.4. Mexico Non-Alcoholic Beverage Market Size and Forecast, by Age (2022-2029) 4.5.3.4.1. Infant (0-2 years) 4.5.3.4.2. Child (2-14) 4.5.3.4.3. Teenager (15-17) 4.5.3.4.4. Young Adults (18-29) 4.5.3.4.5. Adults (30-59) 4.5.3.4.6. Senior Citizen (60 or greater) 5. Europe Non-Alcoholic Beverage Market Size and Forecast by Segmentation (by Value in USD Million) 2022-2029 5.1. Europe Non-Alcoholic Beverage Market Size and Forecast, by Type (2022-2029) 5.2. Europe Non-Alcoholic Beverage Market Size and Forecast, by Distribution Channels (2022-2029) 5.3. Europe Non-Alcoholic Beverage Market Size and Forecast, by Price (2022-2029) 5.4. Europe Non-Alcoholic Beverage Market Size and Forecast, by Age (2022-2029) 5.5. Europe Non-Alcoholic Beverage Market Size and Forecast, by Country (2022-2029) 5.5.1. United Kingdom 5.5.1.1. United Kingdom Non-Alcoholic Beverage Market Size and Forecast, by Type (2022-2029) 5.5.1.2. United Kingdom Non-Alcoholic Beverage Market Size and Forecast, by Distribution Channels (2022-2029) 5.5.1.3. United Kingdom Non-Alcoholic Beverage Market Size and Forecast, by Price(2022-2029) 5.5.1.4. United Kingdom Non-Alcoholic Beverage Market Size and Forecast, by Age (2022-2029) 5.5.2. France 5.5.2.1. France Non-Alcoholic Beverage Market Size and Forecast, by Type (2022-2029) 5.5.2.2. France Non-Alcoholic Beverage Market Size and Forecast, by Distribution Channels (2022-2029) 5.5.2.3. France Non-Alcoholic Beverage Market Size and Forecast, by Price(2022-2029) 5.5.2.4. France Non-Alcoholic Beverage Market Size and Forecast, by Age (2022-2029) 5.5.3. Germany 5.5.3.1. Germany Non-Alcoholic Beverage Market Size and Forecast, by Type (2022-2029) 5.5.3.2. Germany Non-Alcoholic Beverage Market Size and Forecast, by Distribution Channels (2022-2029) 5.5.3.3. Germany Non-Alcoholic Beverage Market Size and Forecast, by Price (2022-2029) 5.5.3.4. Germany Non-Alcoholic Beverage Market Size and Forecast, by Age (2022-2029) 5.5.4. Italy 5.5.4.1. Italy Non-Alcoholic Beverage Market Size and Forecast, by Type (2022-2029) 5.5.4.2. Italy Non-Alcoholic Beverage Market Size and Forecast, by Distribution Channels (2022-2029) 5.5.4.3. Italy Non-Alcoholic Beverage Market Size and Forecast, by Price(2022-2029) 5.5.4.4. Italy Non-Alcoholic Beverage Market Size and Forecast, by Age (2022-2029) 5.5.5. Spain 5.5.5.1. Spain Non-Alcoholic Beverage Market Size and Forecast, by Type (2022-2029) 5.5.5.2. Spain Non-Alcoholic Beverage Market Size and Forecast, by Distribution Channels (2022-2029) 5.5.5.3. Spain Non-Alcoholic Beverage Market Size and Forecast, by Price (2022-2029) 5.5.5.4. Spain Non-Alcoholic Beverage Market Size and Forecast, by Age (2022-2029) 5.5.6. Sweden 5.5.6.1. Sweden Non-Alcoholic Beverage Market Size and Forecast, by Type (2022-2029) 5.5.6.2. Sweden Non-Alcoholic Beverage Market Size and Forecast, by Distribution Channels (2022-2029) 5.5.6.3. Sweden Non-Alcoholic Beverage Market Size and Forecast, by Price (2022-2029) 5.5.6.4. Sweden Non-Alcoholic Beverage Market Size and Forecast, by Age (2022-2029) 5.5.7. Austria 5.5.7.1. Austria Non-Alcoholic Beverage Market Size and Forecast, by Type (2022-2029) 5.5.7.2. Austria Non-Alcoholic Beverage Market Size and Forecast, by Distribution Channels (2022-2029) 5.5.7.3. Austria Non-Alcoholic Beverage Market Size and Forecast, by Price (2022-2029) 5.5.7.4. Austria Non-Alcoholic Beverage Market Size and Forecast, by Age (2022-2029) 5.5.8. Rest of Europe 5.5.8.1. Rest of Europe Non-Alcoholic Beverage Market Size and Forecast, by Type (2022-2029) 5.5.8.2. Rest of Europe Non-Alcoholic Beverage Market Size and Forecast, by Distribution Channels (2022-2029) 5.5.8.3. Rest of Europe Non-Alcoholic Beverage Market Size and Forecast, by Price (2022-2029) 5.5.8.4. Rest of Europe Non-Alcoholic Beverage Market Size and Forecast, by Age (2022-2029) 6. Asia Pacific Non-Alcoholic Beverage Market Size and Forecast by Segmentation (by Value in USD Million) 2022-2029 6.1. Asia Pacific Non-Alcoholic Beverage Market Size and Forecast, by Type (2022-2029) 6.2. Asia Pacific Non-Alcoholic Beverage Market Size and Forecast, by Distribution Channels (2022-2029) 6.3. Asia Pacific Non-Alcoholic Beverage Market Size and Forecast, by Price (2022-2029) 6.4. Asia Pacific Non-Alcoholic Beverage Market Size and Forecast, by Age (2022-2029) 6.5. Asia Pacific Non-Alcoholic Beverage Market Size and Forecast, by Country (2022-2029) 6.7.1. China 6.5.1.1. China Non-Alcoholic Beverage Market Size and Forecast, by Type (2022-2029) 6.5.1.2. China Non-Alcoholic Beverage Market Size and Forecast, by Distribution Channels (2022-2029) 6.5.1.3. China Non-Alcoholic Beverage Market Size and Forecast, by Price (2022-2029) 6.5.1.4. China Non-Alcoholic Beverage Market Size and Forecast, by Age (2022-2029) 6.5.2. S Korea 6.5.2.1. S Korea Non-Alcoholic Beverage Market Size and Forecast, by Type (2022-2029) 6.5.2.2. S Korea Non-Alcoholic Beverage Market Size and Forecast, by Distribution Channels (2022-2029) 6.5.2.3. S Korea Non-Alcoholic Beverage Market Size and Forecast, by Price (2022-2029) 6.5.2.4. S Korea Non-Alcoholic Beverage Market Size and Forecast, by Age (2022-2029) 6.5.3. Japan 6.5.3.1. Japan Non-Alcoholic Beverage Market Size and Forecast, by Type (2022-2029) 6.5.3.2. Japan Non-Alcoholic Beverage Market Size and Forecast, by Distribution Channels (2022-2029) 6.5.3.3. Japan Non-Alcoholic Beverage Market Size and Forecast, by Price (2022-2029) 6.5.3.4. Japan Non-Alcoholic Beverage Market Size and Forecast, by Age (2022-2029) 6.5.4. India 6.5.4.1. India Non-Alcoholic Beverage Market Size and Forecast, by Type (2022-2029) 6.5.4.2. India Non-Alcoholic Beverage Market Size and Forecast, by Distribution Channels (2022-2029) 6.5.4.3. India Non-Alcoholic Beverage Market Size and Forecast, by Price (2022-2029) 6.5.4.4. India Non-Alcoholic Beverage Market Size and Forecast, by Age (2022-2029) 6.5.5. Australia 6.5.5.1. Australia Non-Alcoholic Beverage Market Size and Forecast, by Type (2022-2029) 6.5.5.2. Australia Non-Alcoholic Beverage Market Size and Forecast, by Distribution Channels (2022-2029) 6.5.5.3. Australia Non-Alcoholic Beverage Market Size and Forecast, by Price (2022-2029) 6.5.5.4. Australia Non-Alcoholic Beverage Market Size and Forecast, by Age (2022-2029) 6.5.6. Indonesia 6.5.6.1. Indonesia Non-Alcoholic Beverage Market Size and Forecast, by Type (2022-2029) 6.5.6.2. Indonesia Non-Alcoholic Beverage Market Size and Forecast, by Distribution Channels (2022-2029) 6.5.6.3. Indonesia Non-Alcoholic Beverage Market Size and Forecast, by Price (2022-2029) 6.5.6.4. Indonesia Non-Alcoholic Beverage Market Size and Forecast, by Age (2022-2029) 6.5.7. Malaysia 6.5.7.1. Malaysia Non-Alcoholic Beverage Market Size and Forecast, by Type (2022-2029) 6.5.7.2. Malaysia Non-Alcoholic Beverage Market Size and Forecast, by Distribution Channels (2022-2029) 6.5.7.3. Malaysia Non-Alcoholic Beverage Market Size and Forecast, by Price (2022-2029) 6.5.7.4. Malaysia Non-Alcoholic Beverage Market Size and Forecast, by Age (2022-2029) 6.5.8. Vietnam 6.5.8.1. Vietnam Non-Alcoholic Beverage Market Size and Forecast, by Type (2022-2029) 6.5.8.2. Vietnam Non-Alcoholic Beverage Market Size and Forecast, by Distribution Channels (2022-2029) 6.5.8.3. Vietnam Non-Alcoholic Beverage Market Size and Forecast, by Price(2022-2029) 6.5.8.4. Vietnam Non-Alcoholic Beverage Market Size and Forecast, by Age (2022-2029) 6.5.9. Taiwan 6.5.9.1. Taiwan Non-Alcoholic Beverage Market Size and Forecast, by Type (2022-2029) 6.5.9.2. Taiwan Non-Alcoholic Beverage Market Size and Forecast, by Distribution Channels (2022-2029) 6.5.9.3. Taiwan Non-Alcoholic Beverage Market Size and Forecast, by Price (2022-2029) 6.5.9.4. Taiwan Non-Alcoholic Beverage Market Size and Forecast, by Age (2022-2029) 6.5.10. Rest of Asia Pacific 6.5.10.1. Rest of Asia Pacific Non-Alcoholic Beverage Market Size and Forecast, by Type (2022-2029) 6.5.10.2. Rest of Asia Pacific Non-Alcoholic Beverage Market Size and Forecast, by Distribution Channels (2022-2029) 6.5.10.3. Rest of Asia Pacific Non-Alcoholic Beverage Market Size and Forecast, by Price (2022-2029) 6.5.10.4. Rest of Asia Pacific Non-Alcoholic Beverage Market Size and Forecast, by Age (2022-2029) 7. Middle East and Africa Non-Alcoholic Beverage Market Size and Forecast by Segmentation (by Value in USD Million) 2022-2029 7.1. Middle East and Africa Non-Alcoholic Beverage Market Size and Forecast, by Type (2022-2029) 7.2. Middle East and Africa Non-Alcoholic Beverage Market Size and Forecast, by Distribution Channels (2022-2029) 7.3. Middle East and Africa Non-Alcoholic Beverage Market Size and Forecast, by Price (2022-2029) 7.4. Middle East and Africa Non-Alcoholic Beverage Market Size and Forecast, by Age (2022-2029) 7.5. Middle East and Africa Non-Alcoholic Beverage Market Size and Forecast, by Country (2022-2029) 7.5.1. South Africa 7.5.1.1. South Africa Non-Alcoholic Beverage Market Size and Forecast, by Type (2022-2029) 7.5.1.2. South Africa Non-Alcoholic Beverage Market Size and Forecast, by Distribution Channels (2022-2029) 7.5.1.3. South Africa Non-Alcoholic Beverage Market Size and Forecast, by Price (2022-2029) 7.5.1.4. South Africa Non-Alcoholic Beverage Market Size and Forecast, by Age (2022-2029) 7.5.2. GCC 7.5.2.1. GCC Non-Alcoholic Beverage Market Size and Forecast, by Type (2022-2029) 7.5.2.2. GCC Non-Alcoholic Beverage Market Size and Forecast, by Distribution Channels (2022-2029) 7.5.2.3. GCC Non-Alcoholic Beverage Market Size and Forecast, by Price (2022-2029) 7.5.2.4. GCC Non-Alcoholic Beverage Market Size and Forecast, by Age (2022-2029) 7.5.3. Nigeria 7.5.3.1. Nigeria Non-Alcoholic Beverage Market Size and Forecast, by Type (2022-2029) 7.5.3.2. Nigeria Non-Alcoholic Beverage Market Size and Forecast, by Distribution Channels (2022-2029) 7.5.3.3. Nigeria Non-Alcoholic Beverage Market Size and Forecast, by Price (2022-2029) 7.5.3.4. Nigeria Non-Alcoholic Beverage Market Size and Forecast, by Age (2022-2029) 7.5.4. Rest of ME&A 7.5.4.1. Rest of ME&A Non-Alcoholic Beverage Market Size and Forecast, by Type (2022-2029) 7.5.4.2. Rest of ME&A Non-Alcoholic Beverage Market Size and Forecast, by Distribution Channels (2022-2029) 7.5.4.3. Rest of ME&A Non-Alcoholic Beverage Market Size and Forecast, by Price (2022-2029) 7.5.4.4. Rest of ME&A Non-Alcoholic Beverage Market Size and Forecast, by Age (2022-2029) 8. South America Non-Alcoholic Beverage Market Size and Forecast by Segmentation (by Value in USD Million) 2022-2029 8.1. South America Non-Alcoholic Beverage Market Size and Forecast, by Type (2022-2029) 8.2. South America Non-Alcoholic Beverage Market Size and Forecast, by Distribution Channels (2022-2029) 8.3. South America Non-Alcoholic Beverage Market Size and Forecast, by Price(2022-2029) 8.4. South America Non-Alcoholic Beverage Market Size and Forecast, by Age (2022-2029) 8.5. South America Non-Alcoholic Beverage Market Size and Forecast, by Country (2022-2029) 8.5.1. Brazil 8.5.1.1. Brazil Non-Alcoholic Beverage Market Size and Forecast, by Type (2022-2029) 8.5.1.2. Brazil Non-Alcoholic Beverage Market Size and Forecast, by Distribution Channels (2022-2029) 8.5.1.3. Brazil Non-Alcoholic Beverage Market Size and Forecast, by Price (2022-2029) 8.5.1.4. Brazil Non-Alcoholic Beverage Market Size and Forecast, by Age (2022-2029) 8.5.2. Argentina 8.5.2.1. Argentina Non-Alcoholic Beverage Market Size and Forecast, by Type (2022-2029) 8.5.2.2. Argentina Non-Alcoholic Beverage Market Size and Forecast, by Distribution Channels (2022-2029) 8.5.2.3. Argentina Non-Alcoholic Beverage Market Size and Forecast, by Price (2022-2029) 8.5.2.4. Argentina Non-Alcoholic Beverage Market Size and Forecast, by Age (2022-2029) 8.5.3. Rest Of South America 8.5.3.1. Rest Of South America Non-Alcoholic Beverage Market Size and Forecast, by Type (2022-2029) 8.5.3.2. Rest Of South America Non-Alcoholic Beverage Market Size and Forecast, by Distribution Channels (2022-2029) 8.5.3.3. Rest Of South America Non-Alcoholic Beverage Market Size and Forecast, by Price (2022-2029) 8.5.3.4. Rest Of South America Non-Alcoholic Beverage Market Size and Forecast, by Age (2022-2029) 9. Global Non-Alcoholic Beverage Market: Competitive Landscape 9.1. MMR Competition Matrix 9.2. Competitive Landscape 9.3. Key Players Benchmarking 9.3.1. Company Name 9.3.2. Business Segment 9.3.3. End-user Segment 9.3.4. Revenue (2022) 9.3.5. Company Locations 9.4. Leading Non-Alcoholic Beverage Market Companies, by market capitalization 9.5. Market Structure 9.5.1. Market Leaders 9.5.2. Market Followers 9.5.3. Emerging Players 9.6. Mergers and Acquisitions Details 10. Company Profile: Key Players 10.1. Coca-Cola Company 10.1.1. Company Overview 10.1.2. Business Portfolio 10.1.3. Financial Overview 10.1.4. SWOT Analysis 10.1.5. Strategic Analysis 10.1.6. Scale of Operation (small, medium, and large) 10.1.7. Details on Partnership 10.1.8. Regulatory Accreditations and Certifications Received by Them 10.1.9. Awards Received by the Firm 10.1.10. Recent Developments 10.2. PepsiCo Inc. 10.3. Nestlé S.A. 10.4. Keurig Dr Pepper Inc. 10.5. Danone S.A. 10.6. Red Bull GmbH 10.7. The Kraft Heinz Company 10.8. Unilever NV 10.9. Monster Beverage Corporation 10.10. Starbucks Corporation 10.11. Ocean Spray Cranberries, Inc. 10.12. The Coca-Cola Company 10.13. Pernod Ricard SA 10.14. Asahi Group Holdings, Ltd. 10.15. Suntory Holdings Limited 10.16. Tropicana Products Inc. 10.17. The Hershey Company 10.18. Dr Pepper Snapple Group Inc. 10.19. Britvic plc 10.20. Fomento Económico Mexicano, S.A.B. de C.V. (FEMSA) 10.21. Monster Energy Company 10.22. Argo Tea Inc. 10.23. Dole Food Company, Inc. 10.24. Ocean Brands GP 10.25. Lipton 10.26. Nescafe 11. Key Findings 12. Industry Recommendations 13. Non-Alcoholic Beverage Market: Research Methodology 14. Terms and Glossary
  • INQUIRE BEFORE BUYING