1. New Energy Vehicle (NEV) Taxi Market Introduction
1.1. Study Assumption and Market Definition
1.2. Scope of the Study
1.3. Executive Summary
2. Global New Energy Vehicle (NEV) Taxi Market: Competitive Landscape
2.1. MMR Competition Matrix
2.2. Competitive Landscape
2.3. Key Players Benchmarking
2.3.1. Company Name
2.3.2. Business Segment
2.3.3. End-user Segment
2.3.4. Revenue (2025)
2.3.5. Company Locations
2.4. Leading New Energy Vehicle (NEV) Taxi Market Companies, by market capitalization
2.5. Market Structure
2.5.1. Market Leaders
2.5.2. Market Followers
2.5.3. Emerging Players
2.6. Mergers and Acquisitions Details
3. New Energy Vehicle (NEV) Taxi Market: Dynamics
3.1. New Energy Vehicle (NEV) Taxi Market Trends by Region
3.1.1. North America New Energy Vehicle (NEV) Taxi Market Trends
3.1.2. Europe New Energy Vehicle (NEV) Taxi Market Trends
3.1.3. Asia Pacific New Energy Vehicle (NEV) Taxi Market Trends
3.1.4. Middle East and Africa New Energy Vehicle (NEV) Taxi Market Trends
3.1.5. South America New Energy Vehicle (NEV) Taxi Market Trends
3.2. New Energy Vehicle (NEV) Taxi Market Dynamics by Region
3.2.1. North America
3.2.1.1. North America New Energy Vehicle (NEV) Taxi Market Drivers
3.2.1.2. North America New Energy Vehicle (NEV) Taxi Market Restraints
3.2.1.3. North America New Energy Vehicle (NEV) Taxi Market Opportunities
3.2.1.4. North America New Energy Vehicle (NEV) Taxi Market Challenges
3.2.2. Europe
3.2.2.1. Europe New Energy Vehicle (NEV) Taxi Market Drivers
3.2.2.2. Europe New Energy Vehicle (NEV) Taxi Market Restraints
3.2.2.3. Europe New Energy Vehicle (NEV) Taxi Market Opportunities
3.2.2.4. Europe New Energy Vehicle (NEV) Taxi Market Challenges
3.2.3. Asia Pacific
3.2.3.1. Asia Pacific New Energy Vehicle (NEV) Taxi Market Drivers
3.2.3.2. Asia Pacific New Energy Vehicle (NEV) Taxi Market Restraints
3.2.3.3. Asia Pacific New Energy Vehicle (NEV) Taxi Market Opportunities
3.2.3.4. Asia Pacific New Energy Vehicle (NEV) Taxi Market Challenges
3.2.4. Middle East and Africa
3.2.4.1. Middle East and Africa New Energy Vehicle (NEV) Taxi Market Drivers
3.2.4.2. Middle East and Africa New Energy Vehicle (NEV) Taxi Market Restraints
3.2.4.3. Middle East and Africa New Energy Vehicle (NEV) Taxi Market Opportunities
3.2.4.4. Middle East and Africa New Energy Vehicle (NEV) Taxi Market Challenges
3.2.5. South America
3.2.5.1. South America New Energy Vehicle (NEV) Taxi Market Drivers
3.2.5.2. South America New Energy Vehicle (NEV) Taxi Market Restraints
3.2.5.3. South America New Energy Vehicle (NEV) Taxi Market Opportunities
3.2.5.4. South America New Energy Vehicle (NEV) Taxi Market Challenges
3.3. PORTER's Five Forces Analysis
3.4. PESTLE Analysis
3.5. Technology Roadmap
3.6. Regulatory Landscape by Region
3.6.1. North America
3.6.2. Europe
3.6.3. Asia Pacific
3.6.4. Middle East and Africa
3.6.5. South America
3.7. Key Opinion Leader Analysis For New Energy Vehicle (NEV) Taxi Industry
3.8. Analysis of Government Schemes and Initiatives For New Energy Vehicle (NEV) Taxi Industry
3.9. New Energy Vehicle (NEV) Taxi Market Trade Analysis
3.10. The Global Pandemic Impact on New Energy Vehicle (NEV) Taxi Market
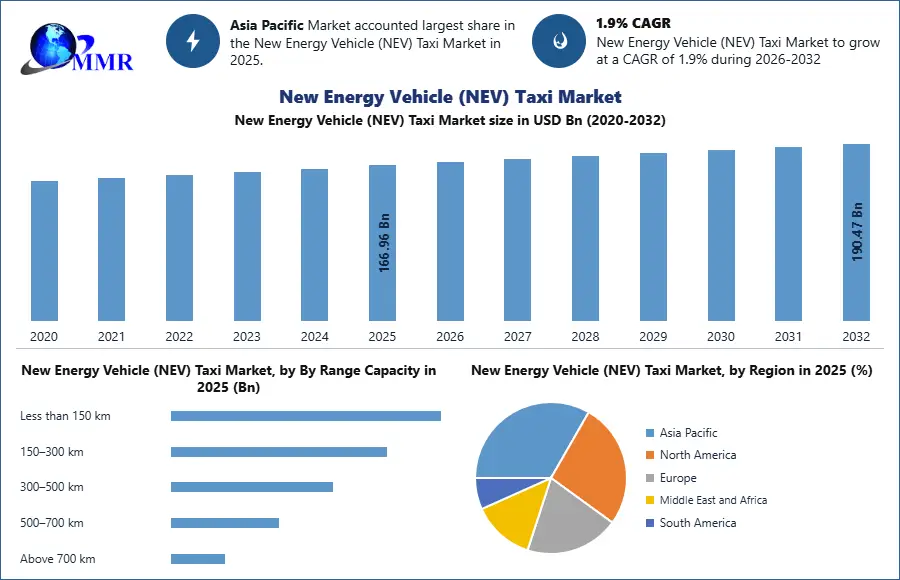
4. New Energy Vehicle (NEV) Taxi Market: Global Market Size and Forecast by Segmentation (in USD Bn) 2025-2032
4.1. New Energy Vehicle (NEV) Taxi Market Size and Forecast, by By Ownership Model (2025-2032)
4.1.1. Fleet Operators
4.1.2. Driver-Owned Vehicles
4.1.3. Aggregator-Owned Fleet
4.1.4. Public-Private Partnerships
4.1.5. Cooperative Ownership
4.2. New Energy Vehicle (NEV) Taxi Market Size and Forecast, by By Power Output (2025-2032)
4.2.1. 50–100 kW
4.2.2. Below 50 kW
4.2.3. 100–150 kW
4.2.4. 150–250 kW
4.2.5. Above 250 kW
4.3. New Energy Vehicle (NEV) Taxi Market Size and Forecast, by By Range Capacity (2025-2032)
4.3.1. Less than 150 km
4.3.2. 150–300 km
4.3.3. 300–500 km
4.3.4. 500–700 km
4.3.5. Above 700 km
4.4. New Energy Vehicle (NEV) Taxi Market Size and Forecast, by By End User (2025-2032)
4.4.1. Urban Transportation
4.4.2. Airport Transportation
4.4.3. Corporate/Business Travel
4.4.4. Tourism & Hospitality
4.4.5. Government/Public Transport Services
4.5. New Energy Vehicle (NEV) Taxi Market Size and Forecast, by By Battery Type (2025-2032)
4.5.1. Lithium-ion Battery
4.5.2. Nickel Metal Hydride (NiMH) Battery
4.5.3. Solid-State Battery
4.5.4. Lithium Iron Phosphate (LFP) Battery
4.5.5. Lead Acid Battery
4.6. New Energy Vehicle (NEV) Taxi Market Size and Forecast, by Region (2025-2032)
4.6.1. North America
4.6.2. Europe
4.6.3. Asia Pacific
4.6.4. Middle East and Africa
4.6.5. South America
5. North America New Energy Vehicle (NEV) Taxi Market Size and Forecast by Segmentation (in USD Bn) 2025-2032
5.1. North America New Energy Vehicle (NEV) Taxi Market Size and Forecast, by By Ownership Model (2025-2032)
5.1.1. Fleet Operators
5.1.2. Driver-Owned Vehicles
5.1.3. Aggregator-Owned Fleet
5.1.4. Public-Private Partnerships
5.1.5. Cooperative Ownership
5.2. North America New Energy Vehicle (NEV) Taxi Market Size and Forecast, by By Power Output (2025-2032)
5.2.1. 50–100 kW
5.2.2. Below 50 kW
5.2.3. 100–150 kW
5.2.4. 150–250 kW
5.2.5. Above 250 kW
5.3. North America New Energy Vehicle (NEV) Taxi Market Size and Forecast, by By Range Capacity (2025-2032)
5.3.1. Less than 150 km
5.3.2. 150–300 km
5.3.3. 300–500 km
5.3.4. 500–700 km
5.3.5. Above 700 km
5.4. North America New Energy Vehicle (NEV) Taxi Market Size and Forecast, by By End User (2025-2032)
5.4.1. Urban Transportation
5.4.2. Airport Transportation
5.4.3. Corporate/Business Travel
5.4.4. Tourism & Hospitality
5.4.5. Government/Public Transport Services
5.5. North America New Energy Vehicle (NEV) Taxi Market Size and Forecast, by By Battery Type (2025-2032)
5.5.1. Lithium-ion Battery
5.5.2. Nickel Metal Hydride (NiMH) Battery
5.5.3. Solid-State Battery
5.5.4. Lithium Iron Phosphate (LFP) Battery
5.5.5. Lead Acid Battery
5.6. North America New Energy Vehicle (NEV) Taxi Market Size and Forecast, by Country (2025-2032)
5.6.1. United States
5.6.1.1. United States New Energy Vehicle (NEV) Taxi Market Size and Forecast, by By Ownership Model (2025-2032)
5.6.1.1.1. Fleet Operators
5.6.1.1.2. Driver-Owned Vehicles
5.6.1.1.3. Aggregator-Owned Fleet
5.6.1.1.4. Public-Private Partnerships
5.6.1.1.5. Cooperative Ownership
5.6.1.2. United States New Energy Vehicle (NEV) Taxi Market Size and Forecast, by By Power Output (2025-2032)
5.6.1.2.1. 50–100 kW
5.6.1.2.2. Below 50 kW
5.6.1.2.3. 100–150 kW
5.6.1.2.4. 150–250 kW
5.6.1.2.5. Above 250 kW
5.6.1.3. United States New Energy Vehicle (NEV) Taxi Market Size and Forecast, by By Range Capacity (2025-2032)
5.6.1.3.1. Less than 150 km
5.6.1.3.2. 150–300 km
5.6.1.3.3. 300–500 km
5.6.1.3.4. 500–700 km
5.6.1.3.5. Above 700 km
5.6.1.4. United States New Energy Vehicle (NEV) Taxi Market Size and Forecast, by By End User (2025-2032)
5.6.1.4.1. Urban Transportation
5.6.1.4.2. Airport Transportation
5.6.1.4.3. Corporate/Business Travel
5.6.1.4.4. Tourism & Hospitality
5.6.1.4.5. Government/Public Transport Services
5.6.1.5. United States New Energy Vehicle (NEV) Taxi Market Size and Forecast, by By Battery Type (2025-2032)
5.6.1.5.1. Lithium-ion Battery
5.6.1.5.2. Nickel Metal Hydride (NiMH) Battery
5.6.1.5.3. Solid-State Battery
5.6.1.5.4. Lithium Iron Phosphate (LFP) Battery
5.6.1.5.5. Lead Acid Battery
5.6.2. Canada
5.6.2.1. Canada New Energy Vehicle (NEV) Taxi Market Size and Forecast, by By Ownership Model (2025-2032)
5.6.2.1.1. Fleet Operators
5.6.2.1.2. Driver-Owned Vehicles
5.6.2.1.3. Aggregator-Owned Fleet
5.6.2.1.4. Public-Private Partnerships
5.6.2.1.5. Cooperative Ownership
5.6.2.2. Canada New Energy Vehicle (NEV) Taxi Market Size and Forecast, by By Power Output (2025-2032)
5.6.2.2.1. 50–100 kW
5.6.2.2.2. Below 50 kW
5.6.2.2.3. 100–150 kW
5.6.2.2.4. 150–250 kW
5.6.2.2.5. Above 250 kW
5.6.2.3. Canada New Energy Vehicle (NEV) Taxi Market Size and Forecast, by By Range Capacity (2025-2032)
5.6.2.3.1. Less than 150 km
5.6.2.3.2. 150–300 km
5.6.2.3.3. 300–500 km
5.6.2.3.4. 500–700 km
5.6.2.3.5. Above 700 km
5.6.2.4. Canada New Energy Vehicle (NEV) Taxi Market Size and Forecast, by By End User (2025-2032)
5.6.2.4.1. Urban Transportation
5.6.2.4.2. Airport Transportation
5.6.2.4.3. Corporate/Business Travel
5.6.2.4.4. Tourism & Hospitality
5.6.2.4.5. Government/Public Transport Services
5.6.2.5. Canada New Energy Vehicle (NEV) Taxi Market Size and Forecast, by By Battery Type (2025-2032)
5.6.2.5.1. Lithium-ion Battery
5.6.2.5.2. Nickel Metal Hydride (NiMH) Battery
5.6.2.5.3. Solid-State Battery
5.6.2.5.4. Lithium Iron Phosphate (LFP) Battery
5.6.2.5.5. Lead Acid Battery
5.6.3. Mexico
5.6.3.1. Mexico New Energy Vehicle (NEV) Taxi Market Size and Forecast, by By Ownership Model (2025-2032)
5.6.3.1.1. Fleet Operators
5.6.3.1.2. Driver-Owned Vehicles
5.6.3.1.3. Aggregator-Owned Fleet
5.6.3.1.4. Public-Private Partnerships
5.6.3.1.5. Cooperative Ownership
5.6.3.2. Mexico New Energy Vehicle (NEV) Taxi Market Size and Forecast, by By Power Output (2025-2032)
5.6.3.2.1. 50–100 kW
5.6.3.2.2. Below 50 kW
5.6.3.2.3. 100–150 kW
5.6.3.2.4. 150–250 kW
5.6.3.2.5. Above 250 kW
5.6.3.3. Mexico New Energy Vehicle (NEV) Taxi Market Size and Forecast, by By Range Capacity (2025-2032)
5.6.3.3.1. Less than 150 km
5.6.3.3.2. 150–300 km
5.6.3.3.3. 300–500 km
5.6.3.3.4. 500–700 km
5.6.3.3.5. Above 700 km
5.6.3.4. Mexico New Energy Vehicle (NEV) Taxi Market Size and Forecast, by By End User (2025-2032)
5.6.3.4.1. Urban Transportation
5.6.3.4.2. Airport Transportation
5.6.3.4.3. Corporate/Business Travel
5.6.3.4.4. Tourism & Hospitality
5.6.3.4.5. Government/Public Transport Services
5.6.3.5. Mexico New Energy Vehicle (NEV) Taxi Market Size and Forecast, by By Battery Type (2025-2032)
5.6.3.5.1. Lithium-ion Battery
5.6.3.5.2. Nickel Metal Hydride (NiMH) Battery
5.6.3.5.3. Solid-State Battery
5.6.3.5.4. Lithium Iron Phosphate (LFP) Battery
5.6.3.5.5. Lead Acid Battery
6. Europe New Energy Vehicle (NEV) Taxi Market Size and Forecast by Segmentation (in USD Bn) 2025-2032
6.1. Europe New Energy Vehicle (NEV) Taxi Market Size and Forecast, by By Ownership Model (2025-2032)
6.2. Europe New Energy Vehicle (NEV) Taxi Market Size and Forecast, by By Power Output (2025-2032)
6.3. Europe New Energy Vehicle (NEV) Taxi Market Size and Forecast, by By Range Capacity (2025-2032)
6.4. Europe New Energy Vehicle (NEV) Taxi Market Size and Forecast, by By End User (2025-2032)
6.5. Europe New Energy Vehicle (NEV) Taxi Market Size and Forecast, by By Battery Type (2025-2032)
6.6. Europe New Energy Vehicle (NEV) Taxi Market Size and Forecast, by Country (2025-2032)
6.6.1. United Kingdom
6.6.1.1. United Kingdom New Energy Vehicle (NEV) Taxi Market Size and Forecast, by By Ownership Model (2025-2032)
6.6.1.2. United Kingdom New Energy Vehicle (NEV) Taxi Market Size and Forecast, by By Power Output (2025-2032)
6.6.1.3. United Kingdom New Energy Vehicle (NEV) Taxi Market Size and Forecast, by By Range Capacity (2025-2032)
6.6.1.4. United Kingdom New Energy Vehicle (NEV) Taxi Market Size and Forecast, by By End User (2025-2032)
6.6.1.5. United Kingdom New Energy Vehicle (NEV) Taxi Market Size and Forecast, by By Battery Type (2025-2032)
6.6.2. France
6.6.2.1. France New Energy Vehicle (NEV) Taxi Market Size and Forecast, by By Ownership Model (2025-2032)
6.6.2.2. France New Energy Vehicle (NEV) Taxi Market Size and Forecast, by By Power Output (2025-2032)
6.6.2.3. France New Energy Vehicle (NEV) Taxi Market Size and Forecast, by By Range Capacity (2025-2032)
6.6.2.4. France New Energy Vehicle (NEV) Taxi Market Size and Forecast, by By End User (2025-2032)
6.6.2.5. France New Energy Vehicle (NEV) Taxi Market Size and Forecast, by By Battery Type (2025-2032)
6.6.3. Germany
6.6.3.1. Germany New Energy Vehicle (NEV) Taxi Market Size and Forecast, by By Ownership Model (2025-2032)
6.6.3.2. Germany New Energy Vehicle (NEV) Taxi Market Size and Forecast, by By Power Output (2025-2032)
6.6.3.3. Germany New Energy Vehicle (NEV) Taxi Market Size and Forecast, by By Range Capacity (2025-2032)
6.6.3.4. Germany New Energy Vehicle (NEV) Taxi Market Size and Forecast, by By End User (2025-2032)
6.6.3.5. Germany New Energy Vehicle (NEV) Taxi Market Size and Forecast, by By Battery Type (2025-2032)
6.6.4. Italy
6.6.4.1. Italy New Energy Vehicle (NEV) Taxi Market Size and Forecast, by By Ownership Model (2025-2032)
6.6.4.2. Italy New Energy Vehicle (NEV) Taxi Market Size and Forecast, by By Power Output (2025-2032)
6.6.4.3. Italy New Energy Vehicle (NEV) Taxi Market Size and Forecast, by By Range Capacity (2025-2032)
6.6.4.4. Italy New Energy Vehicle (NEV) Taxi Market Size and Forecast, by By End User (2025-2032)
6.6.4.5. Italy New Energy Vehicle (NEV) Taxi Market Size and Forecast, by By Battery Type (2025-2032)
6.6.5. Spain
6.6.5.1. Spain New Energy Vehicle (NEV) Taxi Market Size and Forecast, by By Ownership Model (2025-2032)
6.6.5.2. Spain New Energy Vehicle (NEV) Taxi Market Size and Forecast, by By Power Output (2025-2032)
6.6.5.3. Spain New Energy Vehicle (NEV) Taxi Market Size and Forecast, by By Range Capacity (2025-2032)
6.6.5.4. Spain New Energy Vehicle (NEV) Taxi Market Size and Forecast, by By End User (2025-2032)
6.6.5.5. Spain New Energy Vehicle (NEV) Taxi Market Size and Forecast, by By Battery Type (2025-2032)
6.6.6. Sweden
6.6.6.1. Sweden New Energy Vehicle (NEV) Taxi Market Size and Forecast, by By Ownership Model (2025-2032)
6.6.6.2. Sweden New Energy Vehicle (NEV) Taxi Market Size and Forecast, by By Power Output (2025-2032)
6.6.6.3. Sweden New Energy Vehicle (NEV) Taxi Market Size and Forecast, by By Range Capacity (2025-2032)
6.6.6.4. Sweden New Energy Vehicle (NEV) Taxi Market Size and Forecast, by By End User (2025-2032)
6.6.6.5. Sweden New Energy Vehicle (NEV) Taxi Market Size and Forecast, by By Battery Type (2025-2032)
6.6.7. Austria
6.6.7.1. Austria New Energy Vehicle (NEV) Taxi Market Size and Forecast, by By Ownership Model (2025-2032)
6.6.7.2. Austria New Energy Vehicle (NEV) Taxi Market Size and Forecast, by By Power Output (2025-2032)
6.6.7.3. Austria New Energy Vehicle (NEV) Taxi Market Size and Forecast, by By Range Capacity (2025-2032)
6.6.7.4. Austria New Energy Vehicle (NEV) Taxi Market Size and Forecast, by By End User (2025-2032)
6.6.7.5. Austria New Energy Vehicle (NEV) Taxi Market Size and Forecast, by By Battery Type (2025-2032)
6.6.8. Rest of Europe
6.6.8.1. Rest of Europe New Energy Vehicle (NEV) Taxi Market Size and Forecast, by By Ownership Model (2025-2032)
6.6.8.2. Rest of Europe New Energy Vehicle (NEV) Taxi Market Size and Forecast, by By Power Output (2025-2032)
6.6.8.3. Rest of Europe New Energy Vehicle (NEV) Taxi Market Size and Forecast, by By Range Capacity (2025-2032)
6.6.8.4. Rest of Europe New Energy Vehicle (NEV) Taxi Market Size and Forecast, by By End User (2025-2032)
6.6.8.5. Rest of Europe New Energy Vehicle (NEV) Taxi Market Size and Forecast, by By Battery Type (2025-2032)
7. Asia Pacific New Energy Vehicle (NEV) Taxi Market Size and Forecast by Segmentation (in USD Bn) 2025-2032
7.1. Asia Pacific New Energy Vehicle (NEV) Taxi Market Size and Forecast, by By Ownership Model (2025-2032)
7.2. Asia Pacific New Energy Vehicle (NEV) Taxi Market Size and Forecast, by By Power Output (2025-2032)
7.3. Asia Pacific New Energy Vehicle (NEV) Taxi Market Size and Forecast, by By Range Capacity (2025-2032)
7.4. Asia Pacific New Energy Vehicle (NEV) Taxi Market Size and Forecast, by By End User (2025-2032)
7.5. Asia Pacific New Energy Vehicle (NEV) Taxi Market Size and Forecast, by By Battery Type (2025-2032)
7.6. Asia Pacific New Energy Vehicle (NEV) Taxi Market Size and Forecast, by Country (2025-2032)
7.6.1. China
7.6.1.1. China New Energy Vehicle (NEV) Taxi Market Size and Forecast, by By Ownership Model (2025-2032)
7.6.1.2. China New Energy Vehicle (NEV) Taxi Market Size and Forecast, by By Power Output (2025-2032)
7.6.1.3. China New Energy Vehicle (NEV) Taxi Market Size and Forecast, by By Range Capacity (2025-2032)
7.6.1.4. China New Energy Vehicle (NEV) Taxi Market Size and Forecast, by By End User (2025-2032)
7.6.1.5. China New Energy Vehicle (NEV) Taxi Market Size and Forecast, by By Battery Type (2025-2032)
7.6.2. S Korea
7.6.2.1. S Korea New Energy Vehicle (NEV) Taxi Market Size and Forecast, by By Ownership Model (2025-2032)
7.6.2.2. S Korea New Energy Vehicle (NEV) Taxi Market Size and Forecast, by By Power Output (2025-2032)
7.6.2.3. S Korea New Energy Vehicle (NEV) Taxi Market Size and Forecast, by By Range Capacity (2025-2032)
7.6.2.4. S Korea New Energy Vehicle (NEV) Taxi Market Size and Forecast, by By End User (2025-2032)
7.6.2.5. S Korea New Energy Vehicle (NEV) Taxi Market Size and Forecast, by By Battery Type (2025-2032)
7.6.3. Japan
7.6.3.1. Japan New Energy Vehicle (NEV) Taxi Market Size and Forecast, by By Ownership Model (2025-2032)
7.6.3.2. Japan New Energy Vehicle (NEV) Taxi Market Size and Forecast, by By Power Output (2025-2032)
7.6.3.3. Japan New Energy Vehicle (NEV) Taxi Market Size and Forecast, by By Range Capacity (2025-2032)
7.6.3.4. Japan New Energy Vehicle (NEV) Taxi Market Size and Forecast, by By End User (2025-2032)
7.6.3.5. Japan New Energy Vehicle (NEV) Taxi Market Size and Forecast, by By Battery Type (2025-2032)
7.6.4. India
7.6.4.1. India New Energy Vehicle (NEV) Taxi Market Size and Forecast, by By Ownership Model (2025-2032)
7.6.4.2. India New Energy Vehicle (NEV) Taxi Market Size and Forecast, by By Power Output (2025-2032)
7.6.4.3. India New Energy Vehicle (NEV) Taxi Market Size and Forecast, by By Range Capacity (2025-2032)
7.6.4.4. India New Energy Vehicle (NEV) Taxi Market Size and Forecast, by By End User (2025-2032)
7.6.4.5. India New Energy Vehicle (NEV) Taxi Market Size and Forecast, by By Battery Type (2025-2032)
7.6.5. Australia
7.6.5.1. Australia New Energy Vehicle (NEV) Taxi Market Size and Forecast, by By Ownership Model (2025-2032)
7.6.5.2. Australia New Energy Vehicle (NEV) Taxi Market Size and Forecast, by By Power Output (2025-2032)
7.6.5.3. Australia New Energy Vehicle (NEV) Taxi Market Size and Forecast, by By Range Capacity (2025-2032)
7.6.5.4. Australia New Energy Vehicle (NEV) Taxi Market Size and Forecast, by By End User (2025-2032)
7.6.5.5. Australia New Energy Vehicle (NEV) Taxi Market Size and Forecast, by By Battery Type (2025-2032)
7.6.6. Indonesia
7.6.6.1. Indonesia New Energy Vehicle (NEV) Taxi Market Size and Forecast, by By Ownership Model (2025-2032)
7.6.6.2. Indonesia New Energy Vehicle (NEV) Taxi Market Size and Forecast, by By Power Output (2025-2032)
7.6.6.3. Indonesia New Energy Vehicle (NEV) Taxi Market Size and Forecast, by By Range Capacity (2025-2032)
7.6.6.4. Indonesia New Energy Vehicle (NEV) Taxi Market Size and Forecast, by By End User (2025-2032)
7.6.6.5. Indonesia New Energy Vehicle (NEV) Taxi Market Size and Forecast, by By Battery Type (2025-2032)
7.6.7. Malaysia
7.6.7.1. Malaysia New Energy Vehicle (NEV) Taxi Market Size and Forecast, by By Ownership Model (2025-2032)
7.6.7.2. Malaysia New Energy Vehicle (NEV) Taxi Market Size and Forecast, by By Power Output (2025-2032)
7.6.7.3. Malaysia New Energy Vehicle (NEV) Taxi Market Size and Forecast, by By Range Capacity (2025-2032)
7.6.7.4. Malaysia New Energy Vehicle (NEV) Taxi Market Size and Forecast, by By End User (2025-2032)
7.6.7.5. Malaysia New Energy Vehicle (NEV) Taxi Market Size and Forecast, by By Battery Type (2025-2032)
7.6.8. Vietnam
7.6.8.1. Vietnam New Energy Vehicle (NEV) Taxi Market Size and Forecast, by By Ownership Model (2025-2032)
7.6.8.2. Vietnam New Energy Vehicle (NEV) Taxi Market Size and Forecast, by By Power Output (2025-2032)
7.6.8.3. Vietnam New Energy Vehicle (NEV) Taxi Market Size and Forecast, by By Range Capacity (2025-2032)
7.6.8.4. Vietnam New Energy Vehicle (NEV) Taxi Market Size and Forecast, by By End User (2025-2032)
7.6.8.5. Vietnam New Energy Vehicle (NEV) Taxi Market Size and Forecast, by By Battery Type (2025-2032)
7.6.9. Taiwan
7.6.9.1. Taiwan New Energy Vehicle (NEV) Taxi Market Size and Forecast, by By Ownership Model (2025-2032)
7.6.9.2. Taiwan New Energy Vehicle (NEV) Taxi Market Size and Forecast, by By Power Output (2025-2032)
7.6.9.3. Taiwan New Energy Vehicle (NEV) Taxi Market Size and Forecast, by By Range Capacity (2025-2032)
7.6.9.4. Taiwan New Energy Vehicle (NEV) Taxi Market Size and Forecast, by By End User (2025-2032)
7.6.9.5. Taiwan New Energy Vehicle (NEV) Taxi Market Size and Forecast, by By Battery Type (2025-2032)
7.6.10. Rest of Asia Pacific
7.6.10.1. Rest of Asia Pacific New Energy Vehicle (NEV) Taxi Market Size and Forecast, by By Ownership Model (2025-2032)
7.6.10.2. Rest of Asia Pacific New Energy Vehicle (NEV) Taxi Market Size and Forecast, by By Power Output (2025-2032)
7.6.10.3. Rest of Asia Pacific New Energy Vehicle (NEV) Taxi Market Size and Forecast, by By Range Capacity (2025-2032)
7.6.10.4. Rest of Asia Pacific New Energy Vehicle (NEV) Taxi Market Size and Forecast, by By End User (2025-2032)
7.6.10.5. Rest of Asia Pacific New Energy Vehicle (NEV) Taxi Market Size and Forecast, by By Battery Type (2025-2032)
8. Middle East and Africa New Energy Vehicle (NEV) Taxi Market Size and Forecast by Segmentation (in USD Bn) 2025-2032
8.1. Middle East and Africa New Energy Vehicle (NEV) Taxi Market Size and Forecast, by By Ownership Model (2025-2032)
8.2. Middle East and Africa New Energy Vehicle (NEV) Taxi Market Size and Forecast, by By Power Output (2025-2032)
8.3. Middle East and Africa New Energy Vehicle (NEV) Taxi Market Size and Forecast, by By Range Capacity (2025-2032)
8.4. Middle East and Africa New Energy Vehicle (NEV) Taxi Market Size and Forecast, by By End User (2025-2032)
8.5. Middle East and Africa New Energy Vehicle (NEV) Taxi Market Size and Forecast, by By Battery Type (2025-2032)
8.6. Middle East and Africa New Energy Vehicle (NEV) Taxi Market Size and Forecast, by Country (2025-2032)
8.6.1. South Africa
8.6.1.1. South Africa New Energy Vehicle (NEV) Taxi Market Size and Forecast, by By Ownership Model (2025-2032)
8.6.1.2. South Africa New Energy Vehicle (NEV) Taxi Market Size and Forecast, by By Power Output (2025-2032)
8.6.1.3. South Africa New Energy Vehicle (NEV) Taxi Market Size and Forecast, by By Range Capacity (2025-2032)
8.6.1.4. South Africa New Energy Vehicle (NEV) Taxi Market Size and Forecast, by By End User (2025-2032)
8.6.1.5. South Africa New Energy Vehicle (NEV) Taxi Market Size and Forecast, by By Battery Type (2025-2032)
8.6.2. GCC
8.6.2.1. GCC New Energy Vehicle (NEV) Taxi Market Size and Forecast, by By Ownership Model (2025-2032)
8.6.2.2. GCC New Energy Vehicle (NEV) Taxi Market Size and Forecast, by By Power Output (2025-2032)
8.6.2.3. GCC New Energy Vehicle (NEV) Taxi Market Size and Forecast, by By Range Capacity (2025-2032)
8.6.2.4. GCC New Energy Vehicle (NEV) Taxi Market Size and Forecast, by By End User (2025-2032)
8.6.2.5. GCC New Energy Vehicle (NEV) Taxi Market Size and Forecast, by By Battery Type (2025-2032)
8.6.3. Nigeria
8.6.3.1. Nigeria New Energy Vehicle (NEV) Taxi Market Size and Forecast, by By Ownership Model (2025-2032)
8.6.3.2. Nigeria New Energy Vehicle (NEV) Taxi Market Size and Forecast, by By Power Output (2025-2032)
8.6.3.3. Nigeria New Energy Vehicle (NEV) Taxi Market Size and Forecast, by By Range Capacity (2025-2032)
8.6.3.4. Nigeria New Energy Vehicle (NEV) Taxi Market Size and Forecast, by By End User (2025-2032)
8.6.3.5. Nigeria New Energy Vehicle (NEV) Taxi Market Size and Forecast, by By Battery Type (2025-2032)
8.6.4. Rest of ME&A
8.6.4.1. Rest of ME&A New Energy Vehicle (NEV) Taxi Market Size and Forecast, by By Ownership Model (2025-2032)
8.6.4.2. Rest of ME&A New Energy Vehicle (NEV) Taxi Market Size and Forecast, by By Power Output (2025-2032)
8.6.4.3. Rest of ME&A New Energy Vehicle (NEV) Taxi Market Size and Forecast, by By Range Capacity (2025-2032)
8.6.4.4. Rest of ME&A New Energy Vehicle (NEV) Taxi Market Size and Forecast, by By End User (2025-2032)
8.6.4.5. Rest of ME&A New Energy Vehicle (NEV) Taxi Market Size and Forecast, by By Battery Type (2025-2032)
9. South America New Energy Vehicle (NEV) Taxi Market Size and Forecast by Segmentation (in USD Bn) 2025-2032
9.1. South America New Energy Vehicle (NEV) Taxi Market Size and Forecast, by By Ownership Model (2025-2032)
9.2. South America New Energy Vehicle (NEV) Taxi Market Size and Forecast, by By Power Output (2025-2032)
9.3. South America New Energy Vehicle (NEV) Taxi Market Size and Forecast, by By Range Capacity (2025-2032)
9.4. South America New Energy Vehicle (NEV) Taxi Market Size and Forecast, by By End User (2025-2032)
9.5. South America New Energy Vehicle (NEV) Taxi Market Size and Forecast, by By Battery Type (2025-2032)
9.6. South America New Energy Vehicle (NEV) Taxi Market Size and Forecast, by Country (2025-2032)
9.6.1. Brazil
9.6.1.1. Brazil New Energy Vehicle (NEV) Taxi Market Size and Forecast, by By Ownership Model (2025-2032)
9.6.1.2. Brazil New Energy Vehicle (NEV) Taxi Market Size and Forecast, by By Power Output (2025-2032)
9.6.1.3. Brazil New Energy Vehicle (NEV) Taxi Market Size and Forecast, by By Range Capacity (2025-2032)
9.6.1.4. Brazil New Energy Vehicle (NEV) Taxi Market Size and Forecast, by By End User (2025-2032)
9.6.1.5. Brazil New Energy Vehicle (NEV) Taxi Market Size and Forecast, by By Battery Type (2025-2032)
9.6.2. Argentina
9.6.2.1. Argentina New Energy Vehicle (NEV) Taxi Market Size and Forecast, by By Ownership Model (2025-2032)
9.6.2.2. Argentina New Energy Vehicle (NEV) Taxi Market Size and Forecast, by By Power Output (2025-2032)
9.6.2.3. Argentina New Energy Vehicle (NEV) Taxi Market Size and Forecast, by By Range Capacity (2025-2032)
9.6.2.4. Argentina New Energy Vehicle (NEV) Taxi Market Size and Forecast, by By End User (2025-2032)
9.6.2.5. Argentina New Energy Vehicle (NEV) Taxi Market Size and Forecast, by By Battery Type (2025-2032)
9.6.3. Rest Of South America
9.6.3.1. Rest Of South America New Energy Vehicle (NEV) Taxi Market Size and Forecast, by By Ownership Model (2025-2032)
9.6.3.2. Rest Of South America New Energy Vehicle (NEV) Taxi Market Size and Forecast, by By Power Output (2025-2032)
9.6.3.3. Rest Of South America New Energy Vehicle (NEV) Taxi Market Size and Forecast, by By Range Capacity (2025-2032)
9.6.3.4. Rest Of South America New Energy Vehicle (NEV) Taxi Market Size and Forecast, by By End User (2025-2032)
9.6.3.5. Rest Of South America New Energy Vehicle (NEV) Taxi Market Size and Forecast, by By Battery Type (2025-2032)
10. Company Profile: Key Players
10.1. Daimler AG
10.1.1. Company Overview
10.1.2. Business Portfolio
10.1.3. Financial Overview
10.1.4. SWOT Analysis
10.1.5. Strategic Analysis
10.1.6. Scale of Operation (small, medium, and large)
10.1.7. Details on Partnership
10.1.8. Regulatory Accreditations and Certifications Received by Them
10.1.9. Awards Received by the Firm
10.1.10. Recent Developments
10.2. AB Volvo
10.3. BYD Auto Co. Ltd.
10.4. Mahindra and Mahindra Limited
10.5. Toyota Motor Corporation
10.6. BMW AG
10.7. Ford Motor Company
10.8. Honda Motor Co. Ltd.
10.9. TATA Motors
10.10. Nissan Motor Corporation
10.11. Volkswagen AG
10.12. General Motors Company
10.13. Hyundai Motor Company
10.14. London Electric Vehicle Company
10.15. BAIC Motor Corporation Ltd.
10.16. Changan Automobile Company Limited
10.17. Beiqi Foton Motor Co. Ltd.
10.18. JAC Motors
10.19. Tesla Inc.
10.20. Groupe Renault
10.21. SAIC Motor Corporation Limited
10.22. Zhejiang Geely Holding Group Co. Ltd.
10.23. GAC Group
10.24. Kia Corporation
10.25. Mitsubishi Motors Corporation
11. Key Findings
12. Industry Recommendations
13. New Energy Vehicle (NEV) Taxi Market: Research Methodology
14. Terms and Glossary

 To know about the Research Methodology:-Request Free Sample Report