Mobile Augmented Reality Market -Industry Structure Evaluation, Demand Drivers Analysis, Regional Growth Analysis and Identification, Competitive Positioning / Landscape Review & Global Market Size Forecast to 2032

31.26%
CAGR (2026-2032)
15.24 USD Bn.
Market Size
317
Report Pages
134
Market Tables

Overview

Mobile Augmented Reality Market size was valued at USD 15.24 Bn. in 2025 and the total revenue is expected to grow at a CAGR of 31.26 % from 2026 to 2032, reaching nearly USD 102.31 Bn.

Mobile Augmented Reality Market Overview:

Mobile Augmented Reality Market is expected to reach USD 102.31 Bn. by 2032. A sort of mobile application that uses and enhances the phone's built-in components to deliver reality-based services and functions. This report focuses on the different segments of the Mobile Augmented Reality market (Type, Offering, Device Type, Application, and Region). The major industry players and regions are thoroughly examined in this report (North America, Asia Pacific, Europe, Middle East & Africa, and South America). It's a thorough examination of today's quick advancements in a variety of industries. The major data analysis for the historical era from 2020 to 2025 is presented using facts and numbers, visualisations, and presentations. The market drivers, restraints, opportunities, and challenges for Mobile Augmented Reality are examined in this report. The MMR report's investment suggestions are based on a thorough examination of the current competitive environment in the Mobile Augmented Reality market.Mobile Augmented Reality Market
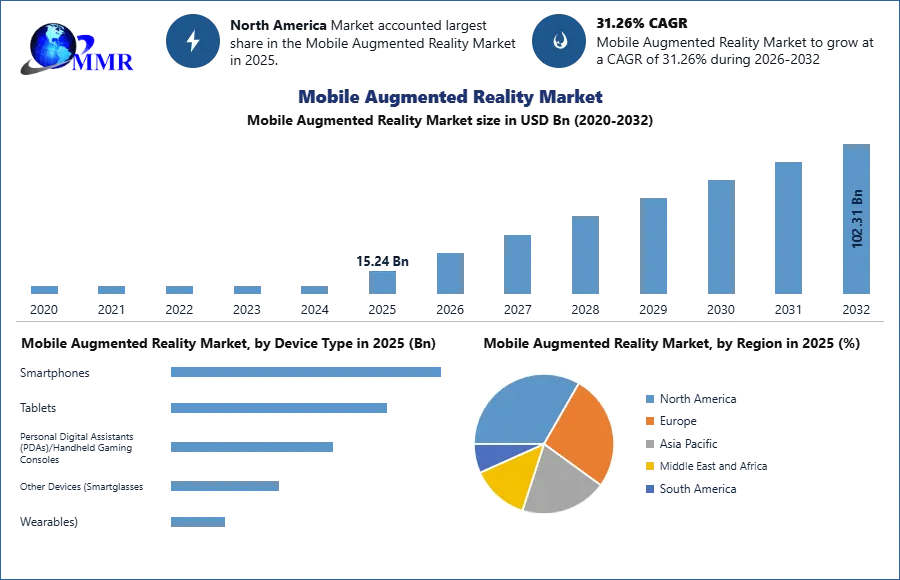
To know about the Research Methodology :- Request Free Sample Report

Mobile Augmented Reality Market Dynamics:

The Healthcare Industry Relies on Smartphone Augmented Reality.

Any medical treatment begins with a diagnosis, which demands precision. Doctors all across the world are requesting a solution that streamlines the process and reduces the risk of wrong diagnosis. An emerging answer for this is augmented reality on mobile phones. Tissue Analytics, a firm based in the United States that combines artificial data with the medical profession, is developing a mobile app that employs augmented reality in mobile phones to identify wounds and encourage proper diagnosis. This type of innovation generates a lot of interest and promotes market growth.

Video Gaming using Augmented Reality.

A game named Serious Game was launched at the 2013 International Conference on Virtual and Augmented Reality in Education, and it consisted of a virtual zoo that was effective in teaching youngsters about animals. Unity 3D and Cinema 4D were utilised in the games, and both are compatible with Android and iOS. The gaming industry is driving the demand for mobile augmented reality. The videogame industry is blossoming with games that include augmented reality in some fashion.

With Augmented Reality Maps, travel becomes easier.

In the realm of augmented reality, Google Inc. has been one of the most experimental firms in the world. AR Core, a Google platform for developing and testing augmented reality apps, has generated a slew of new applications that are altering our perceptions of the environment. One of the most prominent instances is Google Maps' augmented reality AR Visual Positioning System. To use it properly, simply hold your phone up to your eyes, and the software will use the phone camera to provide accurate directions along with pros and drawbacks. The software is designed to be used while travelling rather than while driving. This type of application is causing controversy in the market, encouraging other businesses to produce comparable but equally unique items.

The mobile augmented reality market's main challenge is a lack of consumers. Gamers and tech-savvy consumers flock to products introduced by market leaders, but they are the only ones who can be trusted. People from other domains are briefly interested in the products. One possible solution is to develop more relatable mobile applications that can help people of diverse backgrounds.

Mobile Augmented Reality Market Segment Analysis:

The Mobile Augmented Reality Market is segmented by Type, Offering, Device Type, and Application.

Based on the Offering, the market is segmented into MAR Software (AR application platforms, AR SDKs), and MAR Services (AR Design & Development, Deployment & Support Services). MAR Software (AR application platforms, AR SDKs) segment is expected to hold the largest market share by 2032. The MAR market is expected to rise due to the healthy growth of companies involved in the development of AR SDKs. Many businesses have begun to focus on MAR's enterprise applications and are looking for new business prospects. The ARCore and ARKit mobile AR SDKs built by Google and Apple, respectively, have aided in the mainstream adoption of mobile AR. The main AR apps that have been downloaded by many users are gaming and lifestyle.

Based on the Device Type, the market is segmented into Smartphones, Tablets, Personal Digital Assistants (PDAs)/Handheld Gaming Consoles, and Other Devices (Smartglasses, Wearables). Tablets segment is expected to grow rapidly  during the forecast period 2026-2032. AR applications loaded on tablets are commonly utilised in e-commerce and marketing, gaming, and a variety of other applications. Tablets with their huge screens are ideal for location-based apps. A tablet allows the user to modify the zoom level based on the current speed and switch the screen orientation according to their orientation. Tablets overlay digital content or information onto the real world using GPS and other tracking methods. As a result, gaming apps are more commonly installed on tablets than on smart phones.

Based on the Application, the market is segmented into Consumer (Gaming, Sports & Entertainment), Aerospace & Defense, Healthcare, Commercial (Tourism & Sight-seeing, E-learning, E-commerce & Marketing), Enterprise (Manufacturing), and Others (Architecture & Building Design, Geospatial Mining). Commercial (Tourism & Sight-seeing, E-learning, E-commerce & Marketing) segment is expected to grow rapidly during the forecast period 2026-2032. The e-commerce and marketing industries are booming, due to the benefits it offers buyers and sellers. A buyer can compare products with AR by superimposing virtual graphics in the actual world with the use of a Smartphone or tablet camera. This not only assists a buyer in making informed judgments, but it is also beneficial to a seller. The improved shopping experience benefits the entire retail industry.

Mobile Augmented Reality Market Regional Insights:

The Asia Pacific region is expected to dominate the Mobile Augmented Reality Market during the forecast period 2026-2032. The Asia Pacific region is expected to hold the largest market share by 2032. In recent years, the emergence of many manufacturers and vendors for AR technology-based items in Japan and China has supported the region's MAR market growth. Japan, India, and China are expected to invest heavily in new technical advances as consumer and business uses rise. Because AR technology is readily available in the Asia Pacific region, its adoption in business and consumer applications has increased. The usage of augmented reality technology on smart phones and tablets has aided the region's market growth.

Recent Industry Developments (2025–2026)

Exact Date Company Development Impact
25 February 2026 Google Google released the ARCore for Jetpack XR v1.0.0-alpha11 update, introducing the TiltGesture API for advanced device orientation tracking. The update enhances spatial awareness in mobile AR apps, allowing developers to create more reactive and stable immersive interfaces.
08 December 2025 XREAL and Google The companies unveiled Project Aura, a reference smart glasses platform powered by the Android XR operating system. This collaboration establishes a standardized hardware-software ecosystem for lightweight mobile AR wearables, challenging proprietary AR systems.
29 May 2025 Scopely Scopely officially closed the $3.5 billion acquisition of Niantic’s game business, including the flagship Pokémon GO title. The deal consolidates the location-based AR gaming segment under one of the world's largest mobile publishers to scale monetization and player engagement.
20 May 2025 Google Google launched the Android XR SDK Developer Preview 2, featuring new 26-joint hand tracking and spatial layout tools for Android devices. These features enable controller-free interactions in mobile AR, significantly improving user accessibility and interface naturalism.
14 May 2025 Snap Inc. Snap introduced its next-generation AI-powered Spectacles featuring a Snapdragon processor and native integration with Google Gemini. The integration of multimodal AI into mobile AR hardware allows for real-time object recognition and contextual voice-to-AR assistance.
12 March 2025 Niantic Following its gaming divestiture, Niantic announced the launch of Niantic Spatial Inc., a new entity dedicated to geospatial AI. This strategic pivot focuses on providing world-scale AR mapping data as a service (DaaS) for third-party mobile developers and enterprise clients.

The objective of the report is to present a comprehensive analysis of the Global Mobile Augmented Reality Market to the stakeholders in the industry. The past and current status of the industry with the forecasted market size and trends are presented in the report with the analysis of complicated data in simple language. The report covers all the aspects of the industry with a dedicated study of key players that include market leaders, followers, and new entrants.

PORTER, PESTEL analysis with the potential impact of micro-economic factors of the market has been presented in the report. External as well as internal factors that are supposed to affect the business positively or negatively have been analyzed, which will give a clear futuristic view of the industry to the decision-makers.

The reports also help in understanding the Global Mobile Augmented Reality Market dynamic and structure by analyzing the market segments and projecting the Global Mobile Augmented Reality Market size. Clear representation of competitive analysis of key players by Distribution Channel, price, financial position, product portfolio, growth strategies, and regional presence in the Mobile Augmented Reality Market make the report investor’s guide.

Mobile Augmented Reality Market Scope:Inquire before buying

Mobile Augmented Reality Market
Report Coverage Details
Base Year: 2025 Forecast Period: 2026-2032
Historical Data: 2020 to 2025 Market Size in 2025: 15.24 USD Bn
Forecast Period 2026-2032 CAGR: 31.26% Market Size in 2032: 102.31 USD Bn
Segments Covered: by Type Marker-based (Passive Marker, Active Marker)
Markerless (Model-based, Image Processing-based)
Anchor-based
by Offering MAR Software (AR application platforms, AR SDKs )
MAR Services (AR Design & Development, Deployment & Support Services)
by Device Type Smartphones
Tablets
Personal Digital Assistants (PDAs)/Handheld Gaming Consoles
Other Devices (Smartglasses, Wearables)
by Application Consumer (Gaming, Sports & Entertainment)
Aerospace & Defense
Healthcare
Commercial (Tourism & Sight-seeing, E-learning, E-commerce & Marketing)
Enterprise (Manufacturing)
Others (Architecture & Building Design, Geospatial Mining)

Mobile Augmented Reality Market, by Region

• North America
• Europe
• Asia Pacific
• South America
• Middle East and Africa

Key players/ competitors profile covered in brief in Mobile Augmented Reality Market report in strategic perspective

  1. Google
  2. PTC
  3. Apple
  4. Wikitude
  5. Samsung Electronics
  6. Blippar
  7. MAXST
  8. Magic Leap
  9. Upskill
  10. Atheer
  11. Marxent Labs
  12. Inglobe Technologies
  13. Augment
  14. Niantic
  15. NEXT/NOW
  16. 8ninths
  17. Groove Jones
  18. Qualcomm
  19. Microsoft
  20. Snap Inc.
  21. Meta Platforms
  22. Lenovo Group
  23. Zappar
  24. Vuzix Corporation
  25. Unity Technologies

Table of Contents

1. Mobile Augmented Reality Market Introduction
1.1. Study Assumption and Market Definition
1.2. Scope of the Study
1.3. Executive Summary
2. Global Mobile Augmented Reality Market: Competitive Landscape
2.1. MMR Competition Matrix
2.2. Competitive Landscape
2.3. Key Players Benchmarking
2.3.1. Company Name
2.3.2. Business Segment
2.3.3. End-user Segment
2.3.4. Revenue (2025)
2.3.5. Company Locations
2.4. Leading Mobile Augmented Reality Market Companies, by market capitalization
2.5. Market Structure
2.5.1. Market Leaders
2.5.2. Market Followers
2.5.3. Emerging Players
2.6. Mergers and Acquisitions Details
3. Mobile Augmented Reality Market: Dynamics
3.1. Mobile Augmented Reality Market Trends by Region
3.1.1. North America Mobile Augmented Reality Market Trends
3.1.2. Europe Mobile Augmented Reality Market Trends
3.1.3. Asia Pacific Mobile Augmented Reality Market Trends
3.1.4. Middle East and Africa Mobile Augmented Reality Market Trends
3.1.5. South America Mobile Augmented Reality Market Trends
3.2. Mobile Augmented Reality Market Dynamics by Region
3.2.1. North America
3.2.1.1. North America Mobile Augmented Reality Market Drivers
3.2.1.2. North America Mobile Augmented Reality Market Restraints
3.2.1.3. North America Mobile Augmented Reality Market Opportunities
3.2.1.4. North America Mobile Augmented Reality Market Challenges
3.2.2. Europe
3.2.2.1. Europe Mobile Augmented Reality Market Drivers
3.2.2.2. Europe Mobile Augmented Reality Market Restraints
3.2.2.3. Europe Mobile Augmented Reality Market Opportunities
3.2.2.4. Europe Mobile Augmented Reality Market Challenges
3.2.3. Asia Pacific
3.2.3.1. Asia Pacific Mobile Augmented Reality Market Drivers
3.2.3.2. Asia Pacific Mobile Augmented Reality Market Restraints
3.2.3.3. Asia Pacific Mobile Augmented Reality Market Opportunities
3.2.3.4. Asia Pacific Mobile Augmented Reality Market Challenges
3.2.4. Middle East and Africa
3.2.4.1. Middle East and Africa Mobile Augmented Reality Market Drivers
3.2.4.2. Middle East and Africa Mobile Augmented Reality Market Restraints
3.2.4.3. Middle East and Africa Mobile Augmented Reality Market Opportunities
3.2.4.4. Middle East and Africa Mobile Augmented Reality Market Challenges
3.2.5. South America
3.2.5.1. South America Mobile Augmented Reality Market Drivers
3.2.5.2. South America Mobile Augmented Reality Market Restraints
3.2.5.3. South America Mobile Augmented Reality Market Opportunities
3.2.5.4. South America Mobile Augmented Reality Market Challenges
3.3. PORTER's Five Forces Analysis
3.4. PESTLE Analysis
3.5. Technology Roadmap
3.6. Regulatory Landscape by Region
3.6.1. North America
3.6.2. Europe
3.6.3. Asia Pacific
3.6.4. Middle East and Africa
3.6.5. South America
3.7. Key Opinion Leader Analysis For Mobile Augmented Reality Industry
3.8. Analysis of Government Schemes and Initiatives For Mobile Augmented Reality Industry
3.9. Mobile Augmented Reality Market Trade Analysis
3.10. The Global Pandemic Impact on Mobile Augmented Reality Market
4. Mobile Augmented Reality Market: Global Market Size and Forecast by Segmentation (in USD Bn) 2025-2032
4.1. Mobile Augmented Reality Market Size and Forecast, by Type (2025-2032)
4.1.1. Marker-based (Passive Marker, Active Marker)
4.1.2. Markerless (Model-based, Image Processing-based)
4.1.3. Anchor-based
4.2. Mobile Augmented Reality Market Size and Forecast, by Offering (2025-2032)
4.2.1. MAR Software (AR application platforms, AR SDKs )
4.2.2. MAR Services (AR Design & Development, Deployment & Support Services)
4.3. Mobile Augmented Reality Market Size and Forecast, by Device Type (2025-2032)
4.3.1. Smartphones
4.3.2. Tablets
4.3.3. Personal Digital Assistants (PDAs)/Handheld Gaming Consoles
4.3.4. Other Devices (Smartglasses, Wearables)
4.4. Mobile Augmented Reality Market Size and Forecast, by Application (2025-2032)
4.4.1. Consumer (Gaming, Sports & Entertainment)
4.4.2. Aerospace & Defense
4.4.3. Healthcare
4.4.4. Commercial (Tourism & Sight-seeing, E-learning, E-commerce & Marketing)
4.4.5. Enterprise (Manufacturing)
4.4.6. Others (Architecture & Building Design, Geospatial Mining)
4.5. Mobile Augmented Reality Market Size and Forecast, by Region (2025-2032)
4.5.1. North America
4.5.2. Europe
4.5.3. Asia Pacific
4.5.4. Middle East and Africa
4.5.5. South America
5. North America Mobile Augmented Reality Market Size and Forecast by Segmentation (in USD Bn) 2025-2032
5.1. North America Mobile Augmented Reality Market Size and Forecast, by Type (2025-2032)
5.1.1. Marker-based (Passive Marker, Active Marker)
5.1.2. Markerless (Model-based, Image Processing-based)
5.1.3. Anchor-based
5.2. North America Mobile Augmented Reality Market Size and Forecast, by Offering (2025-2032)
5.2.1. MAR Software (AR application platforms, AR SDKs )
5.2.2. MAR Services (AR Design & Development, Deployment & Support Services)
5.3. North America Mobile Augmented Reality Market Size and Forecast, by Device Type (2025-2032)
5.3.1. Smartphones
5.3.2. Tablets
5.3.3. Personal Digital Assistants (PDAs)/Handheld Gaming Consoles
5.3.4. Other Devices (Smartglasses, Wearables)
5.4. North America Mobile Augmented Reality Market Size and Forecast, by Application (2025-2032)
5.4.1. Consumer (Gaming, Sports & Entertainment)
5.4.2. Aerospace & Defense
5.4.3. Healthcare
5.4.4. Commercial (Tourism & Sight-seeing, E-learning, E-commerce & Marketing)
5.4.5. Enterprise (Manufacturing)
5.4.6. Others (Architecture & Building Design, Geospatial Mining)
5.5. North America Mobile Augmented Reality Market Size and Forecast, by Country (2025-2032)
5.5.1. United States
5.5.1.1. United States Mobile Augmented Reality Market Size and Forecast, by Type (2025-2032)
5.5.1.1.1. Marker-based (Passive Marker, Active Marker)
5.5.1.1.2. Markerless (Model-based, Image Processing-based)
5.5.1.1.3. Anchor-based
5.5.1.2. United States Mobile Augmented Reality Market Size and Forecast, by Offering (2025-2032)
5.5.1.2.1. MAR Software (AR application platforms, AR SDKs )
5.5.1.2.2. MAR Services (AR Design & Development, Deployment & Support Services)
5.5.1.3. United States Mobile Augmented Reality Market Size and Forecast, by Device Type (2025-2032)
5.5.1.3.1. Smartphones
5.5.1.3.2. Tablets
5.5.1.3.3. Personal Digital Assistants (PDAs)/Handheld Gaming Consoles
5.5.1.3.4. Other Devices (Smartglasses, Wearables)
5.5.1.4. United States Mobile Augmented Reality Market Size and Forecast, by Application (2025-2032)
5.5.1.4.1. Consumer (Gaming, Sports & Entertainment)
5.5.1.4.2. Aerospace & Defense
5.5.1.4.3. Healthcare
5.5.1.4.4. Commercial (Tourism & Sight-seeing, E-learning, E-commerce & Marketing)
5.5.1.4.5. Enterprise (Manufacturing)
5.5.1.4.6. Others (Architecture & Building Design, Geospatial Mining)
5.5.2. Canada
5.5.2.1. Canada Mobile Augmented Reality Market Size and Forecast, by Type (2025-2032)
5.5.2.1.1. Marker-based (Passive Marker, Active Marker)
5.5.2.1.2. Markerless (Model-based, Image Processing-based)
5.5.2.1.3. Anchor-based
5.5.2.2. Canada Mobile Augmented Reality Market Size and Forecast, by Offering (2025-2032)
5.5.2.2.1. MAR Software (AR application platforms, AR SDKs )
5.5.2.2.2. MAR Services (AR Design & Development, Deployment & Support Services)
5.5.2.3. Canada Mobile Augmented Reality Market Size and Forecast, by Device Type (2025-2032)
5.5.2.3.1. Smartphones
5.5.2.3.2. Tablets
5.5.2.3.3. Personal Digital Assistants (PDAs)/Handheld Gaming Consoles
5.5.2.3.4. Other Devices (Smartglasses, Wearables)
5.5.2.4. Canada Mobile Augmented Reality Market Size and Forecast, by Application (2025-2032)
5.5.2.4.1. Consumer (Gaming, Sports & Entertainment)
5.5.2.4.2. Aerospace & Defense
5.5.2.4.3. Healthcare
5.5.2.4.4. Commercial (Tourism & Sight-seeing, E-learning, E-commerce & Marketing)
5.5.2.4.5. Enterprise (Manufacturing)
5.5.2.4.6. Others (Architecture & Building Design, Geospatial Mining)
5.5.3. Mexico
5.5.3.1. Mexico Mobile Augmented Reality Market Size and Forecast, by Type (2025-2032)
5.5.3.1.1. Marker-based (Passive Marker, Active Marker)
5.5.3.1.2. Markerless (Model-based, Image Processing-based)
5.5.3.1.3. Anchor-based
5.5.3.2. Mexico Mobile Augmented Reality Market Size and Forecast, by Offering (2025-2032)
5.5.3.2.1. MAR Software (AR application platforms, AR SDKs )
5.5.3.2.2. MAR Services (AR Design & Development, Deployment & Support Services)
5.5.3.3. Mexico Mobile Augmented Reality Market Size and Forecast, by Device Type (2025-2032)
5.5.3.3.1. Smartphones
5.5.3.3.2. Tablets
5.5.3.3.3. Personal Digital Assistants (PDAs)/Handheld Gaming Consoles
5.5.3.3.4. Other Devices (Smartglasses, Wearables)
5.5.3.4. Mexico Mobile Augmented Reality Market Size and Forecast, by Application (2025-2032)
5.5.3.4.1. Consumer (Gaming, Sports & Entertainment)
5.5.3.4.2. Aerospace & Defense
5.5.3.4.3. Healthcare
5.5.3.4.4. Commercial (Tourism & Sight-seeing, E-learning, E-commerce & Marketing)
5.5.3.4.5. Enterprise (Manufacturing)
5.5.3.4.6. Others (Architecture & Building Design, Geospatial Mining)
6. Europe Mobile Augmented Reality Market Size and Forecast by Segmentation (in USD Bn) 2025-2032
6.1. Europe Mobile Augmented Reality Market Size and Forecast, by Type (2025-2032)
6.2. Europe Mobile Augmented Reality Market Size and Forecast, by Offering (2025-2032)
6.3. Europe Mobile Augmented Reality Market Size and Forecast, by Device Type (2025-2032)
6.4. Europe Mobile Augmented Reality Market Size and Forecast, by Application (2025-2032)
6.5. Europe Mobile Augmented Reality Market Size and Forecast, by Country (2025-2032)
6.5.1. United Kingdom
6.5.1.1. United Kingdom Mobile Augmented Reality Market Size and Forecast, by Type (2025-2032)
6.5.1.2. United Kingdom Mobile Augmented Reality Market Size and Forecast, by Offering (2025-2032)
6.5.1.3. United Kingdom Mobile Augmented Reality Market Size and Forecast, by Device Type (2025-2032)
6.5.1.4. United Kingdom Mobile Augmented Reality Market Size and Forecast, by Application (2025-2032)
6.5.2. France
6.5.2.1. France Mobile Augmented Reality Market Size and Forecast, by Type (2025-2032)
6.5.2.2. France Mobile Augmented Reality Market Size and Forecast, by Offering (2025-2032)
6.5.2.3. France Mobile Augmented Reality Market Size and Forecast, by Device Type (2025-2032)
6.5.2.4. France Mobile Augmented Reality Market Size and Forecast, by Application (2025-2032)
6.5.3. Germany
6.5.3.1. Germany Mobile Augmented Reality Market Size and Forecast, by Type (2025-2032)
6.5.3.2. Germany Mobile Augmented Reality Market Size and Forecast, by Offering (2025-2032)
6.5.3.3. Germany Mobile Augmented Reality Market Size and Forecast, by Device Type (2025-2032)
6.5.3.4. Germany Mobile Augmented Reality Market Size and Forecast, by Application (2025-2032)
6.5.4. Italy
6.5.4.1. Italy Mobile Augmented Reality Market Size and Forecast, by Type (2025-2032)
6.5.4.2. Italy Mobile Augmented Reality Market Size and Forecast, by Offering (2025-2032)
6.5.4.3. Italy Mobile Augmented Reality Market Size and Forecast, by Device Type (2025-2032)
6.5.4.4. Italy Mobile Augmented Reality Market Size and Forecast, by Application (2025-2032)
6.5.5. Spain
6.5.5.1. Spain Mobile Augmented Reality Market Size and Forecast, by Type (2025-2032)
6.5.5.2. Spain Mobile Augmented Reality Market Size and Forecast, by Offering (2025-2032)
6.5.5.3. Spain Mobile Augmented Reality Market Size and Forecast, by Device Type (2025-2032)
6.5.5.4. Spain Mobile Augmented Reality Market Size and Forecast, by Application (2025-2032)
6.5.6. Sweden
6.5.6.1. Sweden Mobile Augmented Reality Market Size and Forecast, by Type (2025-2032)
6.5.6.2. Sweden Mobile Augmented Reality Market Size and Forecast, by Offering (2025-2032)
6.5.6.3. Sweden Mobile Augmented Reality Market Size and Forecast, by Device Type (2025-2032)
6.5.6.4. Sweden Mobile Augmented Reality Market Size and Forecast, by Application (2025-2032)
6.5.7. Austria
6.5.7.1. Austria Mobile Augmented Reality Market Size and Forecast, by Type (2025-2032)
6.5.7.2. Austria Mobile Augmented Reality Market Size and Forecast, by Offering (2025-2032)
6.5.7.3. Austria Mobile Augmented Reality Market Size and Forecast, by Device Type (2025-2032)
6.5.7.4. Austria Mobile Augmented Reality Market Size and Forecast, by Application (2025-2032)
6.5.8. Rest of Europe
6.5.8.1. Rest of Europe Mobile Augmented Reality Market Size and Forecast, by Type (2025-2032)
6.5.8.2. Rest of Europe Mobile Augmented Reality Market Size and Forecast, by Offering (2025-2032)
6.5.8.3. Rest of Europe Mobile Augmented Reality Market Size and Forecast, by Device Type (2025-2032)
6.5.8.4. Rest of Europe Mobile Augmented Reality Market Size and Forecast, by Application (2025-2032)
7. Asia Pacific Mobile Augmented Reality Market Size and Forecast by Segmentation (in USD Bn) 2025-2032
7.1. Asia Pacific Mobile Augmented Reality Market Size and Forecast, by Type (2025-2032)
7.2. Asia Pacific Mobile Augmented Reality Market Size and Forecast, by Offering (2025-2032)
7.3. Asia Pacific Mobile Augmented Reality Market Size and Forecast, by Device Type (2025-2032)
7.4. Asia Pacific Mobile Augmented Reality Market Size and Forecast, by Application (2025-2032)
7.5. Asia Pacific Mobile Augmented Reality Market Size and Forecast, by Country (2025-2032)
7.5.1. China
7.5.1.1. China Mobile Augmented Reality Market Size and Forecast, by Type (2025-2032)
7.5.1.2. China Mobile Augmented Reality Market Size and Forecast, by Offering (2025-2032)
7.5.1.3. China Mobile Augmented Reality Market Size and Forecast, by Device Type (2025-2032)
7.5.1.4. China Mobile Augmented Reality Market Size and Forecast, by Application (2025-2032)
7.5.2. S Korea
7.5.2.1. S Korea Mobile Augmented Reality Market Size and Forecast, by Type (2025-2032)
7.5.2.2. S Korea Mobile Augmented Reality Market Size and Forecast, by Offering (2025-2032)
7.5.2.3. S Korea Mobile Augmented Reality Market Size and Forecast, by Device Type (2025-2032)
7.5.2.4. S Korea Mobile Augmented Reality Market Size and Forecast, by Application (2025-2032)
7.5.3. Japan
7.5.3.1. Japan Mobile Augmented Reality Market Size and Forecast, by Type (2025-2032)
7.5.3.2. Japan Mobile Augmented Reality Market Size and Forecast, by Offering (2025-2032)
7.5.3.3. Japan Mobile Augmented Reality Market Size and Forecast, by Device Type (2025-2032)
7.5.3.4. Japan Mobile Augmented Reality Market Size and Forecast, by Application (2025-2032)
7.5.4. India
7.5.4.1. India Mobile Augmented Reality Market Size and Forecast, by Type (2025-2032)
7.5.4.2. India Mobile Augmented Reality Market Size and Forecast, by Offering (2025-2032)
7.5.4.3. India Mobile Augmented Reality Market Size and Forecast, by Device Type (2025-2032)
7.5.4.4. India Mobile Augmented Reality Market Size and Forecast, by Application (2025-2032)
7.5.5. Australia
7.5.5.1. Australia Mobile Augmented Reality Market Size and Forecast, by Type (2025-2032)
7.5.5.2. Australia Mobile Augmented Reality Market Size and Forecast, by Offering (2025-2032)
7.5.5.3. Australia Mobile Augmented Reality Market Size and Forecast, by Device Type (2025-2032)
7.5.5.4. Australia Mobile Augmented Reality Market Size and Forecast, by Application (2025-2032)
7.5.6. Indonesia
7.5.6.1. Indonesia Mobile Augmented Reality Market Size and Forecast, by Type (2025-2032)
7.5.6.2. Indonesia Mobile Augmented Reality Market Size and Forecast, by Offering (2025-2032)
7.5.6.3. Indonesia Mobile Augmented Reality Market Size and Forecast, by Device Type (2025-2032)
7.5.6.4. Indonesia Mobile Augmented Reality Market Size and Forecast, by Application (2025-2032)
7.5.7. Malaysia
7.5.7.1. Malaysia Mobile Augmented Reality Market Size and Forecast, by Type (2025-2032)
7.5.7.2. Malaysia Mobile Augmented Reality Market Size and Forecast, by Offering (2025-2032)
7.5.7.3. Malaysia Mobile Augmented Reality Market Size and Forecast, by Device Type (2025-2032)
7.5.7.4. Malaysia Mobile Augmented Reality Market Size and Forecast, by Application (2025-2032)
7.5.8. Vietnam
7.5.8.1. Vietnam Mobile Augmented Reality Market Size and Forecast, by Type (2025-2032)
7.5.8.2. Vietnam Mobile Augmented Reality Market Size and Forecast, by Offering (2025-2032)
7.5.8.3. Vietnam Mobile Augmented Reality Market Size and Forecast, by Device Type (2025-2032)
7.5.8.4. Vietnam Mobile Augmented Reality Market Size and Forecast, by Application (2025-2032)
7.5.9. Taiwan
7.5.9.1. Taiwan Mobile Augmented Reality Market Size and Forecast, by Type (2025-2032)
7.5.9.2. Taiwan Mobile Augmented Reality Market Size and Forecast, by Offering (2025-2032)
7.5.9.3. Taiwan Mobile Augmented Reality Market Size and Forecast, by Device Type (2025-2032)
7.5.9.4. Taiwan Mobile Augmented Reality Market Size and Forecast, by Application (2025-2032)
7.5.10. Rest of Asia Pacific
7.5.10.1. Rest of Asia Pacific Mobile Augmented Reality Market Size and Forecast, by Type (2025-2032)
7.5.10.2. Rest of Asia Pacific Mobile Augmented Reality Market Size and Forecast, by Offering (2025-2032)
7.5.10.3. Rest of Asia Pacific Mobile Augmented Reality Market Size and Forecast, by Device Type (2025-2032)
7.5.10.4. Rest of Asia Pacific Mobile Augmented Reality Market Size and Forecast, by Application (2025-2032)
8. Middle East and Africa Mobile Augmented Reality Market Size and Forecast by Segmentation (in USD Bn) 2025-2032
8.1. Middle East and Africa Mobile Augmented Reality Market Size and Forecast, by Type (2025-2032)
8.2. Middle East and Africa Mobile Augmented Reality Market Size and Forecast, by Offering (2025-2032)
8.3. Middle East and Africa Mobile Augmented Reality Market Size and Forecast, by Device Type (2025-2032)
8.4. Middle East and Africa Mobile Augmented Reality Market Size and Forecast, by Application (2025-2032)
8.5. Middle East and Africa Mobile Augmented Reality Market Size and Forecast, by Country (2025-2032)
8.5.1. South Africa
8.5.1.1. South Africa Mobile Augmented Reality Market Size and Forecast, by Type (2025-2032)
8.5.1.2. South Africa Mobile Augmented Reality Market Size and Forecast, by Offering (2025-2032)
8.5.1.3. South Africa Mobile Augmented Reality Market Size and Forecast, by Device Type (2025-2032)
8.5.1.4. South Africa Mobile Augmented Reality Market Size and Forecast, by Application (2025-2032)
8.5.2. GCC
8.5.2.1. GCC Mobile Augmented Reality Market Size and Forecast, by Type (2025-2032)
8.5.2.2. GCC Mobile Augmented Reality Market Size and Forecast, by Offering (2025-2032)
8.5.2.3. GCC Mobile Augmented Reality Market Size and Forecast, by Device Type (2025-2032)
8.5.2.4. GCC Mobile Augmented Reality Market Size and Forecast, by Application (2025-2032)
8.5.3. Nigeria
8.5.3.1. Nigeria Mobile Augmented Reality Market Size and Forecast, by Type (2025-2032)
8.5.3.2. Nigeria Mobile Augmented Reality Market Size and Forecast, by Offering (2025-2032)
8.5.3.3. Nigeria Mobile Augmented Reality Market Size and Forecast, by Device Type (2025-2032)
8.5.3.4. Nigeria Mobile Augmented Reality Market Size and Forecast, by Application (2025-2032)
8.5.4. Rest of ME&A
8.5.4.1. Rest of ME&A Mobile Augmented Reality Market Size and Forecast, by Type (2025-2032)
8.5.4.2. Rest of ME&A Mobile Augmented Reality Market Size and Forecast, by Offering (2025-2032)
8.5.4.3. Rest of ME&A Mobile Augmented Reality Market Size and Forecast, by Device Type (2025-2032)
8.5.4.4. Rest of ME&A Mobile Augmented Reality Market Size and Forecast, by Application (2025-2032)
9. South America Mobile Augmented Reality Market Size and Forecast by Segmentation (in USD Bn) 2025-2032
9.1. South America Mobile Augmented Reality Market Size and Forecast, by Type (2025-2032)
9.2. South America Mobile Augmented Reality Market Size and Forecast, by Offering (2025-2032)
9.3. South America Mobile Augmented Reality Market Size and Forecast, by Device Type (2025-2032)
9.4. South America Mobile Augmented Reality Market Size and Forecast, by Application (2025-2032)
9.5. South America Mobile Augmented Reality Market Size and Forecast, by Country (2025-2032)
9.5.1. Brazil
9.5.1.1. Brazil Mobile Augmented Reality Market Size and Forecast, by Type (2025-2032)
9.5.1.2. Brazil Mobile Augmented Reality Market Size and Forecast, by Offering (2025-2032)
9.5.1.3. Brazil Mobile Augmented Reality Market Size and Forecast, by Device Type (2025-2032)
9.5.1.4. Brazil Mobile Augmented Reality Market Size and Forecast, by Application (2025-2032)
9.5.2. Argentina
9.5.2.1. Argentina Mobile Augmented Reality Market Size and Forecast, by Type (2025-2032)
9.5.2.2. Argentina Mobile Augmented Reality Market Size and Forecast, by Offering (2025-2032)
9.5.2.3. Argentina Mobile Augmented Reality Market Size and Forecast, by Device Type (2025-2032)
9.5.2.4. Argentina Mobile Augmented Reality Market Size and Forecast, by Application (2025-2032)
9.5.3. Rest Of South America
9.5.3.1. Rest Of South America Mobile Augmented Reality Market Size and Forecast, by Type (2025-2032)
9.5.3.2. Rest Of South America Mobile Augmented Reality Market Size and Forecast, by Offering (2025-2032)
9.5.3.3. Rest Of South America Mobile Augmented Reality Market Size and Forecast, by Device Type (2025-2032)
9.5.3.4. Rest Of South America Mobile Augmented Reality Market Size and Forecast, by Application (2025-2032)
10. Company Profile: Key Players
10.1. Google
10.1.1. Company Overview
10.1.2. Business Portfolio
10.1.3. Financial Overview
10.1.4. SWOT Analysis
10.1.5. Strategic Analysis
10.1.6. Scale of Operation (small, medium, and large)
10.1.7. Details on Partnership
10.1.8. Regulatory Accreditations and Certifications Received by Them
10.1.9. Awards Received by the Firm
10.1.10. Recent Developments
10.2. PTC
10.3. Apple
10.4. Wikitude
10.5. Samsung Electronics
10.6. Blippar
10.7. MAXST
10.8. Magic Leap
10.9. Upskill
10.10. Atheer
10.11. Marxent Labs
10.12. Inglobe Technologies
10.13. Augment
10.14. Niantic
10.15. NEXT/NOW
10.16. 8ninths
10.17. Groove Jones
10.18. Qualcomm
10.19. Microsoft
10.20. Snap Inc.
10.21. Meta Platforms
10.22. Lenovo Group
10.23. Zappar
10.24. Vuzix Corporation
10.25. Unity Technologies
11. Key Findings
12. Industry Recommendations
13. Mobile Augmented Reality Market: Research Methodology
14. Terms and Glossary

Custom Market Research Services

We Will Customise The Research For You, In Case The Report Listed Above Does Not Meet With Your Requirements