
K-Beauty Products Market By Product Type, By Product Form, By Skin Concern / Claim, By End User, By Price Tier, By Distribution Channel, By Brand Type and Regional Insights 2034
Overview
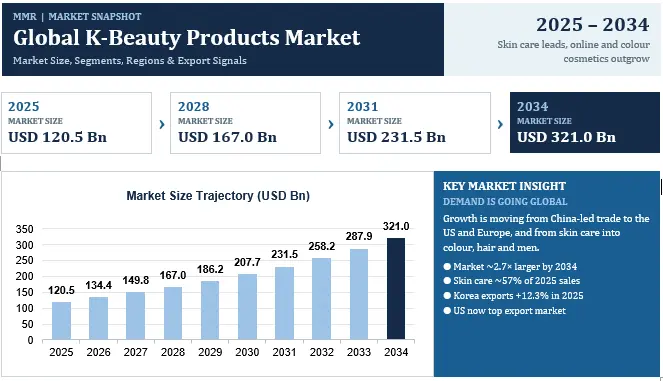
The Global K-Beauty Products Market was valued at USD 120.5 billion in 2025 and is projected to reach USD 321.0 billion by 2034, growing at a CAGR of 11.5% during 2026–2034, according to Maximize Market Research (MMR). K-beauty covers Korean and Korean-inspired skin care, colour cosmetics, hair care, body care and related personal care products sold through online, specialty, mass and department-store channels worldwide.
This report answers both sides of the search: what the market is worth for brands and investors, and what customers want to know, from the Korean skincare routine and best K-beauty brands to ingredients, Korean sunscreen, prices, fake-product checks and where to buy in the US, UK, Europe and India.
Skin care is the anchor of the market, women are the core buyers, and growth is shifting from China-led cross-border trade to a broader base led by the United States and Europe, with online and colour cosmetics growing faster than the market. Korean beauty has moved from a trend to a structural category of global beauty.
Maximize Market Research provides comprehensive analysis of global K-beauty products market size, share, product, end-user, channel and regional segmentation, export flows, competitive landscape, strategic scenarios and growth opportunities. The report helps brands, retailers, investors and contract manufacturers decide which segments, channels and countries to prioritise through 2034.
| 2025 | BASE YEAR | 2034 | FORECAST | GROWTH RATE | LARGEST REGION |
| USD 120.5 Bn | USD 321.0 Bn | 11.5% | North America |
Global K-Beauty Products Market Overview
The market is measured at retail-value level across K-beauty products sold globally, including products made in Korea and those from brands positioned on Korean formulation and routine concepts. The multi-step routine, hydration-led and skin-first formulations, active ingredients such as peptides and probiotics, and the glass-skin ideal are the defining product traits.
Three shifts shape 2026–2034: demand is broadening beyond Asia (North America holds the largest share), retail is moving from marketplace discovery to dedicated stores and shelf partnerships, and products are widening from skin care into colour cosmetics, hair and men's grooming.
K-Beauty Products Market Growth and Share Analysis
To know about the Research Methodology :- Request Free Sample Report
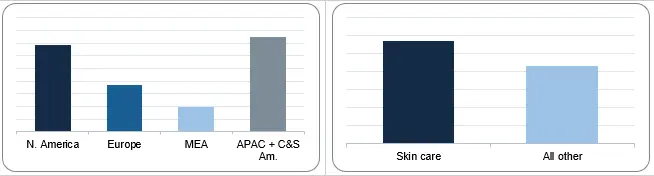
Market Share By Region, 2025 (%) Market Share By Product Type, 2025 (%)
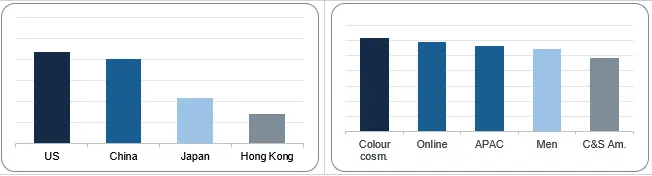
Korea Cosmetics Exports by Destination, 2025 (USD Bn) Published Growth Rates by Segment (CAGR, %)
Sources: MMR analysis; (shares and segment CAGRs, as published); Korea Ministry of Food and Drug Safety (export data, 2025). Annual market values interpolated at constant 11.5% CAGR. Segment CAGRs are source-published figures on the source's own base. Charts are editable (right-click → Edit Data).
K-Beauty Quick Answers: 20 Most-Searched Questions About Korean Beauty Products, Answered in One Line
This report is built around what buyers, brands and investors actually search for. Use this table for instant answers, then jump to the section named in the last column.
| Question people search | Short answer | Section |
| How big is the K-beauty market? | USD 120.5 Bn in 2025 (MMR); USD 321.0 Bn by 2034 at 11.5% CAGR | Market Size |
| How fast is K-beauty growing? | 11.5% CAGR on MMR's base; NielsenIQ reports global K-beauty sales +53% in the year to Jan 2026 | Market Size |
| Which country buys the most K-beauty? | North America leads at 34.4% share; the US is Korea's top export market (USD 2.19 Bn, 2025) | Regional |
| What is K-beauty? | Korean skin care and cosmetics built on hydration, barrier care, gentle actives and daily sun protection | Buyer's Guide |
| What is the Korean 10-step routine? | Oil cleanser, water cleanser, exfoliator, toner, essence, serum, sheet mask, eye cream, moisturiser, sunscreen | Routine |
| Do I need all 10 steps? | No. A 3 to 5-step routine (cleanse, hydrate, treat, moisturise, sunscreen) covers most needs | Routine |
| What is glass skin? | A smooth, translucent, dewy complexion from hydration, barrier care and sunscreen | Glass Skin |
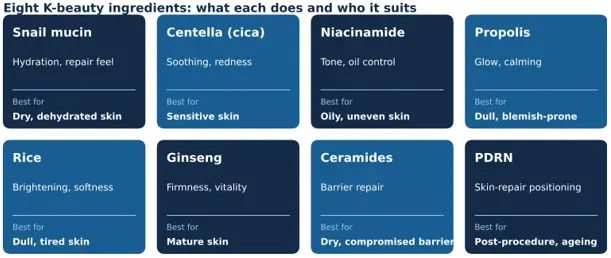
| What are the best K-beauty ingredients? | Snail mucin, centella (cica), niacinamide, propolis, rice, ginseng, ceramides, PDRN, heartleaf | Ingredients |
| What is PDRN? | A DNA-fragment ingredient used for skin repair positioning; the defining K-beauty ingredient of 2026 | Trends 2026 |
| What do SPF and PA mean? | SPF rates UVB (sunburn); PA rates UVA (ageing), from PA+ to PA++++ | Sunscreen |
| Is Korean sunscreen better? | It often feels lighter and uses newer filters, but filter rules differ by country | Sunscreen |
| Which K-beauty brands are best? | COSRX, Beauty of Joseon, Anua, Laneige, SKIN1004, Medicube, Torriden, AESTURA and Sulwhasoo lead 2026 lists | Brands |
| Which brand suits sensitive skin? | Anua, SKIN1004, AESTURA, Illiyoon are commonly recommended | Skin Types |
| How much does K-beauty cost? | Most products sell for about USD 10 to 30, so a 5-step routine is about USD 50 to 150 | Price |
| Where can I buy real K-beauty? | Brand stores, Olive Young, Sephora, Boots, Nykaa and authorised online sellers | Where to Buy |
| How do I spot fake K-beauty? | Buy from authorised sellers, verify batch and brand authentication tools, check the regulatory label; a barcode prefix alone is not proof | Authenticity |
| Is K-beauty good for oily or acne-prone skin? | Yes, with gel textures, niacinamide, BHA and propolis; avoid over-exfoliating | Skin Types |
| Is K-beauty different from J-beauty? | K-beauty is multi-step and innovation-led; J-beauty is minimal and time-tested | K vs J |
| Is K-beauty growing in India? | Yes: MarkNtel sizes India at USD 310 Mn in 2025, growing 18.06% a year to 2032 | India |
| What are the K-beauty trends in 2026? | PDRN, exosomes, barrier ecosystems, dermocosmetics, scalp care and skincare-sunscreens | Trends 2026 |
Sources: MMR analysis; ; NielsenIQ via Cosmetics Business; Korea MFDS; MarkNtel Advisors; Today.com (price band). Answers are general information, not medical advice.
CLUSTER 1 · COMMERCIAL, B2B AND INVESTOR INSIGHTS
Key Findings: Eight Insights Shaping the Global K-Beauty Products Market
MMR's analysis of published market data, Korean export statistics and retail developments points to eight findings that explain where K-beauty value is created through 2034.
| # | Finding | Evidence | So what |
| 1 | The market roughly doubles in about 6.4 years | USD 120.5 Bn (2025) to USD 258.2 Bn (2032) at 11.5% CAGR | Capacity, inventory and retail space must scale about 2.7× by 2034 |
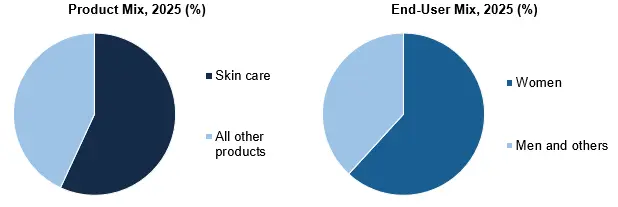
| 2 | Skin care is the core, but not the growth story | Skin care ~56.9% of 2025 sales; colour cosmetics fastest at 12.3% CAGR | Brands built on skin care have a cross-sell runway into makeup |
| 3 | North America is the largest region | 34.4% share in 2025; the US is ~68% of the region | US shelf access now decides brand scale |
| 4 | China has stopped being the engine | Korea's exports to China fell 19.2% in 2025; US overtook China | Diversification is no longer optional |
| 5 | Online grows faster than stores | Online fastest channel at 11.8% CAGR | Social commerce and marketplaces remain the discovery layer |
| 6 | Retail is going physical | Olive Young opened its first US store in May 2026; Sephora K-beauty zones | Offline now amplifies, rather than follows, online |
| 7 | Men are an under-served segment | Men's segment growing at 10.9% CAGR vs women at 61.8% of sales | Grooming-led launches have a low-base advantage |
| 8 | Korea's export base is widening | Exports reached USD 11.43 Bn in 2025 to 202 countries (172 in 2024) | Emerging markets are the next leg after US and Europe |
Global K-Beauty Products Market Size, Share and Forecast, 2025–2034
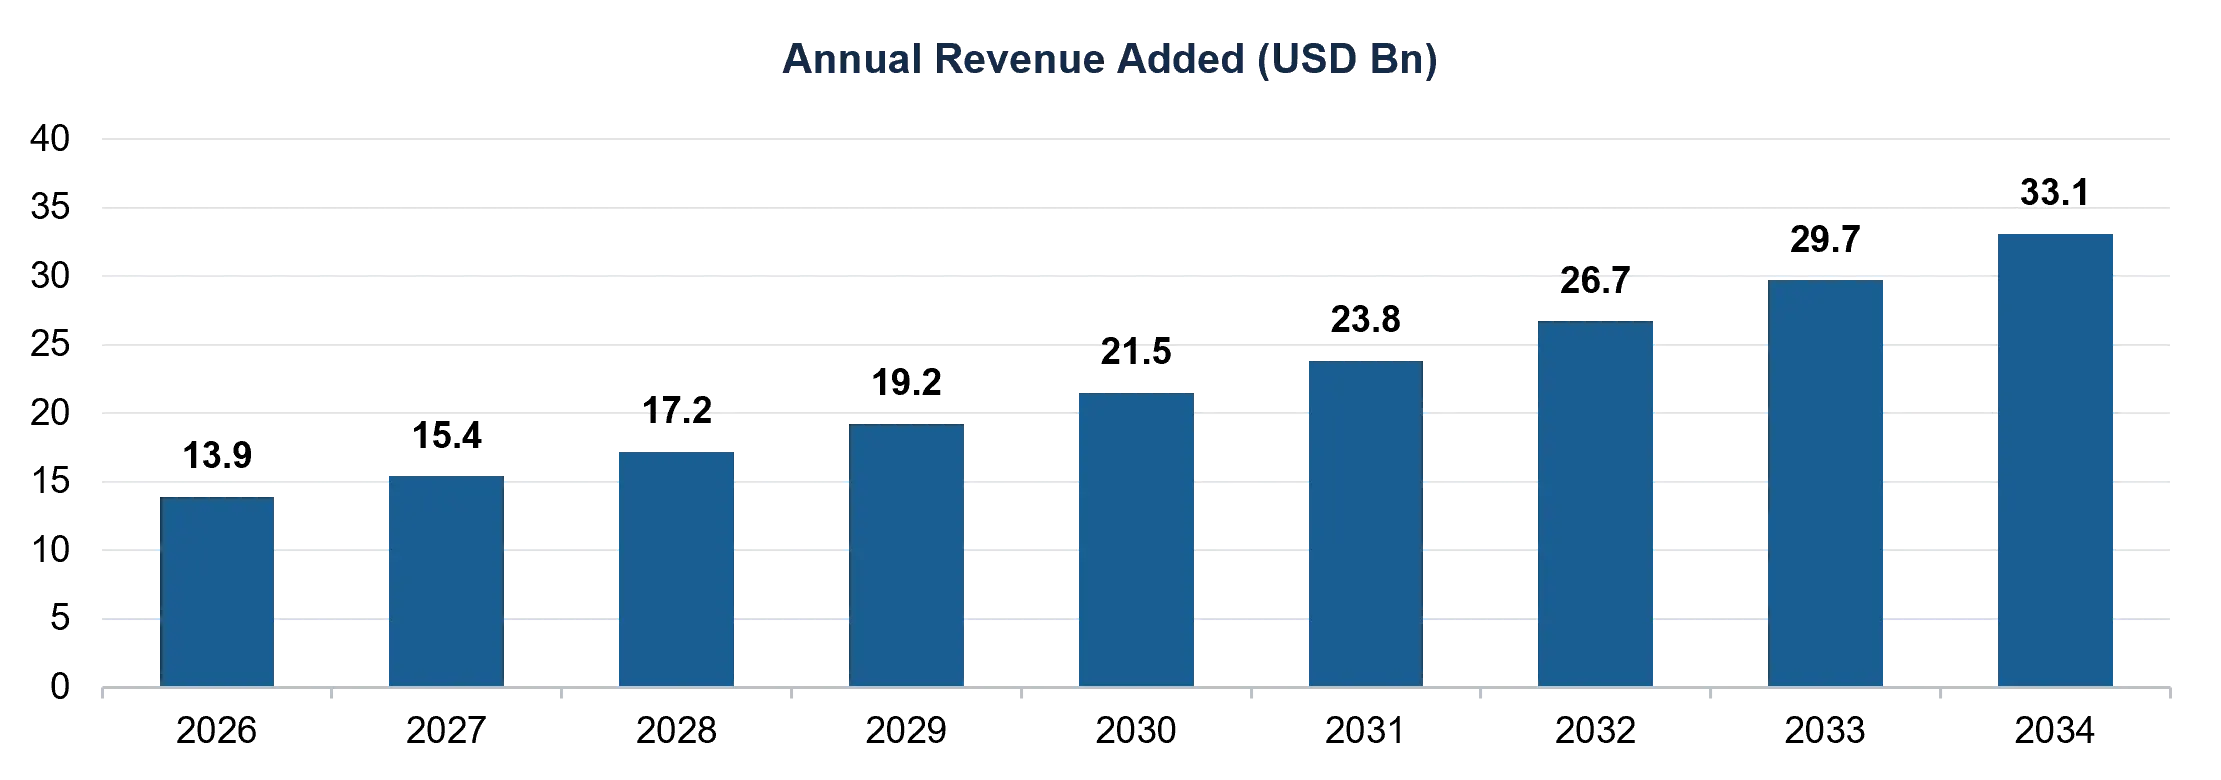
MMR sizes the market at USD 120.5 billion in 2025, rising to USD 134.4 billion in 2026 and USD 321.0 billion in 2034, an 11.5% CAGR. The market adds about USD 200.5 billion over the period; about 62.5% of the 2034 market is revenue that does not exist today.
How Big Is the Global K-Beauty Products Market, and How Fast Is It Growing?
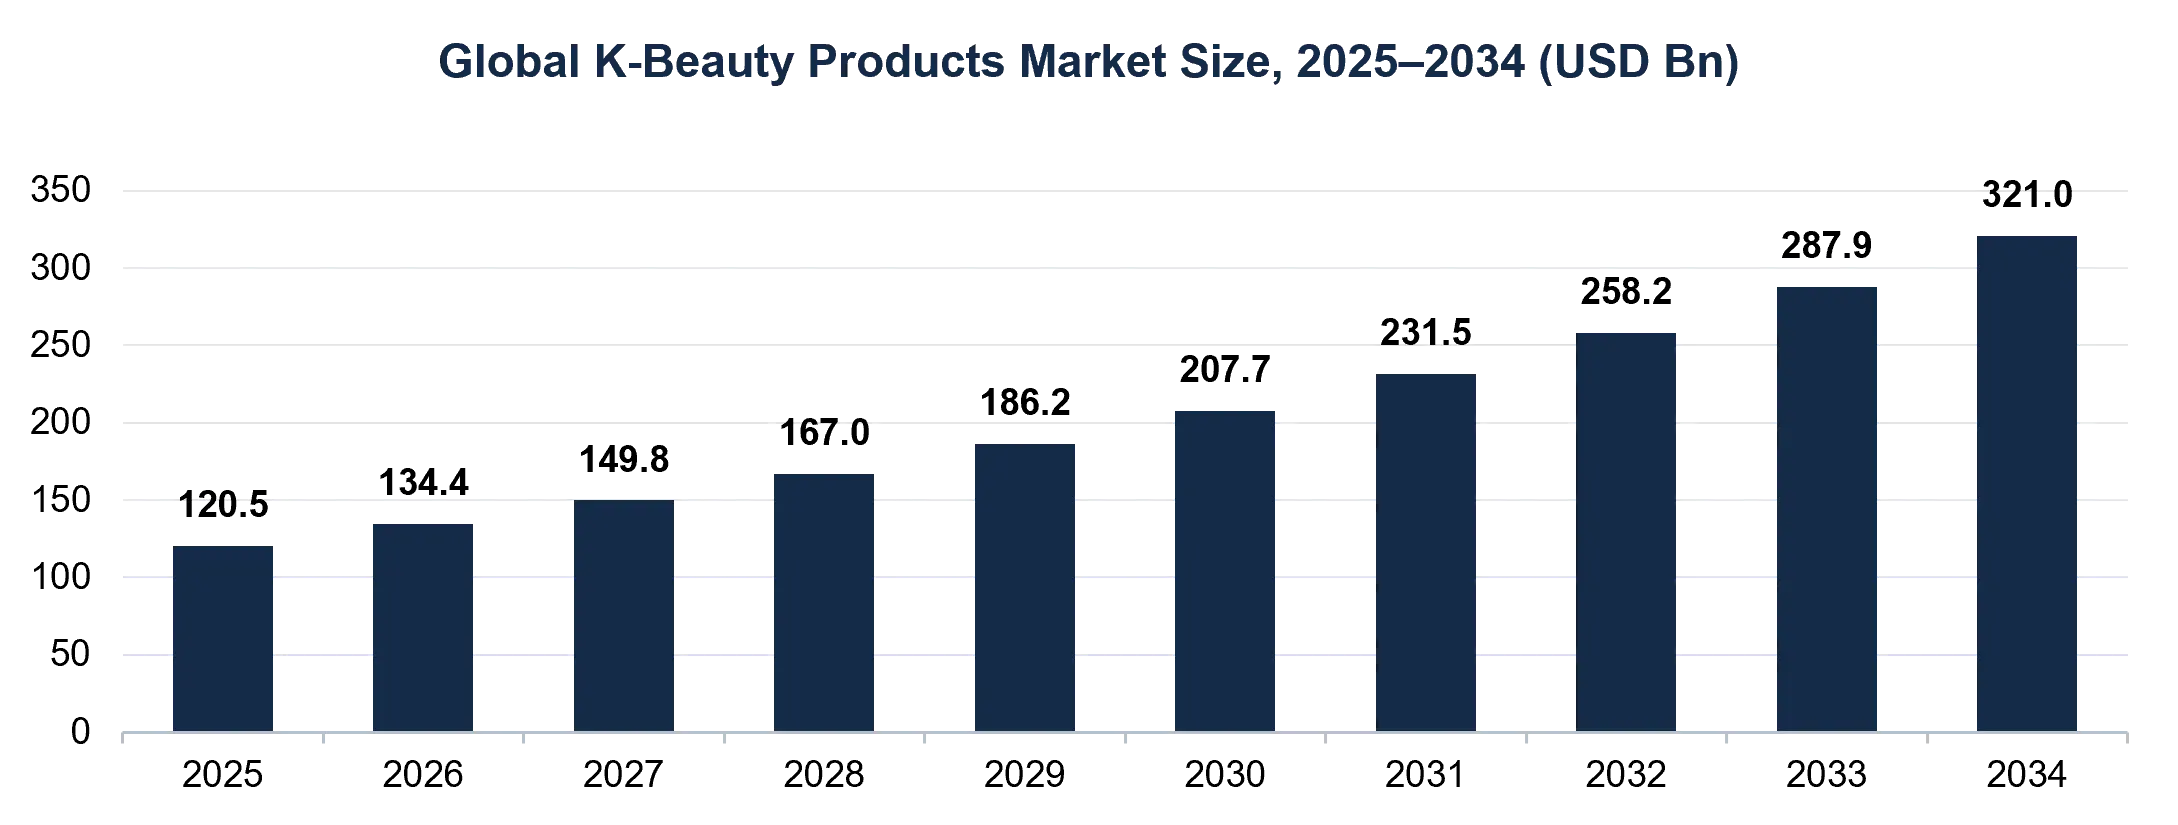
Source: MMR analysis · Year: 2025–2034 · Unit: USD Bn · Estimated. 2025 base USD 120.5 Bn and 11.5% CAGR; annual values are constant-CAGR interpolation, not year-specific forecasts
| MMR READ-THROUGH |
| Annual revenue added rises from USD 13.9 Bn in 2026 to USD 33.1 Bn in 2034. The last three years add USD 89.5 Bn, about 45% of all revenue added over the period. Growth is back-loaded, so capacity decisions made in 2026–2027 carry the largest payoff. |
Why Do K-Beauty Market Size Estimates Differ?
Published K-beauty estimates differ by scope: some count only products made in Korea, others include Korean-inspired brands made elsewhere; some measure manufacturer revenue, others retail value. publishes a 2025 value of about USD 118.3 billion, USD 129.2 billion for 2026 and USD 252.4 billion by 2033 at 10.0% CAGR (2026–2033). MMR's base of USD 120.5 billion and 11.5% CAGR is slightly higher, because it assumes faster US, online and colour-cosmetics growth.
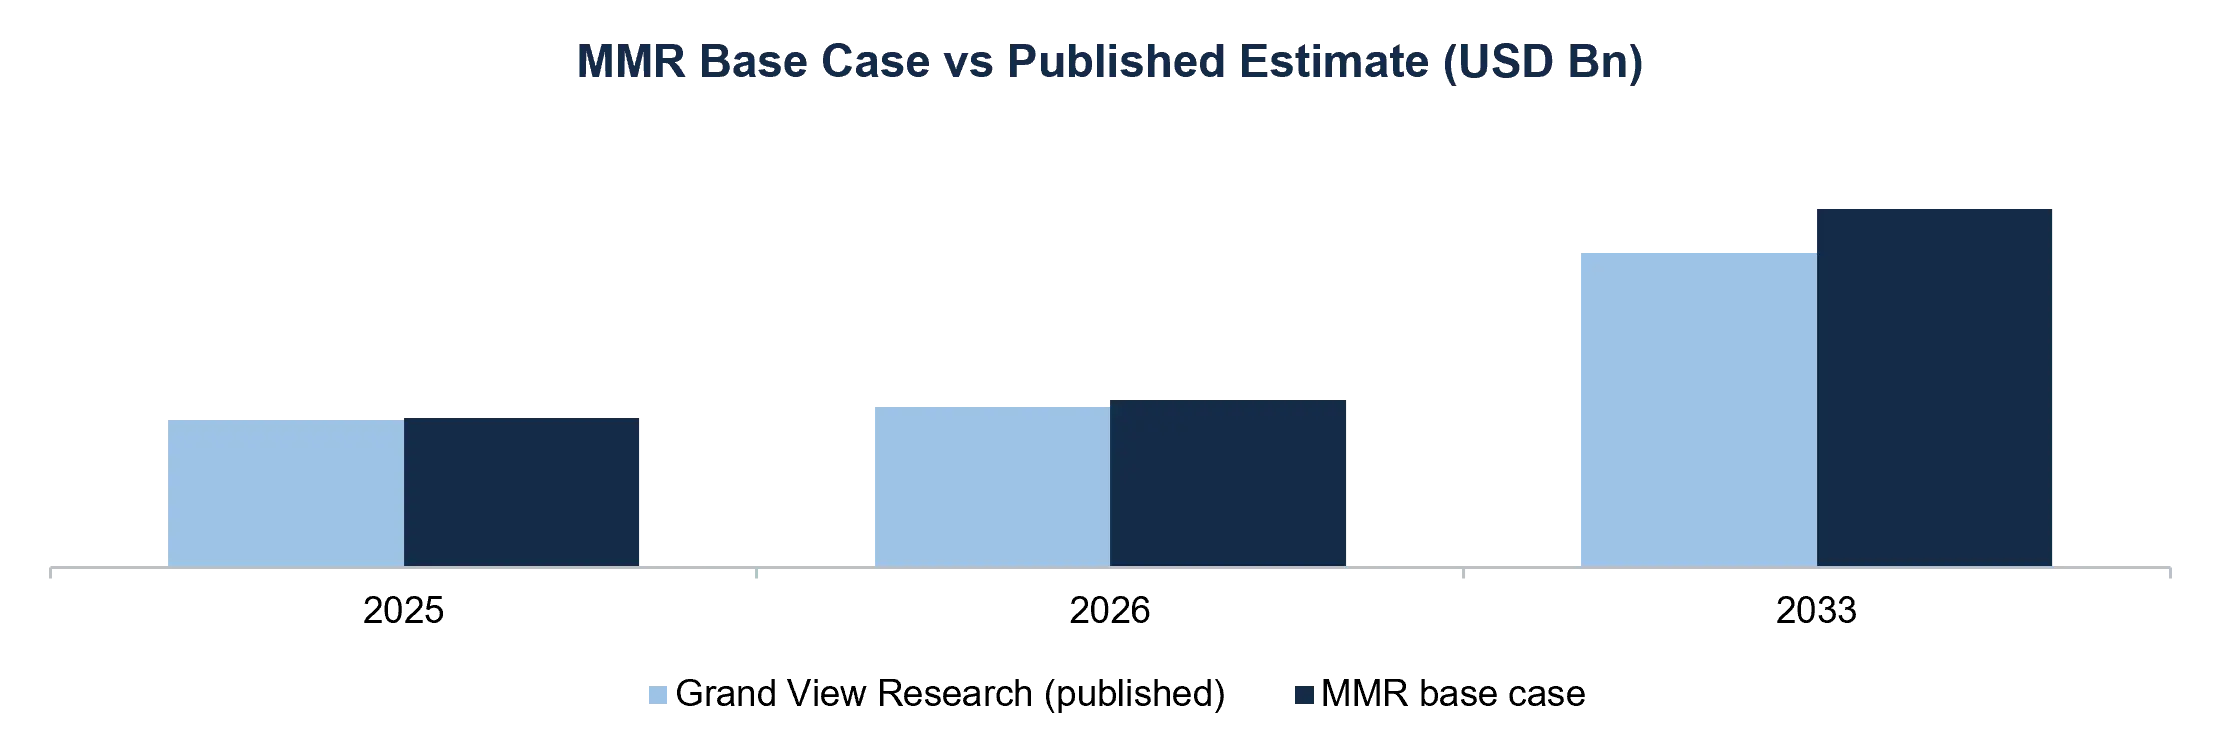 Sources: (K-Beauty Products Market report, as published); MMR analysis. 2033 gap = USD 35.5 Bn (14.1% above the published figure).
Global K-Beauty Products Market Forecast 2034: Bull, Base and Bear Scenarios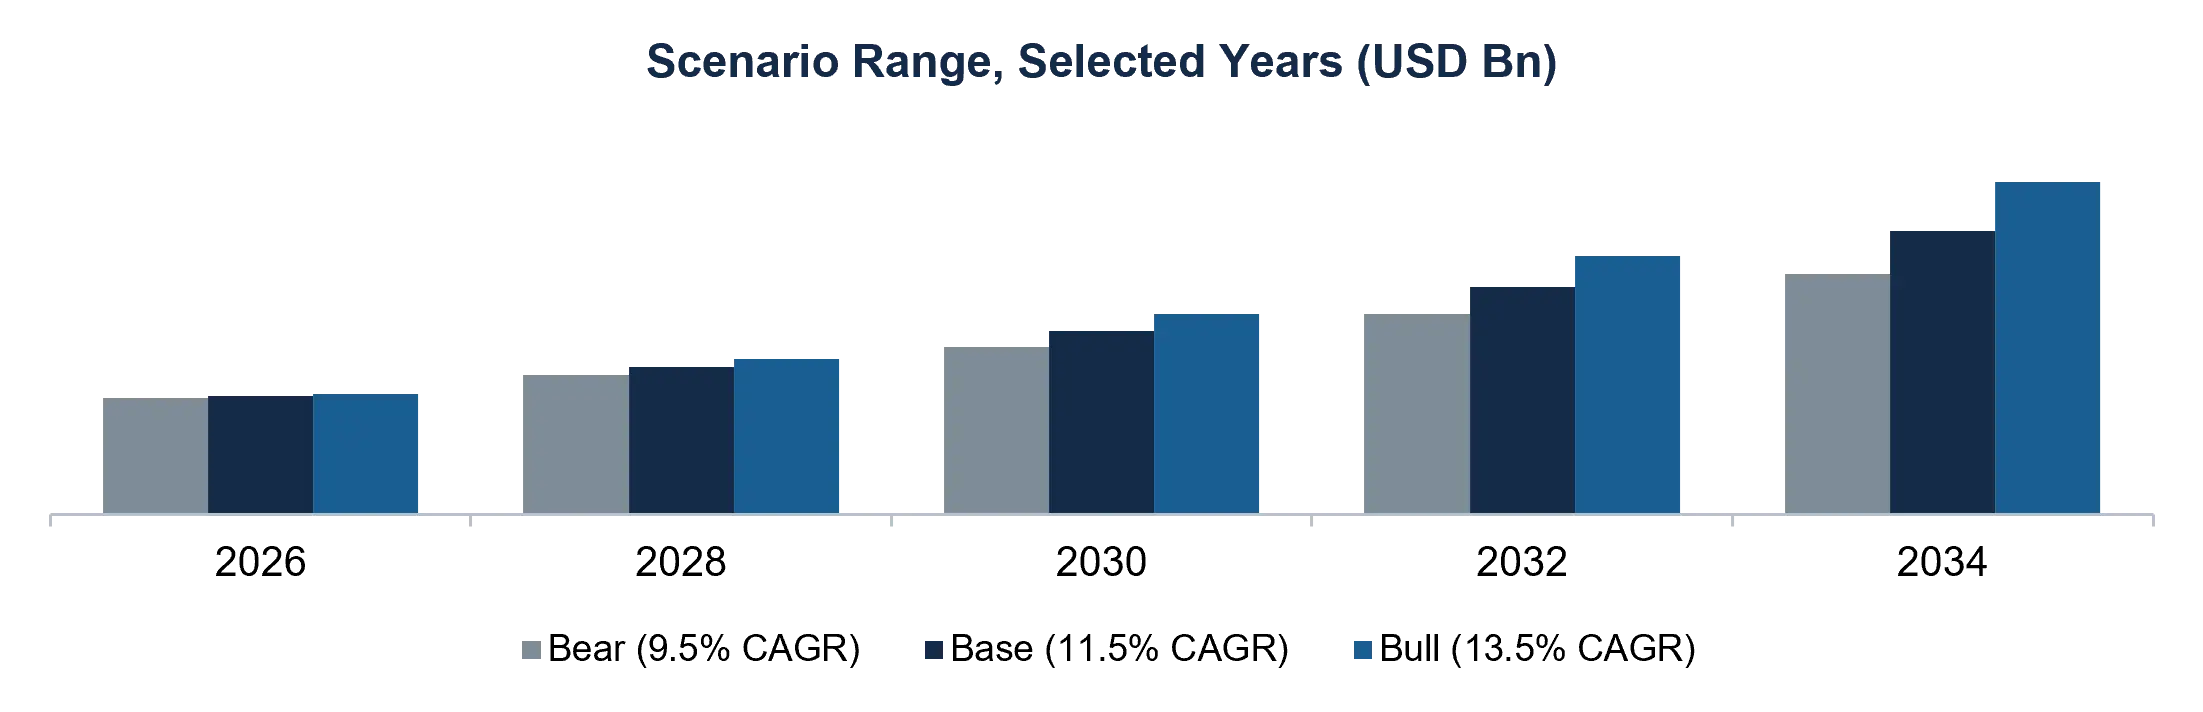
| Scenario | CAGR | 2034 market (USD Bn) | vs base | What would have to be true |
| Bear | 9.5% | 272.7 | -48.3 | US tariff and retail-margin pressure, trend fatigue, slower Europe |
| Base | 11.5% | 321.0 | – | US and Europe scale, online keeps lead, colour and men add share |
| Bull | 13.5% | 376.7 | +55.7 | Emerging-market entry works, store roll-outs succeed, new categories scale |
Source: MMR analysis · Year: Selected years 2026–2034 · Unit: USD Bn · Estimated (MMR judgement). Scenario CAGRs of 9.5%, 11.5% and 13.5% are illustrative sensitivities, not forecasts of specific events
How Sensitive Is the 2034 Market to the Growth Rate?
| CAGR assumed | 9% | 10% | 11% | 11.5% (base) | 12% | 13% |
| 2034 market (USD Bn) | 261.7 | 284.1 | 308.2 | 321.0 | 334.2 | 362.0 |
Source: MMR analysis. Every 1 percentage point of CAGR moves the 2034 market by roughly USD 22–25 Bn.
Global K-Beauty Products Market Dynamics: Growth Drivers, Restraints and Opportunities
Global K-Beauty Products Market Growth Drivers: Culture, Formulation, E-Commerce and Innovation
| Driver | How it adds demand | Evidence / signal |
| Korean pop culture reach | K-pop and K-drama exposure creates awareness and aspiration for Korean skin and makeup routines | Cited by as a primary awareness driver |
| Natural, hydrating, skin-friendly formulations | Demand for gentle, hydrating and sensitive-skin products fits Korean formulation strengths | Multi-step routine and skin-first beauty trend |
| Glass-skin and skin-first beauty | Routine-led purchasing raises products per consumer | Skin care ~56.9% of 2025 sales |
| E-commerce and retailer partnerships | Amazon, Sephora and Olive Young widen access and trial | Online fastest channel (11.8% CAGR); Sephora K-beauty zones |
| Active-ingredient innovation | Peptides, probiotics and dermatology-led claims support premium pricing | Brand launches with derma-cosmetic positioning |
| Rapid product development | Korean contract manufacturers shorten time to market | Korea became the world's second-largest cosmetics exporter in 2025 |
Global K-Beauty Products Market Restraints: Tariffs, Trend Cycles, Counterfeits and Regulation
| Restraint | Why it matters | Mitigation |
| US tariffs on Korean imports | US duty on Korean goods was set at a 15% framework rate in 2025 (Federal Register 2025-21940), then changed through 2026: a threatened 25% in January, a 10% global tariff from February and Section 301 action on 23 July (12.5% net of MFN for Korea). Rates change; confirm the current duty by HTS code | Local fulfilment, US-based contract manufacturing, pricing architecture |
| Trend dependence | Viral demand can fade; hero-product concentration raises volatility | Range extension, routine bundles, repeat-purchase programmes |
| China demand reset | Korean exports to China fell 19.2% in 2025 | Reallocate toward US, Europe, Middle East and Southeast Asia |
| Regulatory divergence | Ingredient, claims and safety rules differ across the EU, US and Asia | Region-specific reformulation and compliance teams |
| Counterfeits and parallel trade | Dilute brand equity on marketplaces | Authorised-seller programmes, retailer partnerships |
| Competition from 'K-beauty-inspired' brands | Western and Asian brands copy routines and formats | Authenticity, ingredient science and speed |
Sources: MMR analysis; Personal Care Insights; Korea Ministry of Food and Drug Safety. Qualitative assessment unless stated.
What Are the Biggest K-Beauty Market Opportunities Through 2034?
| Opportunity | Basis | Illustrative size lever |
| Colour cosmetics | Fastest product segment at 12.3% CAGR | Cross-sell makeup to skin-care loyalists |
| Men's K-beauty | Men's segment growing at 10.9% CAGR from a base of ~38% of sales for men and others | Grooming, sun care and acne routines |
| Online and social commerce | Online fastest channel at 11.8% CAGR | Direct-to-consumer, live commerce, marketplace storefronts |
| Asia Pacific | 11.3% CAGR; China ~34.6% of the region | India, Southeast Asia and Japan beyond China |
| Europe and the Middle East | Europe 18.3% share; MEA 9.9% share; UAE and Poland entered Korea's top ten export markets | Boots, Sephora, Douglas and regional distributors |
| Hair and scalp care | Korean hair-care exports reached record highs | Scalp-health positioning and salon formats |
Global K-Beauty Products Market Segment Analysis:
K-Beauty Market by Product Type: Skin Care, Colour Cosmetics, Hair Care and Body Care
K-Beauty Market by Distribution Channel: Online, Specialty Stores and Mass Retail
Online is the fastest-growing channel at an 11.8% CAGR, supported by marketplaces, brand sites and social commerce. Offline beauty specialty stores and mass retailers remain the main trial points; the source report attributes the leading offline share to different formats in different sections, so MMR does not rely on that single figure.
| Segment | 2025 share / basis | Growth signal | MMR view |
| Skin care | ~56.9% (≈ USD 68.6 Bn est.) | Core, steady | Defend the base, add routine bundles |
| Colour cosmetics | Smaller base | 12.3% CAGR (fastest) | Largest share gain over 2026–2034 |
| Women | ~61.8% (≈ USD 74.5 Bn est.) | Core | Premium and derma-led trading up |
| Men | Part of ~38.2% balance | 10.9% CAGR | Low base, high headroom |
| Online | Fastest channel | 11.8% CAGR | Discovery and repeat purchase |
| Offline specialty | Trial and discovery | Store roll-outs 2026 | Amplifier for online brands |
Source; MMR cartography · Year: 2025 (share) and 2026–2033 (CAGR) · Unit: % share of 2025 market, or % projected CAGR as labelled on each region · Published. Colour identifies the region; each label shows either 2025 share (North America, Europe, MEA) or projected CAGR (Asia Pacific, Central & South America). The two are not comparable
| Region | 2025 share | Est. 2025 value (USD Bn) | Growth signal | Notes |
| North America | 34.4% | 41.5 | Largest region | US ~68% of regional revenue (≈ 23% of global) |
| Europe | 18.3% | 22.1 | Fast-rising retail access | UK ~42.6% of regional revenue |
| Middle East & Africa | 9.9% | 11.9 | Emerging | UAE a top-ten Korean export destination |
| Asia Pacific | Part of 37.4% balance | – | 11.3% CAGR | China ~34.6% of the region |
| Central & South America | Part of 37.4% balance | – | 9.7% CAGR | Early-stage distribution |
Source: MMR analysis. Asia Pacific and Central & South America share a combined 37.4% in the published split; individual shares are not disclosed, so MMR does not estimate them.
Korea's K-Beauty Export Signal: Where Korean Cosmetics Are Selling
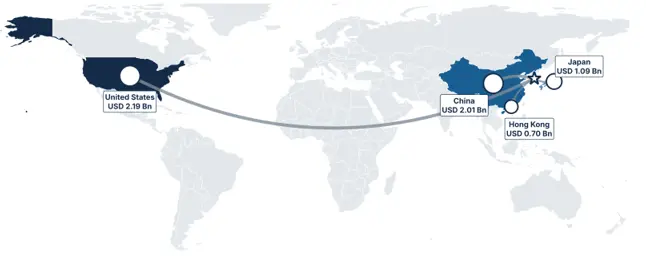 Source: Korea Ministry of Food and Drug Safety; MMR cartography · Year: 2025 · Unit: USD Bn export value · Published. Arrow width reflects export value
| Indicator | Value | Source |
| Korea cosmetics exports, 2025 | USD 11.43 Bn (+12.3% vs 2024) | MFDS |
| Top destination | United States: USD 2.19 Bn (+15.1%), 19.1% of exports | MFDS / Cosmetics Design Asia |
| China | USD 2.01 Bn (−19.2%) | MFDS |
| Japan / Hong Kong | USD 1.09 Bn (+5%) / USD 0.71 Bn (+21.6%) | IANS / MFDS |
| Destination countries | 202 in 2025 vs 172 in 2024 | MFDS |
| Global rank | Second-largest cosmetics exporter after France | Personal Care Insights / Herald |
| H1 2026 exports | About USD 7 Bn (+27.3% year on year) | Personal Care Insights |
Export data measures Korean-made products leaving Korea at export value and is a leading indicator, not a retail market-size measure.
K-Beauty Market in India: Size, Growth, Online Share and Outlook
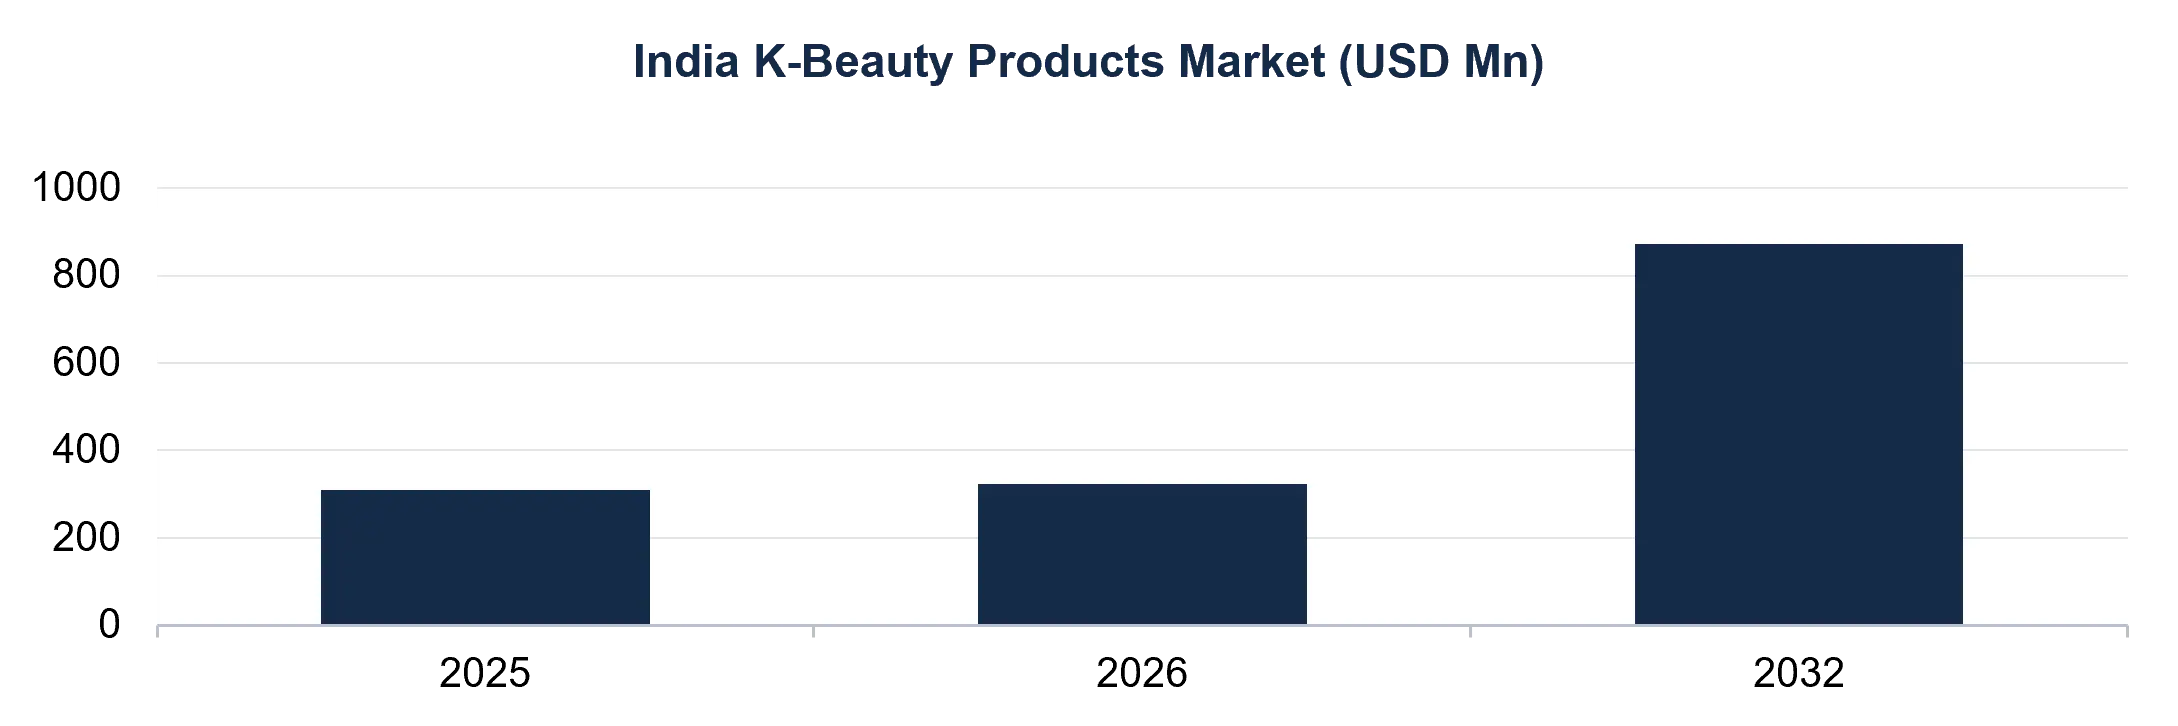
India is small today but one of the fastest-growing K-beauty markets. MarkNtel Advisors sizes India K-beauty at USD 310 million in 2025, USD 322 million in 2026 and USD 872 million by 2032 (18.06% CAGR 2026–2032). Another published forecast puts 2026 at USD 335 million and 2034 at USD 1.36 billion (19.17% CAGR). Both are far below the global total, so India is about 0.26% of the global K-beauty market in 2025 on MMR's base, a headroom story rather than a scale story.
| India indicator | Published value | Source |
| Market size 2025 / 2026 / 2032 | USD 310 Mn / 322 Mn / 872 Mn | MarkNtel Advisors |
| Alternative forecast 2026 / 2034 | USD 335 Mn / USD 1,362.6 Mn (19.17% CAGR) | ReportCubes |
| Facial skin care share | About 65% (MarkNtel scope) vs 42.8% (ReportCubes scope) | MarkNtel; ReportCubes |
| Online share of revenue | About 61.5% | ReportCubes |
| Leading region | South India (about 33–34% share) | Expert Market Research; ReportCubes |
| K-beauty vs overall beauty growth | K-beauty about 25.9% a year vs about 12% for India beauty and personal care | Maeil Business via ANI (Sep 2025) |
| Key retail channels | Nykaa, Blinkit and other quick-commerce apps | Outlook India (Jun 2026) |
| India drivers | India challenges |
| Pollution-driven demand for protective skin care; skinimalism and functional products; young, digital consumers; premium trading up; Korea–India trade partnership sourcing | Import duties and complex cosmetic regulation; higher landed prices; counterfeits; local Korean-inspired brands at lower prices; climate and skin-tone fit (humidity, pigmentation, sun) |
Global K-Beauty Products Market Value Chain and Profit Pool: Where Does the Money Sit?
K-beauty value is split across five layers. Contract manufacturers formulate and produce a large share of indie-brand product, brand owners control demand and pricing, and retailers and platforms control discovery and shelf access. Reported operating margins show where profit concentrates: fast-growing independent brand owners report the highest margins, manufacturers earn lower but steadier margins, and legacy groups sit lowest. See also: K-Beauty ODM and OEM Ecosystem; K-Beauty Companies and Competitive Landscape.
K-Beauty Value Chain: Ingredients, ODM Manufacturing, Brand Owners and Retail
| Layer | Who | Role in value creation | Reported operating margin |
| 1. Ingredients and packaging | Specialty ingredient and packaging suppliers | Actives (PDRN, centella, peptides), textures, packs | Not reported on a comparable basis |
| 2. ODM / OEM manufacturing | Cosmax, Kolmar Korea, Cosmecca Korea, C&C International | Formulation, sampling, production, regulatory dossiers | Cosmax 9.8% (Q2 2025); Kolmar Korea cosmetics ODM 11.9% (Q1 2026) |
| 3. Independent and portfolio brand owners | APR (Medicube), The Founders (Anua), Goodai Global | Concept, marketing, pricing, social-first launches | APR 24.0%; Goodai Global 18.6%; The Founders 18.0% (2025) |
| 4. Legacy brand groups | AMOREPACIFIC, LG H&H | Multi-brand scale, R&D, duty-free and department-store legacy | AMOREPACIFIC Group 8.0%; LG H&H group 2.7% (2025) |
| 5. Retail, distribution and platforms | Olive Young, Sephora, Boots, Douglas, Amazon, TikTok Shop | Discovery, curation, last-mile and traffic | Not comparable; Amazon holds 44% of US K-beauty category spending (Numerator) |
K-Beauty Profit Pool: Operating Margin by Player, 2025
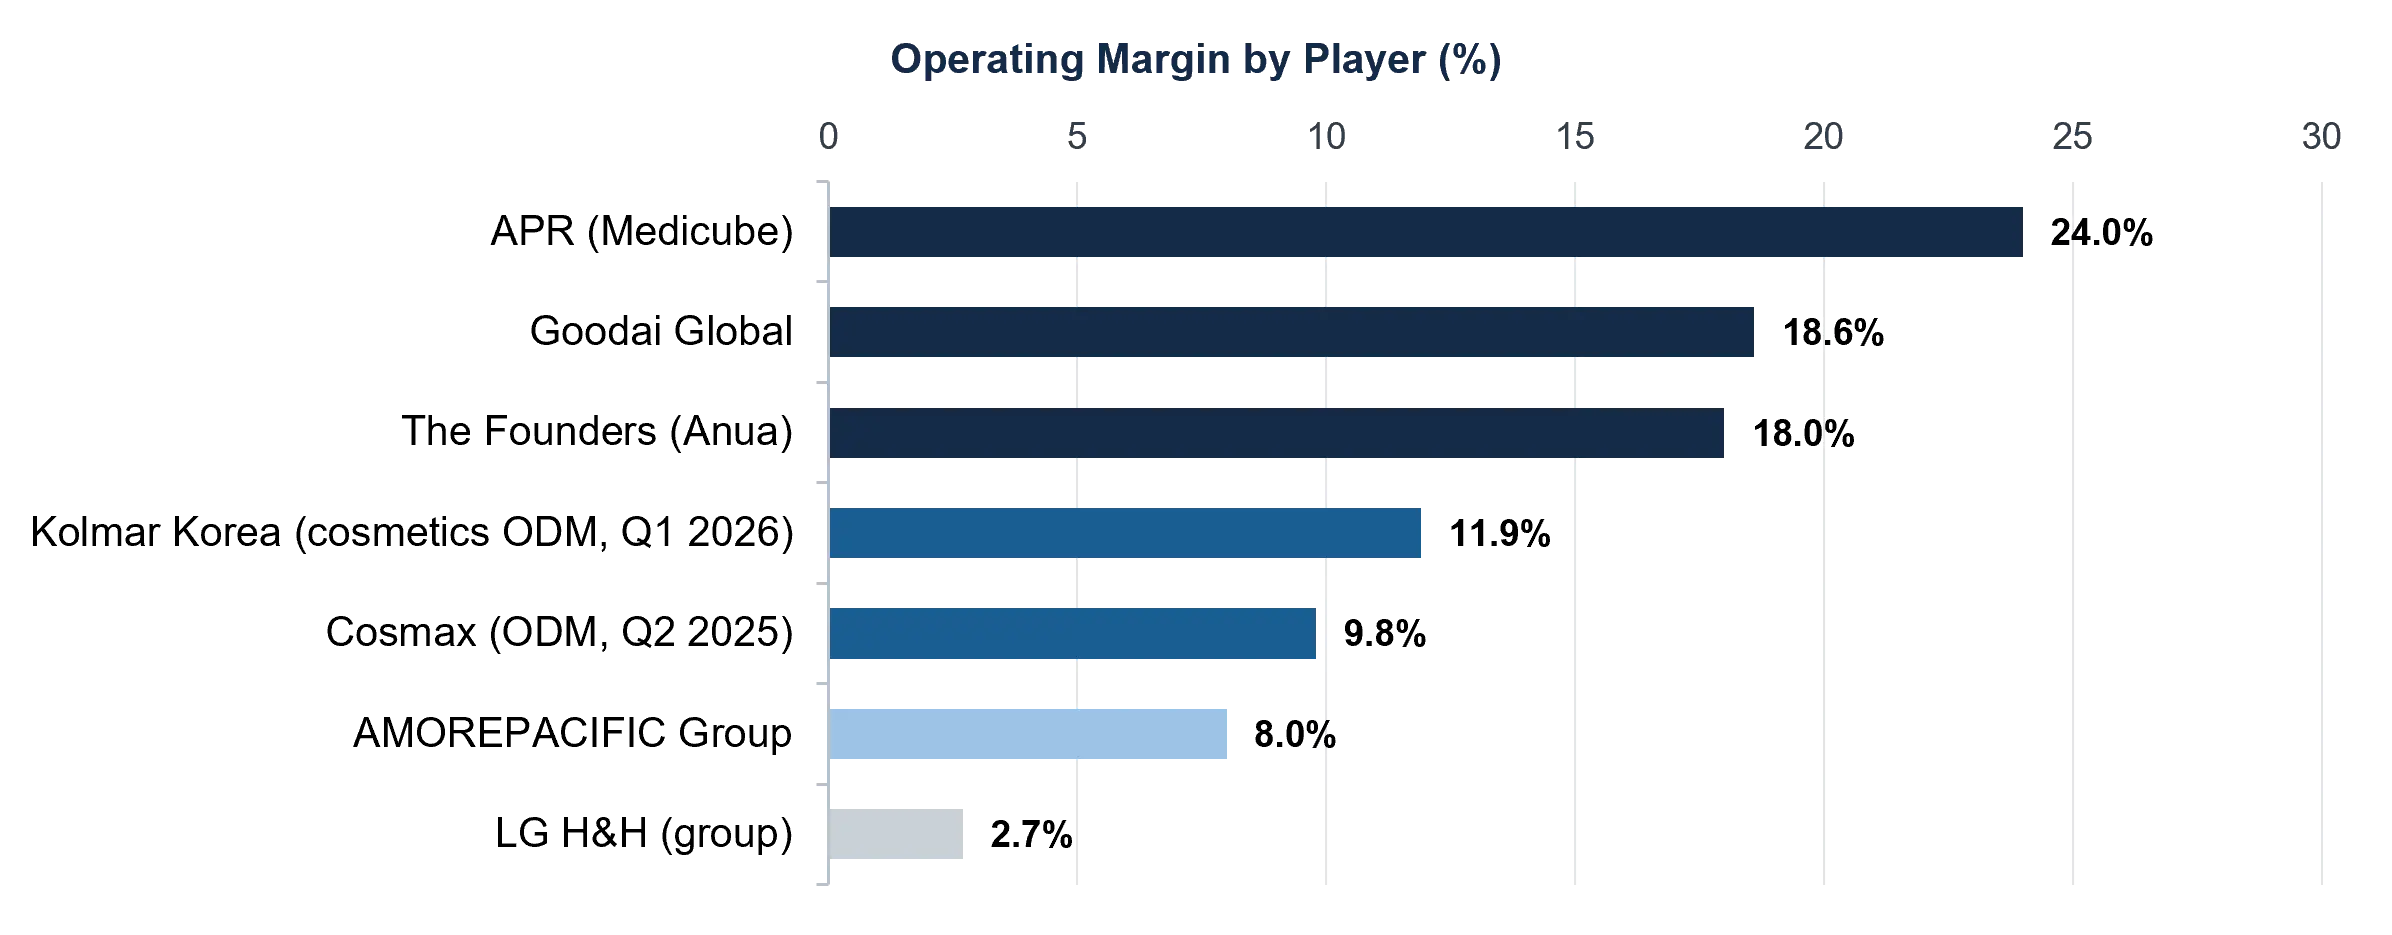 Source: Company disclosures via Korea Times, Asiae, Quartr, Personal Care Insights; Seoulz (The Founders, Goodai Global); MMR calculation · Year: FY2025 (ODMs: Q2 2025 and Q1 2026) · Unit: Operating margin, % · Published inputs, MMR-calculated ratio. Margins are not strictly comparable: LG H&H and AMOREPACIFIC include non-beauty or restructuring effects, and The Founders and Goodai figures are press reports
| MMR READ-THROUGH |
| The highest margins sit with brand owners that combine fast growth with outsourced manufacturing. Legacy groups carry store, duty-free and restructuring costs. For an entrant, the practical route is asset-light brand ownership with an ODM partner rather than building a factory (MMR judgement). |
K-Beauty Companies and Competitive Landscape:
Who Are the Top K-Beauty Brands and Players in the Global K-Beauty Products Market?
Top K-Beauty Companies: Direct Competitors, Retailers, ODMs and Institutions
MMR separates participants by role, because a brand owner, a retailer and a regulator do not compete with each other.
| Group | Examples | Role |
| Direct competitors: legacy groups | AMOREPACIFIC (Laneige, Sulwhasoo, Innisfree, AESTURA, COSRX), LG H&H (The Whoo, The Face Shop), Able C&C, Clio | Scale, R&D, global retail relationships |
| Direct competitors: independent and portfolio brands | APR (Medicube), The Founders (Anua), Goodai Global (Beauty of Joseon, SKIN1004, TIRTIR, Round Lab), Beautyselection (Biodance), Torriden | Social-first, fast launch, derma-led |
| Direct competitors: mass and masstige | Nature Republic, Banila Co, TolyMoly, The Crème Shop, CARVER KOREA (Unilever) | Price-accessible routines |
| Manufacturing partners | Cosmax, Kolmar Korea, Cosmecca Korea, C&C International | ODM/OEM, not brand competitors |
| Retailers and platforms | CJ Olive Young, Sephora, Ulta Beauty, Boots, Douglas, Amazon, TikTok Shop, Nykaa, Silicon Two (StyleKorean) | Discovery, curation, distribution |
| Government, regulators and data bodies | Korea MFDS, Korea Customs Service, KHIDI, US FDA, EU CPNP, India CDSCO, Saudi SFDA; NielsenIQ, Numerator, Euromonitor | Regulation, trade statistics and market data |
Sources: Personal Care Insights; Cosmetics Business; Robin Report; brand ownership as publicly reported.
K-Beauty Brand Revenue and Competitive Benchmark: Top K-Beauty Companies, 2025
| Company | Growth | Operating profit / margin | Overseas exposure | Basis |
| AMOREPACIFIC Group | +8.5% | KRW 368 bn / 8.0%; highest since 2019 | Overseas revenue KRW 1.91 tn (+15%), about 45% of company revenue (MMR calc) | Company results |
| LG H&H (group) | −6.7% | KRW 170.7 bn / 2.7%; beauty division loss KRW 97.6 bn | Duty-free and China weakness; digital, H&B and overseas push | Company results |
| APR (Medicube) | +111% | KRW 365 bn / 24% | Overseas about 80%; US 39% of Q3 2025 revenue | Company results |
| The Founders (Anua) | +68% (MMR calc) | KRW 129.5 bn / 18.0% | US and Japan expansion; rising ad spend | Press report |
| Goodai Global | n/a | KRW 273.4 bn / 18.6% | Beauty of Joseon in about 500 US Sephora doors (2025) | Press report |
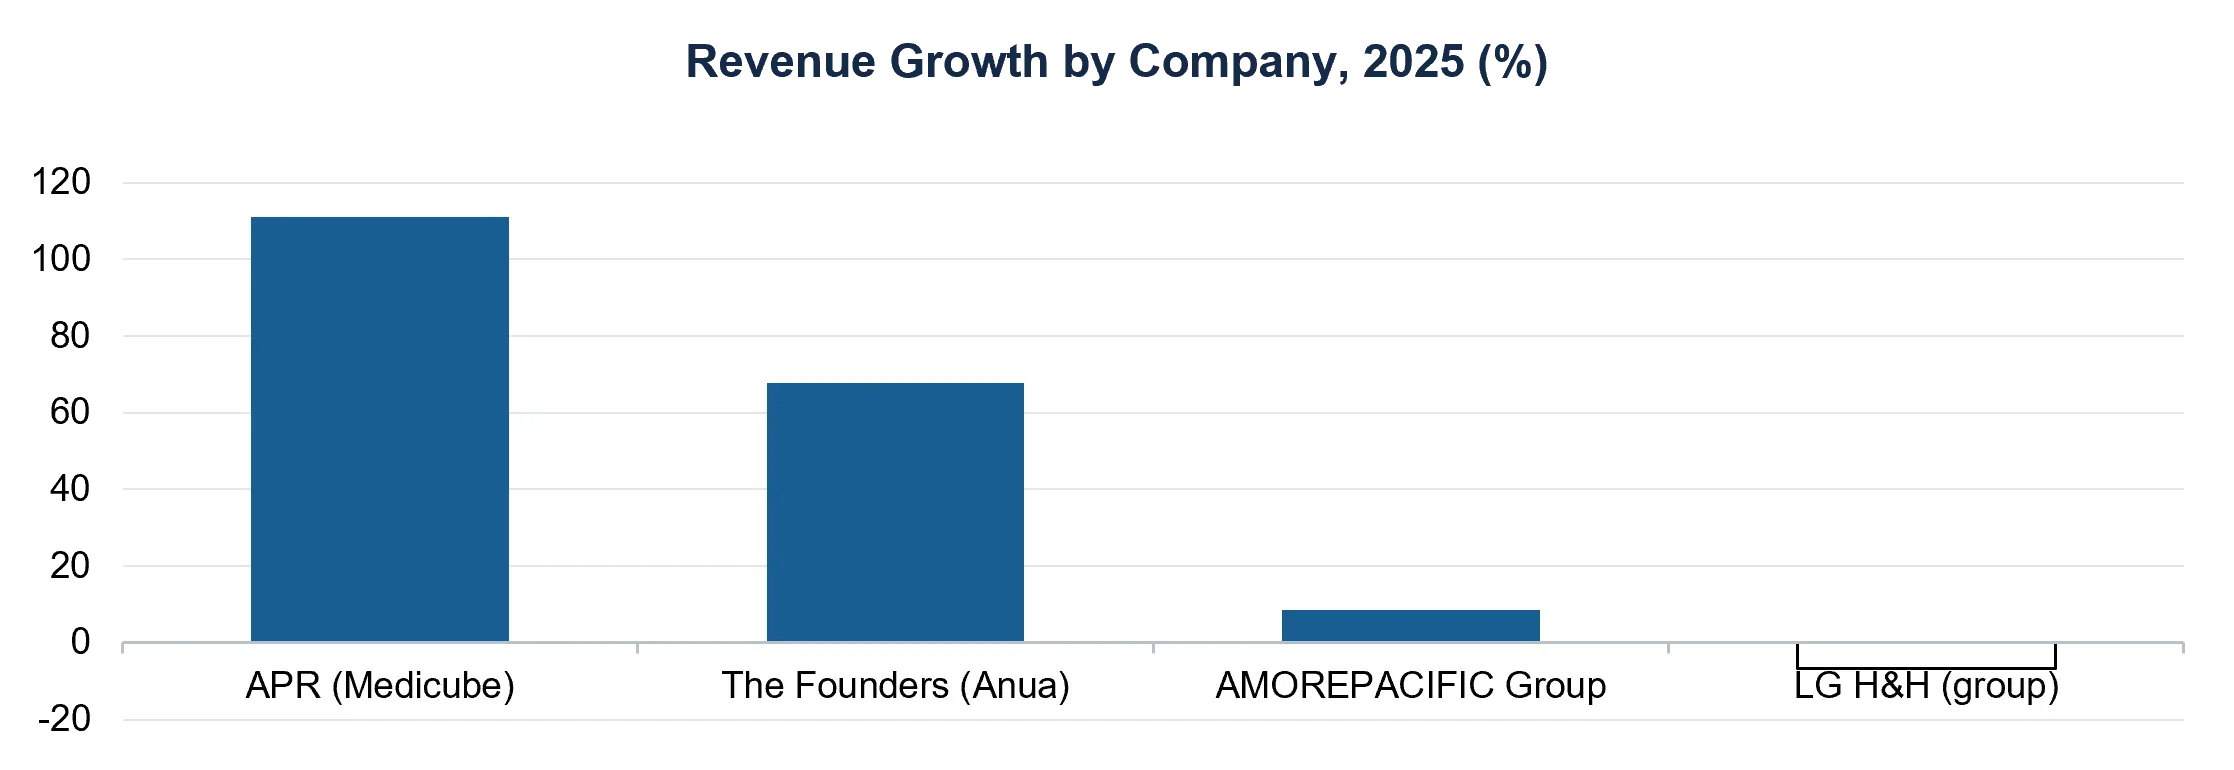 Source: AMOREPACIFIC Group, Korea Herald, Korea Times, Seoulz; MMR calculation for The Founders · Year: FY2025 · Unit: YoY revenue growth, % · Published (Estimated for The Founders). Goodai Global growth not shown because a comparable 2024 consolidated figure was not found; LG H&H is group-wide
K-Beauty Brand Matrix and Positioning Map: Which K-Beauty Brands Compete Where?
| Brand | Owner | Positioning (MMR) | Price tier (MMR) | Evidence |
| Laneige | AMOREPACIFIC | Lip and skin, young global | Masstige-premium | Top-5 US K-beauty by dollar sales (Numerator) |
| Sulwhasoo | AMOREPACIFIC | Heritage, ginseng | Prestige | – |
| AESTURA | AMOREPACIFIC | Derma | Premium | Global derma and Americas launch |
| COSRX | AMOREPACIFIC | Active-led, accessible | Mass-masstige | Top-5 US K-beauty by dollar sales (Numerator) |
| Innisfree / The Face Shop | AMOREPACIFIC / LG H&H | Nature-inspired, mass | Mass | – |
| Medicube | APR | Derma plus devices | Premium | No. 1 US K-beauty by dollar sales (Numerator) |
| Anua | The Founders | Gentle derma, hero toner | Masstige | Press-reported KRW 717.7 bn 2025 revenue |
| Beauty of Joseon | Goodai Global | Hanbang, sun care | Mass-masstige | No. 1 K-beauty suncare online (Euromonitor, 2025) |
| SKIN1004 / TIRTIR | Goodai Global | Centella / colour | Mass-masstige | KRW 280 bn / 270 bn 2024 brand sales |
| Biodance | Beautyselection | Collagen masks | Masstige | Top-5 US K-beauty by dollar sales (Numerator) |
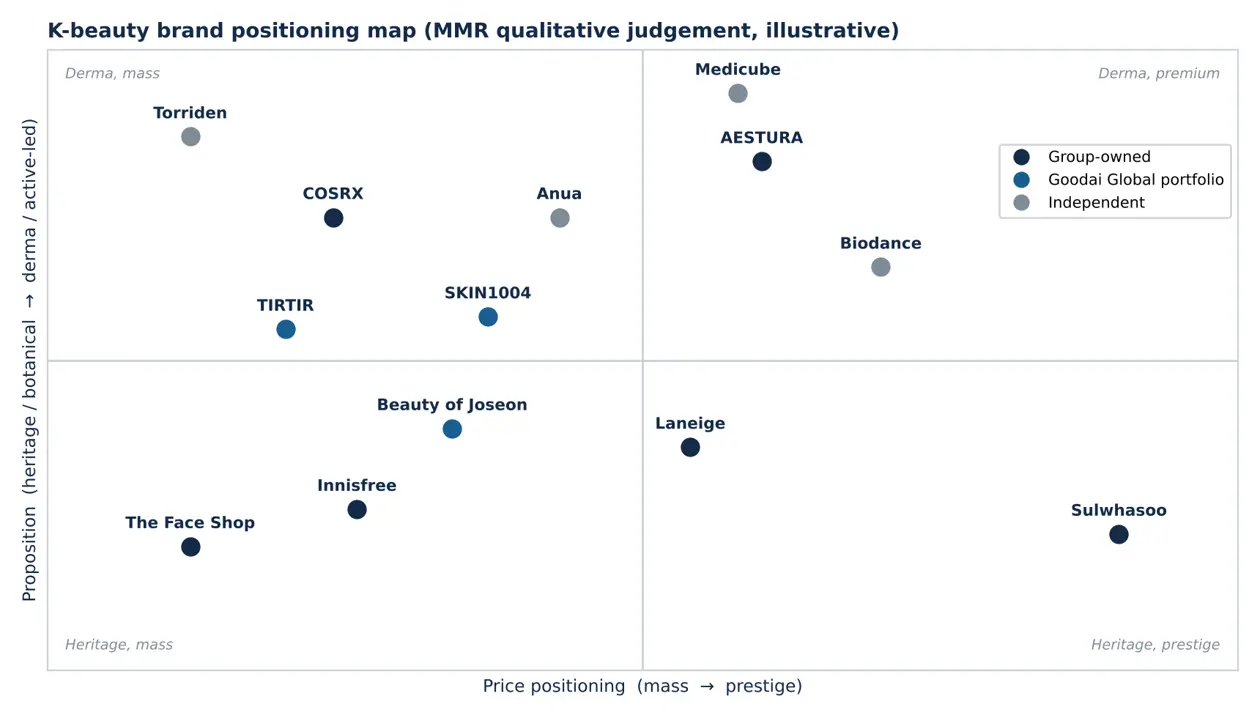 Source: MMR qualitative judgement · Year: 2026 · Unit: Relative position, not measured · Estimated (illustrative). Placement reflects MMR's view of price tier and proposition; it is not derived from sales or survey data
K-Beauty Competitive Positioning Strategies: How Do K-Beauty Brand Strategies Differ?
| Strategy | How it wins | Risk | |
| Retail-led expansion | Use Olive Young and Sephora shelf partnerships to reach stores and shoppers fast | Margin sharing and retailer dependence | |
| Social-first brand building | Viral hero products and creators drive demand | Trend fade and discount pressure | |
| Derma-cosmetic premiumisation | Active ingredients and clinical claims raise price points | Regulatory scrutiny of claims | |
| Acquisition roll-up | Buy proven brands and share distribution (Goodai Global) | Integration complexity and valuation | |
| Multi-brand portfolio | Spread risk across price tiers and countries | Complexity and capital intensity |
K-Beauty Products Pricing, Gross Margin and Channel Economics: How Do K-Beauty Brands Make Money per Unit?
Most K-beauty products sell for about USD 10 to 30 (Today.com), a band that leaves little room for a long distributor chain, so channel choice decides margin more than formulation. Brands do not disclose gross margin on a comparable basis, so MMR does not publish brand-level gross margins. The tables below combine reported evidence with clearly labelled MMR planning assumptions. See also: K-Beauty Market Entry Strategy; K-Beauty Value Chain and Profit Pool.
K-Beauty Sales by Channel in the US: Amazon, Online and In-Store Share
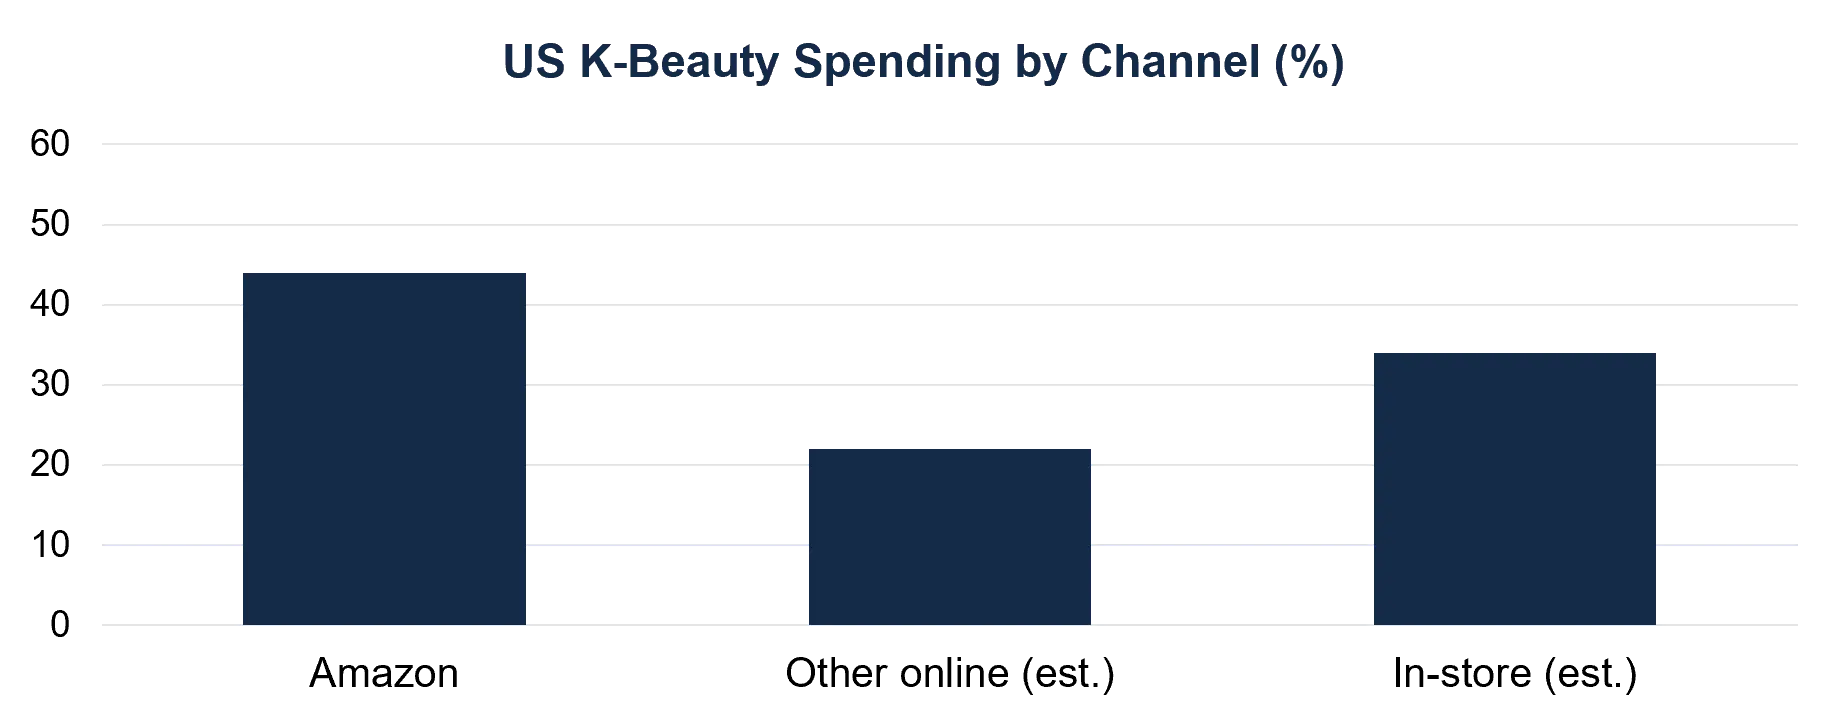 Source: Numerator (Amazon 44% and two-thirds digital); MMR calculation for the residual split · Year: 12 months to Q1 2026 · Unit: % of US K-beauty spending · Published (Amazon) and Estimated (other online, in-store). Other online = about two-thirds digital minus Amazon; in-store = remainder
K-Beauty Channel Economics: Marketplace, Social Commerce, Retail and Distributor Models
| Channel | Who takes a cut | Working take of retail price (MMR assumption) | Evidence |
| Brand direct site | Ad platforms, fulfilment, payments | About Xx% | Online is about two-thirds of US K-beauty sales (Numerator) |
| Marketplace (Amazon) | Referral, fulfilment, sponsored ads | About X% | Amazon holds 44% of US category spending; Medicube uses Prime Day |
| Social commerce (TikTok Shop) | Commission and creator fees | About X% | US K-beauty sales on TikTok Shop up 223% (Numerator); brand sales up 430% across US, UK, Spain, Germany (NIQ) |
| Specialty retail (Sephora, Ulta, Olive Young) | Retailer margin and marketing support | About X% | Beauty of Joseon in about 500 US Sephora doors; Olive Young opened Pasadena store, May 2026 |
| Distributor-led (Boots, Douglas, export distributor) | Importer, distributor and retailer | About X% | Europe: Korean brands about 10% of online skincare sales (NIQ) |
MMR assumptions are planning ranges for discussion, not reported figures. Validate against actual retailer and platform terms.
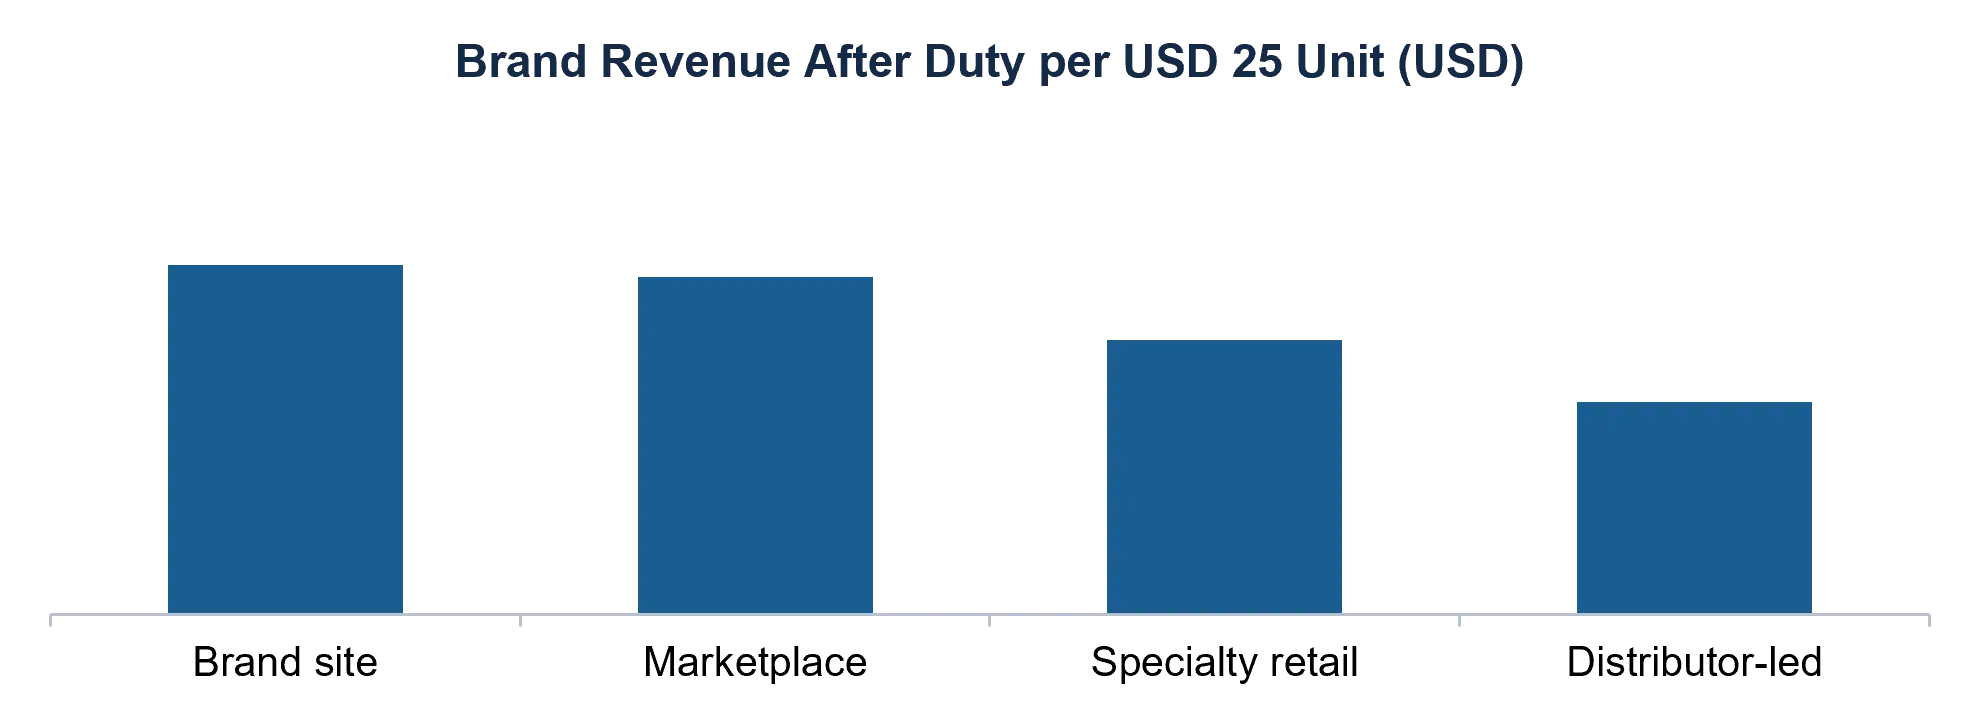
Source: MMR model using the assumed channel take above; 15% US framework tariff (Federal Register 2025-21940) · Year: 2026 · Unit: USD per unit · Estimated (MMR assumptions). Excludes cost of goods, VAT or sales tax, returns and marketing; duty applied to brand revenue as a proxy for import value; tariff rates change
| MMR READ-THROUGH |
| On these assumptions a brand keeps about USD 14.9 per unit on its own site but about USD 9.0 through a distributor-led chain: a gap of roughly 40%. Brands that scale through retail must price, or design cost, to survive the retailer margin (MMR judgement). |
K-Beauty Consumer Behaviour and Repeat Purchase: Who Buys K-Beauty Products, How Often and Why They Come Back
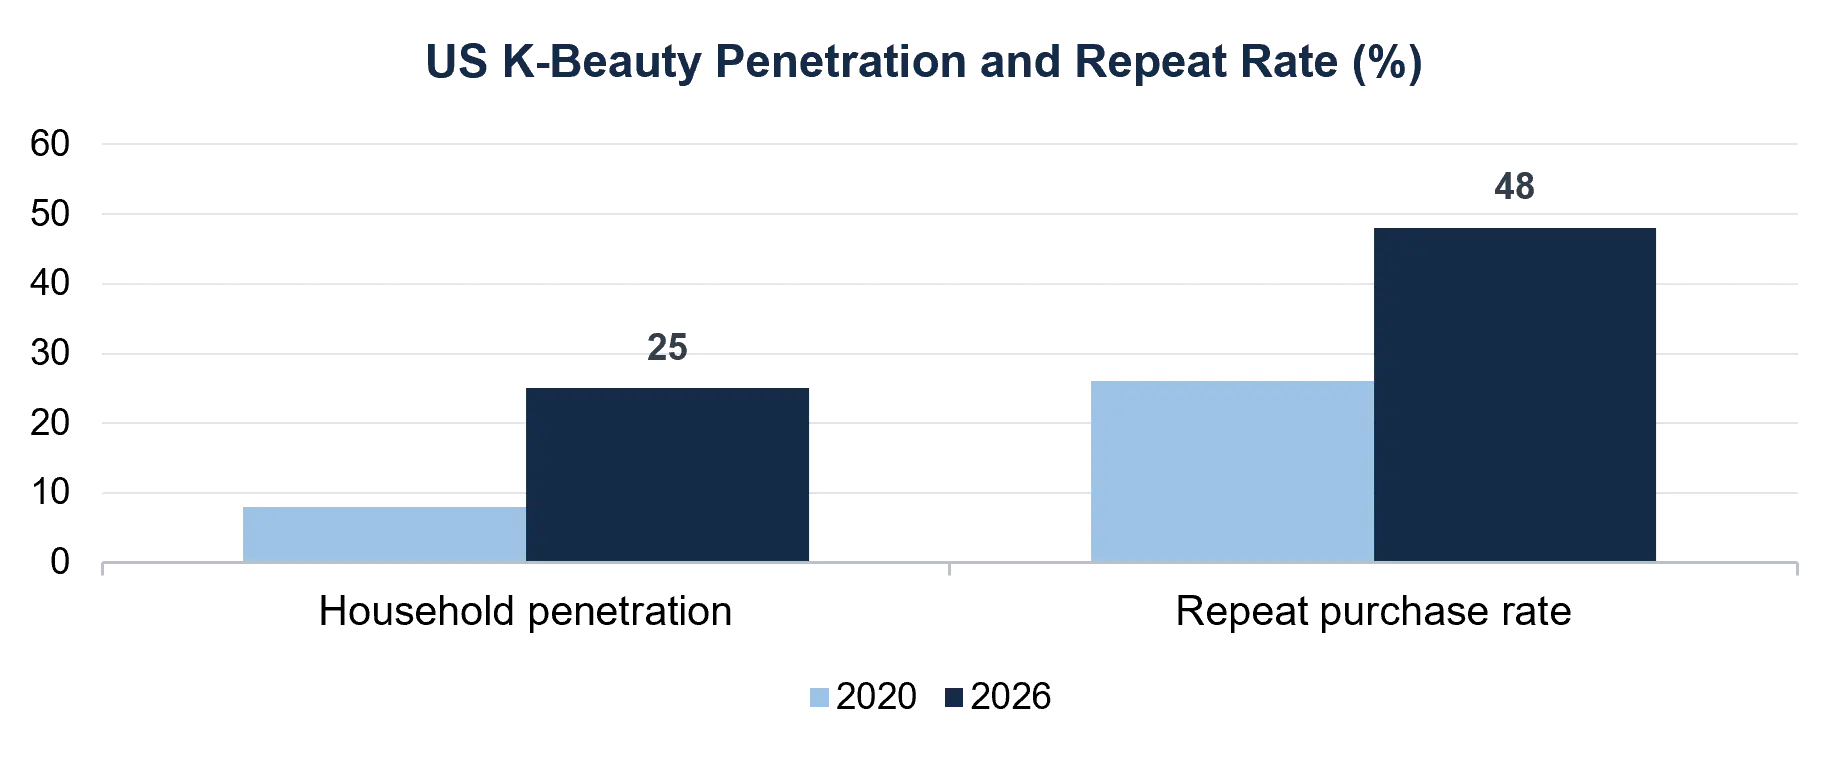
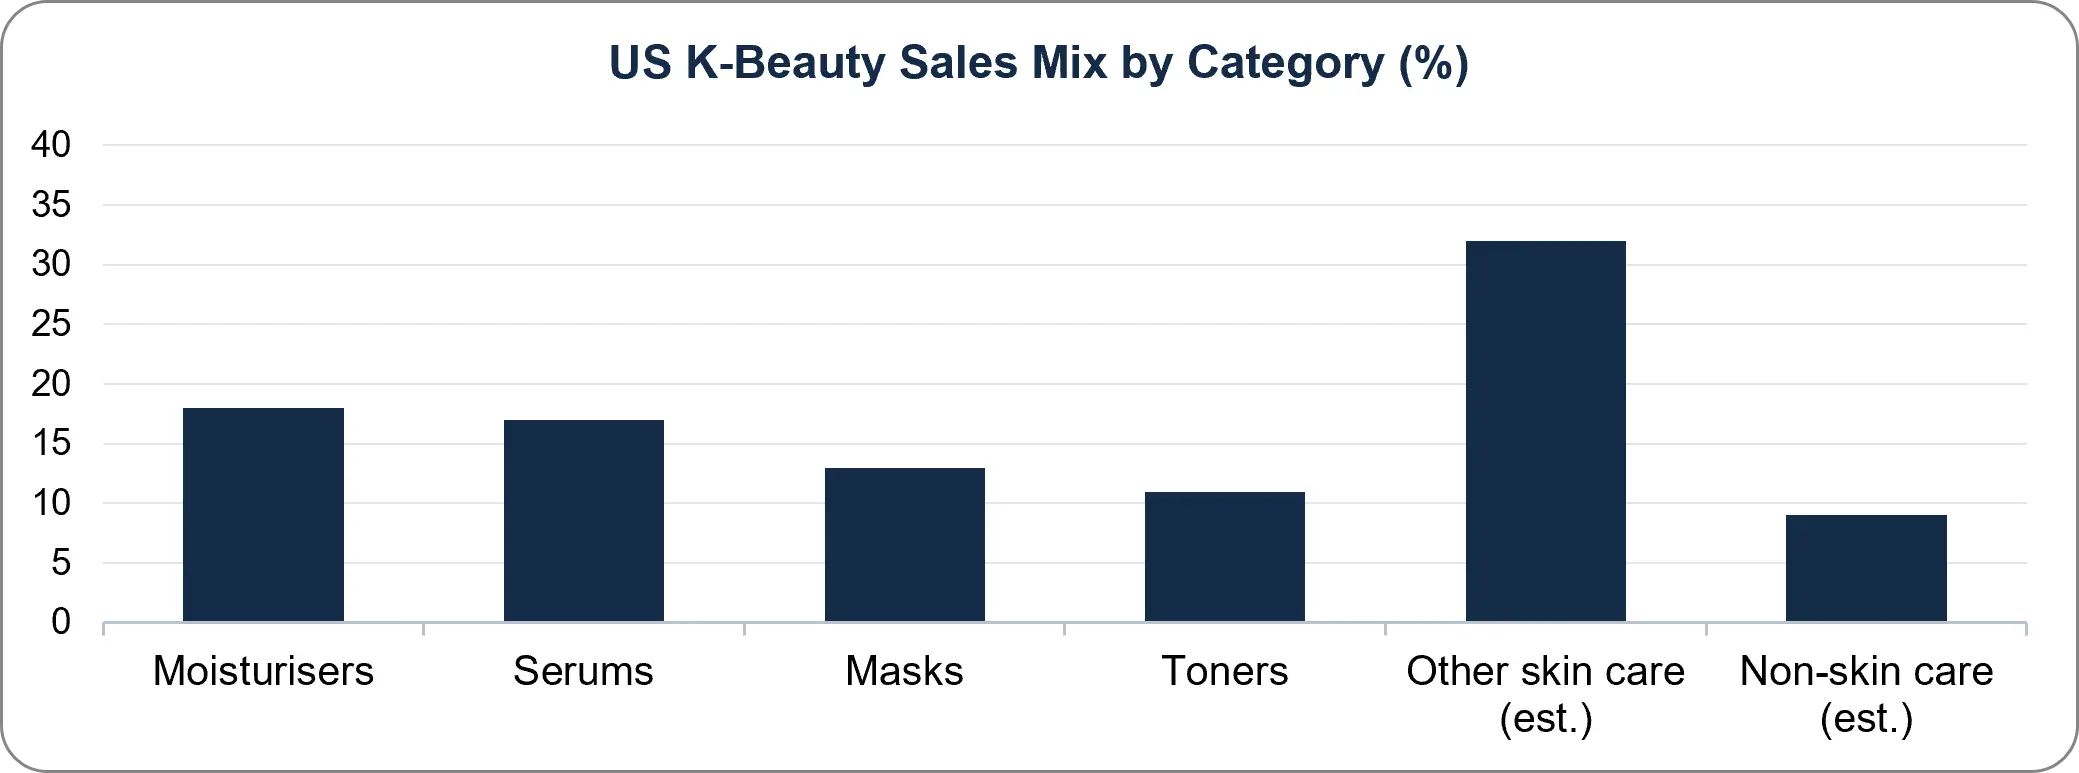
US data show K-beauty moving from trend to routine. Household penetration has tripled since 2020 and the repeat-purchase rate has nearly doubled. See also: Buyer's Guide for consumer routines and ingredients; Market Entry Strategy for channel sequencing.
K-Beauty Repeat Purchase and Household Penetration in the US, 2020 vs 2026
 What Drives K-Beauty Repeat Purchase? Product Mix and Brand Implications
K-Beauty ODM and OEM Contract Manufacturing Ecosystem: The Factories Behind the Global K-Beauty Products Market
Original design manufacturers (ODMs) let small brands launch fast: a founder can bring a concept and receive samples, formulation and production from the ODM. This is why many successful K-beauty brands own a label but no factory. See also: K-Beauty Value Chain and Profit Pool; Regulatory and Compliance by Region.
Korean Cosmetics Manufacturing in Numbers: Industry Revenue and Concentration
| Indicator | Value | Source |
| Korean cosmetics manufacturers' revenue, 2025 | KRW 27.48 tn (about USD 18 bn), +15.8% year on year | KHIDI via Outlook India |
| Number of manufacturers | Over 4,100; total count has fallen two years in a row while new ODM licences rose | KHIDI via Outlook India |
| Top four (Kolmar Korea, Cosmax, Cosmecca Korea, C&C International) | KRW 6.05 tn consolidated sales, about 22% of industry revenue (MMR calc; source: nearly one-quarter) | KHIDI via Outlook India |
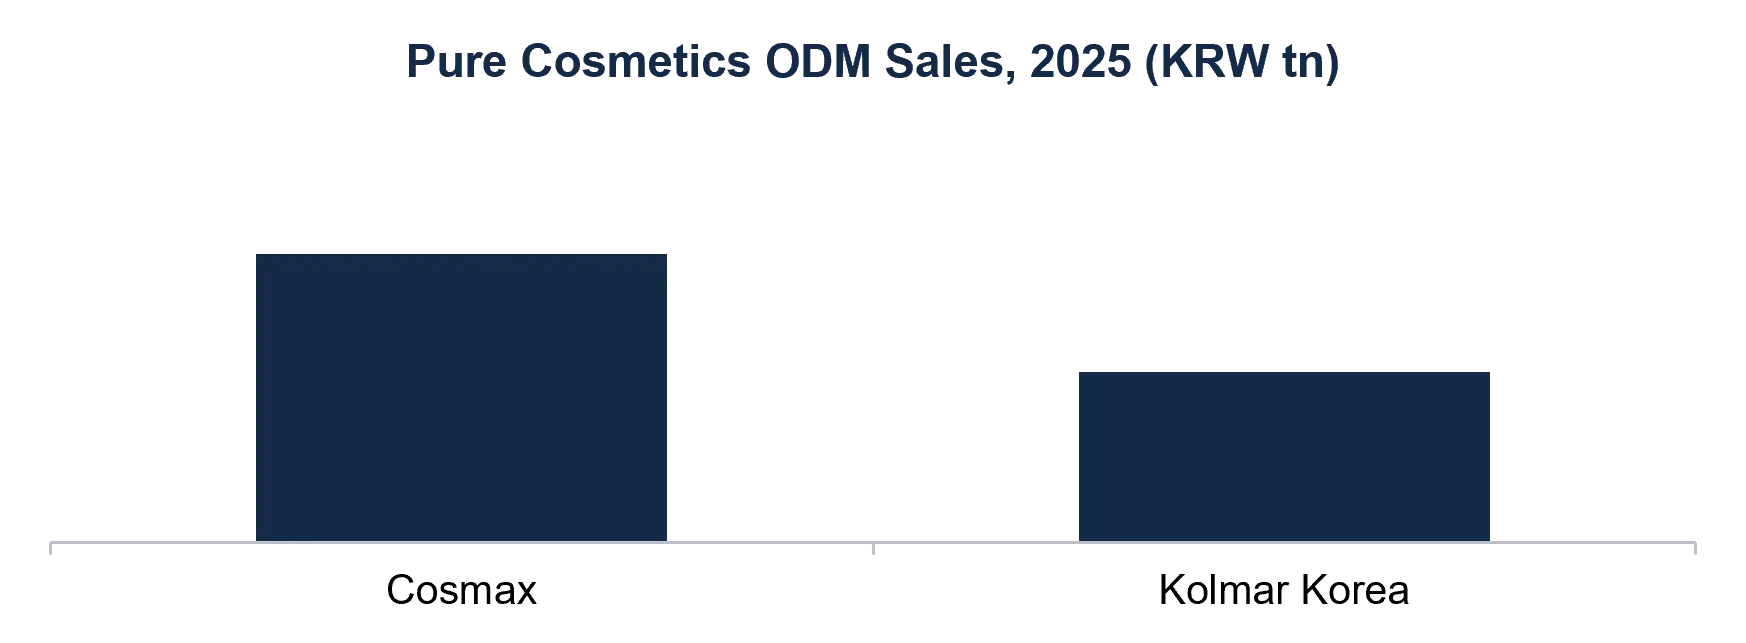
| Pure cosmetics ODM sales, 2025 | Cosmax KRW 2.17 tn; Kolmar Korea KRW 1.28 tn | Asiae |
| Q2 2026 global ODM revenue ranking | Cosmax KRW 794.9 bn; Kolmar Korea KRW 649.7 bn; Intercos (Italy) KRW 465.8 bn | Money Today |
 Leading K-Beauty ODM Companies: Cosmax, Kolmar Korea, Cosmecca Korea and C&C International
| Company | Latest evidence | What it means |
| Cosmax | Q2 2025 revenue KRW 623.6 bn (+13.1%), operating profit KRW 60.8 bn (+30.2%); Q2 2026 record, US unit's first quarterly profit since 2013 on revenue +79%; China revenue KRW 197.4 bn (+33%) | Largest pure cosmetics ODM; strong in US and China |
| Kolmar Korea | Q1 2026 cosmetics revenue KRW 412.1 bn (+19.0%), profit KRW 49 bn (+31.7%); Q2 2026 operating profit +50.2%; skin care about 70% of portfolio | Margin leader among ODMs; benefits from indie-brand orders and C-beauty outsourcing |
| Cosmecca Korea / C&C International | In the top four by consolidated sales; Cosmax and Cosmecca expanding production bases in Europe | Capacity near end markets reduces lead time and tariff exposure |
Sources: KHIDI via Outlook India; Asiae; Money Today; Quartr; Korea JoongAng Daily; FnNews. Company figures are as published.
How to Choose a K-Beauty ODM: MMR Checklist for New Brands
| Criterion | Why it matters | What to ask |
| Formulation library and speed | Samples in days shorten launch time | How many ready bases, how fast is first sample? |
| Minimum order quantity | Controls cash at risk for a new brand | MOQ per SKU and for sun care or colour |
| Regulatory support | Dossiers differ for the US, EU, India and Gulf | MoCRA, EU CPSR, CDSCO and SFDA experience |
| Local capacity | US or EU fill reduces tariff and lead time | Plants or partners near your end market |
| Exclusivity and IP | Shared formulas can be copied | Who owns the formula and can the ODM sell it to others? |
| Sun care capability | Sunscreens are regulated as drugs in the US | OTC drug compliance and testing capability |
K-Beauty Market Entry Models by Region: Market Signal and Recommended Route
| Region | Market signal | Recommended entry model |
| United States | NIQ: K-beauty USD 2.8 bn, +48%; 25% of households buy (Numerator); 15% framework tariff applies, subject to change | Validate on Amazon and TikTok Shop, then win Sephora, Ulta or Olive Young shelf; use US fulfilment and consider US-based contract fill |
| Europe | NIQ: Europe +58%; Korean brands about 10% of online skin care, 15–20% in Italy, Spain, France | Appoint an EU Responsible Person, notify on CPNP, launch online in Italy, Spain and France, then Boots, Douglas, Sephora |
| India | MarkNtel: USD 310 Mn (2025), 18.06% CAGR to 2032; online about 61.5% of revenue (ReportCubes) | Register through a licensed importer (CDSCO), launch on Nykaa and quick-commerce, then brand stores |
| Middle East | MEA 9.9% of 2025 market (); UAE is a top-ten Korean export destination | Appoint a regional distributor, list products with SFDA (Saudi) and the UAE authority, confirm halal alignment |
K-Beauty Regulatory and Product Compliance by Region: Korea, US, EU, India and the Middle East
Compliance is the gate between a successful formula and a legal sale. MMR summarises the main frameworks from published guidance; this is general information, not legal advice, and brands should confirm requirements with regulators or counsel. See also: ODM Ecosystem; Authenticity Checklist.
K-Beauty Cosmetic Regulations by Region: Registration, Labelling and Watch-Points
| Region | Law and authority | Pre-market step | Watch-point |
| Korea (exporter) | Ministry of Food and Drug Safety (MFDS), Cosmetics Act | Manufacturer and seller registration; functional cosmetics (for example UV protection) face additional review (MMR summary; confirm with MFDS) | Export documents and destination rules differ |
| United States | FDA, MoCRA (FD&C Act section 607) | Facility registration and product listing through Cosmetics Direct; safety substantiation; serious adverse event reporting; registration renewed every two years | Listing is not approval; sunscreens remain OTC drugs under monograph M020; small-business exemptions have exclusions |
| European Union | Regulation (EC) 1223/2009 | EU-based Responsible Person; Product Information File with safety report (CPSR); CPNP notification before sale; labelling per Article 19 | Over 1,300 banned or restricted ingredients; EU claims rules |
| India | CDSCO, Cosmetics Rules 2020 | Import registration in Form COS-1 on SUGAM; certificate in Form COS-2, valid five years; decision within up to six months | Applicant must be a licensed importer or authorised agent; labelling and BIS standards apply |
| Saudi Arabia and UAE | SFDA (Saudi), UAE ministry and Dubai Municipality; GCC GSO standards | Product listing (SFDA GHAD / eCosma; Montaji in Dubai); Certificate of Conformity; local authorised representative | Halal alignment (alcohol, animal derivatives); Arabic labelling; 5% UAE VAT |
Sources: FDA and MoCRA guidance via Registrar Corp, Biorius, Artixio; EU Regulation 1223/2009 via Biorius, Freyr, PharmaLex; CDSCO guidance document and Freyr; SGS, QIMA, CE.way and British Beauty Council (Middle East). Summaries only; confirm current rules before filing.
US Duty on Korean K-Beauty Products: Status Timeline and Why Rates Can Change
| Date | Event | Source |
| Jul 2025 to Dec 2025 | US–Korea deal: higher of KORUS or MFN rate, or 15%; implemented via Federal Register document 2025-21940 (4 Dec 2025) | KPMG; calcmytariff |
| 27 Jan 2026 | US announced a rise from 15% to 25% on Korean goods, citing Korea's legislature | Washington Times; AIR |
| 24 Feb 2026 | A new global tariff took effect at 10% | FnNews |
| 23 Jul 2026 | USTR announced Section 301 tariffs on 60 economies; 12.5% net of MFN applies to Korea, which seeks to keep the total within 15% | KEIA; Korea Times |
CLUSTER 2 · CONSUMER GUIDE
K-Beauty Buyer's Guide: What Is K-Beauty, How to Use It, Which Brands to Buy and Where
Part II answers the questions customers type into search engines. It is general information for shoppers and brand teams, not medical advice; anyone with a skin condition, allergy or pregnancy should consult a dermatologist.
What Is K-Beauty? Korean Beauty Meaning, Philosophy and Why It Is Popular
K-beauty (Korean beauty) is the skin care and cosmetics approach that comes from South Korea. It puts healthy, hydrated skin ahead of heavy coverage, relies on layered lightweight products, gentle formulations, barrier care and daily sun protection, and launches new textures and ingredients quickly. It is popular because products are accessible, results-focused, trend-aware and supported by Korean pop culture and strong retail.
K-Beauty vs J-Beauty vs Western Skincare: What Is the Difference?
| Feature | K-beauty | J-beauty | Western skin care |
| Routine | Multi-step, layered (3 to 10 steps) | Minimal, about 4 steps | Fewer steps, concern-led |
| Philosophy | Prevention, hydration, glow and skin barrier | Simplicity, tradition, healthy skin | Often corrective and active-led |
| Innovation pace | Very fast; new ingredients and formats | Slower, time-tested | Mixed |
| Signature items | Essences, ampoules, sheet masks, cushions, snail mucin, cica | Lightweight lotions, oils, advanced sunscreens | Serums with high-strength actives |
| Textures | Watery, gel, bouncy | Very light, milky, fluid | Creams, lotions |
| Shared ground | Double cleansing, sun protection, sheet masks, rice and green tea | Same | Increasingly adopting both |
Korean Skincare Routine: The 10-Step Order, Explained
| Step | Product | AM / PM | What it does |
| 1 | Oil or balm cleanser | PM | Melts sunscreen, makeup and sebum |
| 2 | Water-based (low-pH) cleanser | AM + PM | Removes sweat and water-based dirt |
| 3 | Exfoliator (AHA, BHA or gentle) | 1–3× a week | Clears dead cells and pores |
| 4 | Toner | AM + PM | Hydrates and preps skin |
| 5 | Essence | AM + PM | Lightweight hydration, often fermented ingredients |
| 6 | Serum or ampoule | AM + PM | Targets one concern (brightening, firming, calming) |
| 7 | Sheet mask | 1–3× a week | Intense hydration boost |
| 8 | Eye cream | AM + PM | Care for the thin eye area |
| 9 | Moisturiser | AM + PM | Seals in the layers |
| 10 | Sunscreen (SPF 30–50+, PA+++ / ++++) | AM, last step | UV protection; the non-negotiable step |
Korean Sunscreen Guide: SPF, PA++++, UV Filters and Why Korean Sunscreens Feel Different
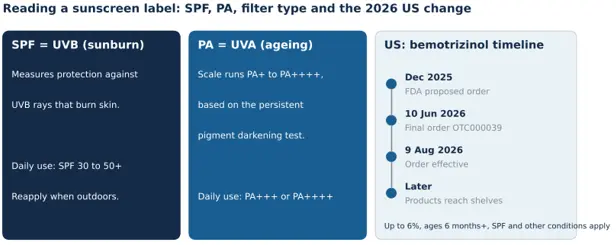
SPF measures protection against UVB (sunburn); PA measures protection against UVA (ageing) and runs from PA+ to PA++++, based on the persistent pigment darkening test. Daily use of SPF 30 to 50+ with PA+++ or PA++++ is the usual recommendation. Korean sunscreens often feel lighter because Korea, the EU and Japan approve newer UV filters than the US, which has cleared far fewer filters; in the US, FDA Final Order OTC000039 (10 June 2026) adds bemotrizinol at up to 6% to the OTC sunscreen monograph, subject to a minimum SPF and the order's other conditions, effective 9 August 2026; finished products reach shelves later. Filter rules differ by country, so check what is sold legally where you live.
K-Beauty Trends 2026: PDRN, Exosomes, Barrier Ecosystems, K-Pharmacy and Hair Care
| Trend | What it is | Customer takeaway | MMR view |
| PDRN | Clinic-inspired repair ingredient in toners, serums, masks | Good for dehydrated, stressed skin; check concentration claims | Mainstream, durable |
| Exosomes | Cell-derived ingredient borrowed from aesthetics | Treat as emerging; only human-derived exosomes are effective per Elle's sources | High hype, evidence early |
| Barrier ecosystem | Ceramides, cholesterol, fatty acids and postbiotics | Best first investment for sensitive skin | Strong, durable |
| Medicosmetic / K-pharmacy | Medical actives such as tranexamic acid, dexpanthenol, EGF | Look for derma brands such as AESTURA | Growing fast |
| Skincare sunscreens | Sunscreens with essence-like textures and skin benefits | Daily SPF that you will actually wear | Core category |
| Scalp and hair care | PDRN, exosomes, peptides move into hair care | Scalp health is the new skin care | Emerging category |
| Collagen masks | Overnight or sheet collagen masks | Weekly hydration treat | Steady |
| Spicules | Micro-needle-like ingredient (2026 buzz) | Can irritate; patch test | Early, watch |
How Much Does K-Beauty Cost? Price of a Korean Skincare Routine
Most K-beauty products sell for about USD 10 to 30 according to Today.com. Applying that band, a 3-step starter routine costs about USD 30 to 90, a 5-step routine about USD 50 to 150 and a full 10-step routine about USD 100 to 300 at launch prices. Sunscreen, serums and premium ginseng lines sit at the top of the band.
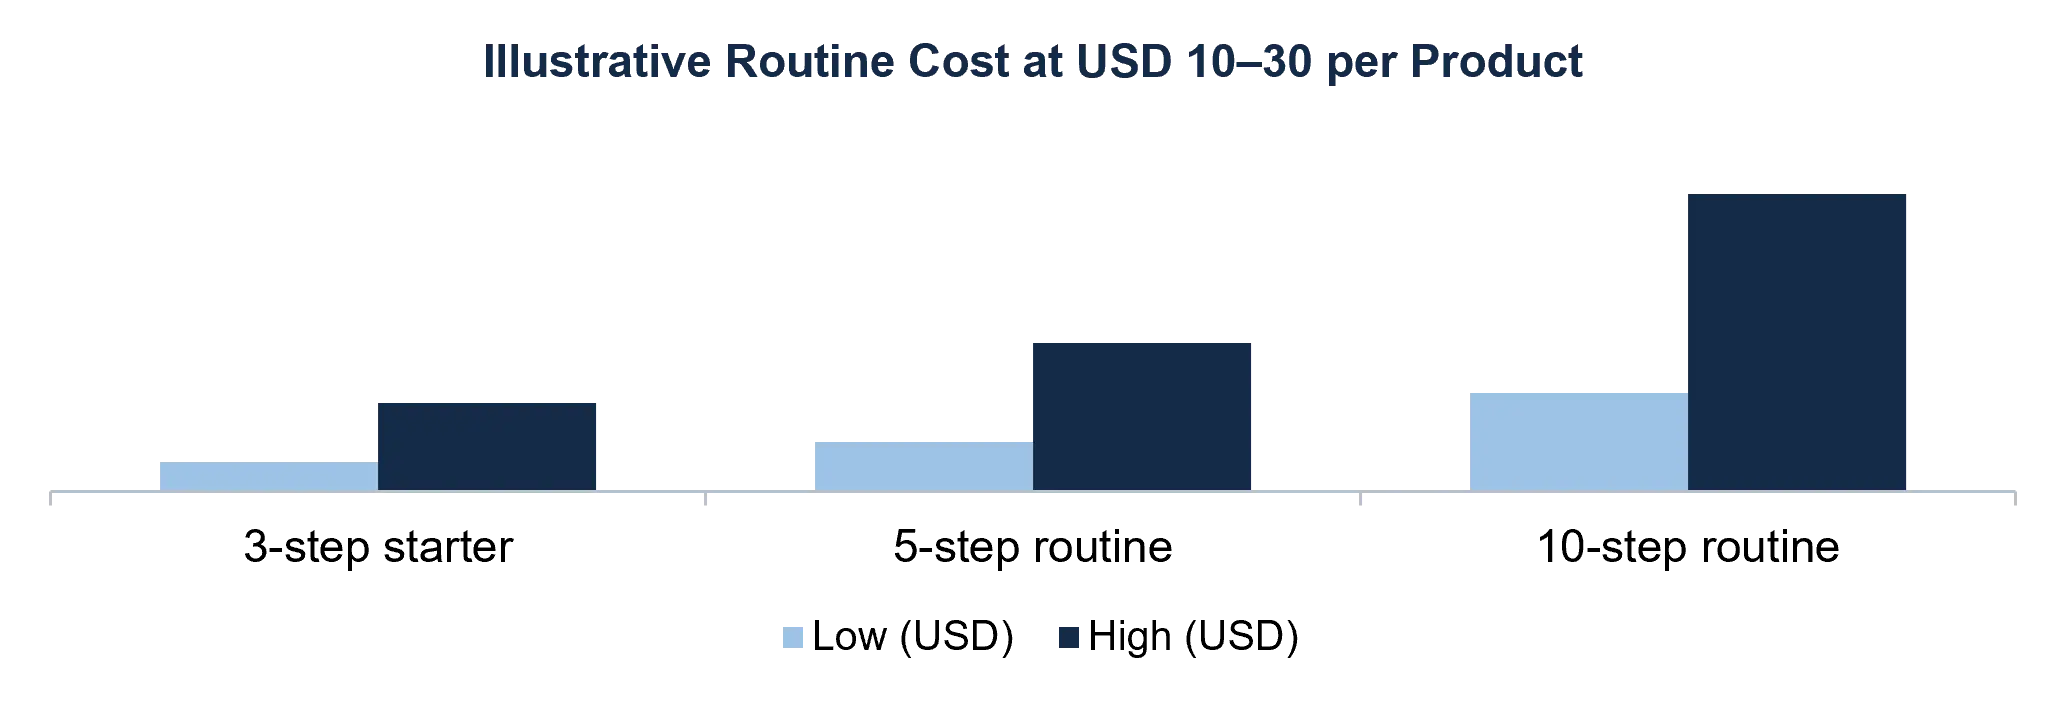 Source: MMR arithmetic on Today.com USD 10–30 per-product band · Year: 2026 · Unit: USD per routine · Estimated (illustrative). Varies by brand, country and retailer
Global K-Beauty Products Market Recent Developments, Retail Expansion and Industry News | 2026
| Date | Development | Why it matters |
| Jan 2026 | Korea reported record 2025 cosmetics exports of USD 11.43 Bn; the US overtook China as top destination | Confirms the geographic shift in demand |
| H2 2026 | CJ Olive Young and Sephora launch K-beauty zones across US, Canada, Singapore, Malaysia, Thailand and Hong Kong | Standardised K-beauty shelf space inside a global retailer |
| May 2026 | CJ Olive Young opened its first US store in Pasadena, California | Direct retail presence in the largest market |
| Q2 2026 | Amorepacific revenue +14.6% to KRW 1.25 trillion; operating profit +53.3% | Overseas sales offset China weakness |
| H1 2026 | Korea cosmetics exports about USD 7 Bn, +27.3% year on year | Momentum continues despite US tariffs |
| 2026 | K-beauty brands expand into Boots, Sephora and Douglas in Europe | Widens European access |
Sources: Personal Care Insights; Cosmetics Business; CJ Newsroom; Robin Report; Korea Ministry of Food and Drug Safety.
Global K-Beauty Products Market Risks and Early-Warning Indicators
| Risk | Early-warning indicator | Impact on forecast |
| Tariff escalation | US duty changes on Korean goods; landed-cost increases | Moves base toward bear (−2 pts CAGR) |
| Trend fatigue | Slowing repeat purchase; falling marketplace ranking of hero SKUs | Lower growth in skin care |
| Retail margin squeeze | Higher retailer terms and discounting | Compresses brand profit, not necessarily revenue |
| Regulatory tightening | New EU or US claims and ingredient rules | Delays launches in key regions |
| Upside: new markets | Export growth to UAE, Poland, India, Latin America | Moves toward bull (+2 pts CAGR) |
K-Beauty Market Investment Outlook: Where to Invest and What to Build
| Stakeholder | What to do through 2034 |
| K-beauty brands | Secure US and European shelf space, extend into colour and men's ranges, build compliance by region |
| Retailers | Invest in K-beauty curation, store formats with skin diagnostics, and exclusive brand partnerships |
| Contract manufacturers | Add capacity near the US and Europe to blunt tariffs and shorten lead times |
| Investors | Back independent growth brands with repeat-purchase data and multi-region distribution |
Global K-Beauty Products Market Scope:Inquire before buying
| K-Beauty Products Market | |||
|---|---|---|---|
| Report Coverage | Details | ||
| Base Year: | 2025 | Forecast Period: | 2026-2034 |
| Historical Data: | 2020 to 2025 | Market Size in 2025: | 120.5 USD Billion |
| Forecast Period 2026-2034 CAGR: | 11.5% | Market Size in 2034: | 321 USD Billion |
| Segments Covered: | by Product Type | Skin Care Colour Cosmetics (Makeup) Hair Care Body Care Fragrances Others |
|
| by Product Form | Creams & Lotions Serums & Ampoules Sheet Masks Cleansers & Toners Sun Care Others |
||
| by Skin Concern / Claim | Hydration & Barrier Care Brightening Anti-Ageing Soothing & Sensitive Skin Acne & Blemish Others |
||
| by End User | Women Men Unisex |
||
| by Price Tier | Mass Masstige Premium |
||
| by Distribution Channel | Online (Brand Sites, Marketplaces, Social Commerce) Specialty Beauty Stores Hypermarkets & Supermarkets Department Stores Pharmacies & Drugstores Others |
||
| by Brand Type | Established Group Brands Independent / Growth Brands Private Label & ODM-Led Brands |
||
Global K-Beauty Products Market, by Region
North America (United States, Canada, Mexico, Rest of North America)
Europe (United Kingdom, Germany, France, Italy, Spain, Poland, Rest of Europe)
Asia Pacific (China, Japan, South Korea, India, Australia, Singapore, Malaysia, Thailand, Rest of Asia Pacific)
Middle East & Africa (UAE, Saudi Arabia, South Africa, Rest of MEA)
Central & South America (Brazil, Argentina, Chile, Rest of Central & South America)
Global K-Beauty Products Market, Key Players
Direct competitors: legacy groups
1. AMOREPACIFIC
2. LG H&H
3. Able C&C
4. Clio
Direct competitors: independent and portfolio brands
5. APR Corporation (Medicube)
6. The Founders (Anua)
7. GOODAI GLOBAL (Beauty of Joseon, SKIN1004, TIRTIR)
8. Beautyselection (Biodance)
9. Torriden
Direct competitors: mass and masstige
10. CARVER KOREA (Unilever)
11. Nature Republic
12. Banila Co
13. TolyMoly
14. The Crème Shop
15. The Face Shop
ODM and OEM manufacturers
16. Cosmax
17. Kolmar Korea
18. Cosmecca Korea
19. C&C International
Retailers and platforms
20. CJ Olive Young
21. Sephora
22. Ulta Beauty
23. Boots
24. Douglas
25. Amazon
26. TikTok Shop
27. Nykaa
28. Silicon Two (StyleKorean)
Government, regulators and data bodies
29. Korea Ministry of Food and Drug Safety
30. Korea Customs Service
31. Korea Health Industry Development Institute
32. US FDA
33. India CDSCO
34. Saudi SFDA
35. NielsenIQ
36. Numerator
37. Euromonitor International
Frequently Asked Questions
What is the size and forecast of the global K-beauty products market?
MMR values the global K-beauty products market at USD 120.5 billion in 2025, USD 134.4 billion in 2026 and USD 321.0 billion by 2034, an 11.5% CAGR over 2026–2034. The market doubles in about 6.4 years, between 2031 and 2032.
Which region and country is the largest K-beauty market?
North America holds the largest share at 34.4% in 2025, with the US about 68% of the region. The US is also Korea's top cosmetics export destination (USD 2.19 billion in 2025), ahead of China (USD 2.01 billion, down 19.2%). Asia Pacific is projected to grow at 11.3% CAGR.
Which K-beauty segments and channels are growing fastest?
Skin care leads with about 56.9% of 2025 sales; colour cosmetics is the fastest-growing product segment at 12.3% CAGR, men's products grow at 10.9% and online is the fastest channel at 11.8%.
Who are the leading K-beauty companies and best K-beauty brands?
Key companies include AMOREPACIFIC, LG H&H, Able C&C, Clio, CARVER KOREA (Unilever), Nature Republic, Banila Co and TolyMoly. Popular 2026 brands include COSRX, Beauty of Joseon, Anua, Laneige, SKIN1004, Medicube, Torriden, AESTURA and Sulwhasoo.
What is K-beauty and why is it so popular?
K-beauty is Korean skin care and cosmetics built on layered lightweight routines, hydration, gentle formulations, barrier care and daily sunscreen. It is popular because of affordable innovation, Korean pop culture, fast product launches and retailer partnerships such as Olive Young and Sephora.
What is the Korean skincare routine and how many steps do I need?
The classic 10 steps are oil cleanser, water cleanser, exfoliator, toner, essence, serum, sheet mask, eye cream, moisturiser and sunscreen. Most people need only 3 to 5 steps: cleanser, hydrator or serum, moisturiser and sunscreen, adding double cleansing at night.
What are the best K-beauty ingredients, including PDRN and snail mucin?
Popular ingredients are snail mucin (hydration), centella or cica (soothing), niacinamide (tone and oil control), propolis (glow), rice and ginseng (brightening and firmness), ceramides (barrier) and PDRN, the defining 2026 repair ingredient. Exosomes are an emerging trend with evidence still developing.
Is Korean sunscreen better, and what do SPF and PA++++ mean?
SPF measures UVB protection (sunburn) and PA measures UVA protection (ageing) from PA+ to PA++++. Korean sunscreens are often lighter because Korea, the EU and Japan approve newer UV filters than the US, but filter rules differ by country. Use SPF 30 to 50+ with PA+++ or PA++++ daily.
Is K-beauty good for oily, dry, sensitive or acne-prone skin?
Yes, when matched to skin type: gel textures, niacinamide and BHA for oily or acne-prone skin; hydrating toners, ceramides and richer creams for dry skin; centella, heartleaf and fragrance-free formulas for sensitive skin. Always patch test, add one product at a time and see a dermatologist for persistent skin conditions.
How much does K-beauty cost and where can I buy real products?
Most products cost about USD 10 to 30, so a 5-step routine is about USD 50 to 150. Buy from brand stores, Olive Young, Sephora, Boots, Douglas, Nykaa (India) and authorised online sellers.
How can I spot fake K-beauty products?
Buy from authorised sellers, distrust very low prices, verify the batch or lot code and any brand authentication tool, check the regulatory label for importer details and the ingredient list, and compare packaging, smell and texture. A barcode prefix is not proof of origin or authenticity. Stop use if irritation occurs.
Is K-beauty growing in India, and what are the 2026 trends?
Yes. MarkNtel sizes India K-beauty at USD 310 million in 2025, growing 18.06% a year to USD 872 million by 2032. Key 2026 trends are PDRN, exosomes, barrier ecosystems, dermocosmetics, skincare-sunscreens, scalp care and collagen masks.
Global K-Beauty Products Market Research Methodology
MMR sized the market top-down from a 2025 base of USD 120.5 billion and an 11.5% CAGR for 2026–2034, then triangulated against published market reports (), Korean export statistics (Ministry of Food and Drug Safety, Korea Customs Service) and company and retailer announcements. Segment and regional shares are as published and applied to the MMR base where marked as estimates. Annual values are constant-CAGR interpolation. Scenario CAGRs and opportunity levers are MMR judgement.